Submarine topography analog simulation method based on multi-scale chart data

A sea chart data and simulation technology, which is applied in image data processing, design optimization/simulation, 3D modeling, etc., can solve the problems of insufficient fineness of seabed terrain simulation and simulation, and achieve strong self-adaptation and easy data acquisition

Active Publication Date: 2020-04-03
THE CHINESE PEOPLES LIBERATION ARMY 92859 TROOPS
View PDF5 Cites 2 Cited by
  • Summary
  • Abstract
  • Description
  • Claims
  • Application Information

AI Technical Summary

Problems solved by technology

[0006] The purpose of the present invention is to overcome the deficiencies in the prior art, and propose a seabed terrain simulation method based on multi-scale chart data, which uses multi-scale chart data to break through "optimal scale estimation" and "associated data extraction" Two core issues, to achieve the effect of "coverage of user needs" and "balance of effect and efficiency", and solve the problem of insufficient precision of seabed terrain simulation

Method used


Image

  • Submarine topography analog simulation method based on multi-scale chart data
  • Submarine topography analog simulation method based on multi-scale chart data
  • Submarine topography analog simulation method based on multi-scale chart data

Examples


Embodiment Construction

[0049] Embodiments of the present invention will be described in further detail below in conjunction with the accompanying drawings.

[0050]A method for simulating seabed terrain based on multi-scale chart data, comprising the following steps:

[0051] Step 1. Estimating the optimal scale of multi-scale chart data, the specific method is:

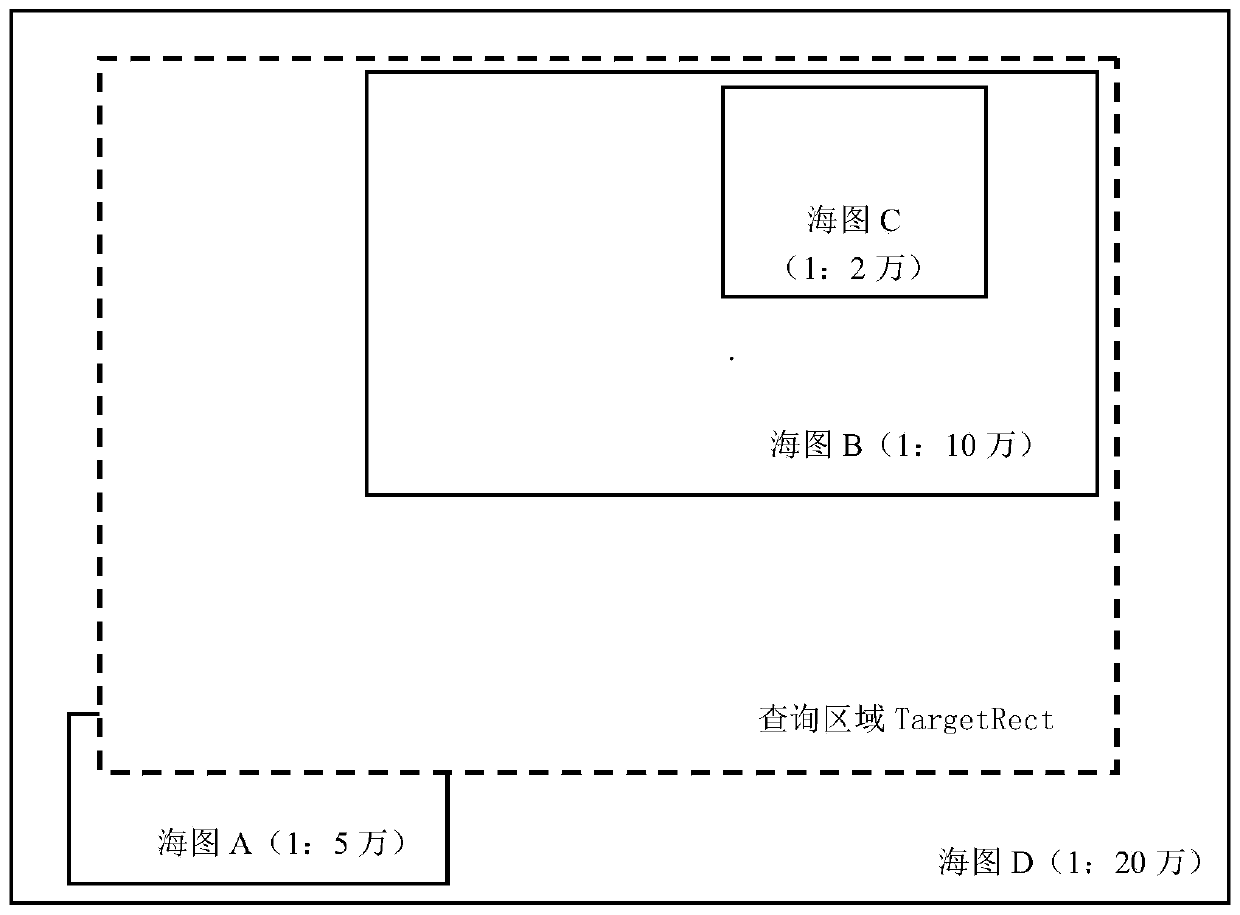
[0052] (1) The user inputs the geographic space range (rectangle) TargetRect to be queried;

[0053] ⑵Calculate the actual area T of TargetRect (unit: m 2 ), the water depth point processing limit is estimated to be MaxCount, and the overall average value of the water depth interval is estimated to be D (unit: m).

[0054] (3) Estimate the average occupied area A of a single water depth point (unit: m 2 ), A=T / MaxCount.

[0055] (4) The denominator of the best estimated scale is M, M=Sqrt(A) / D.

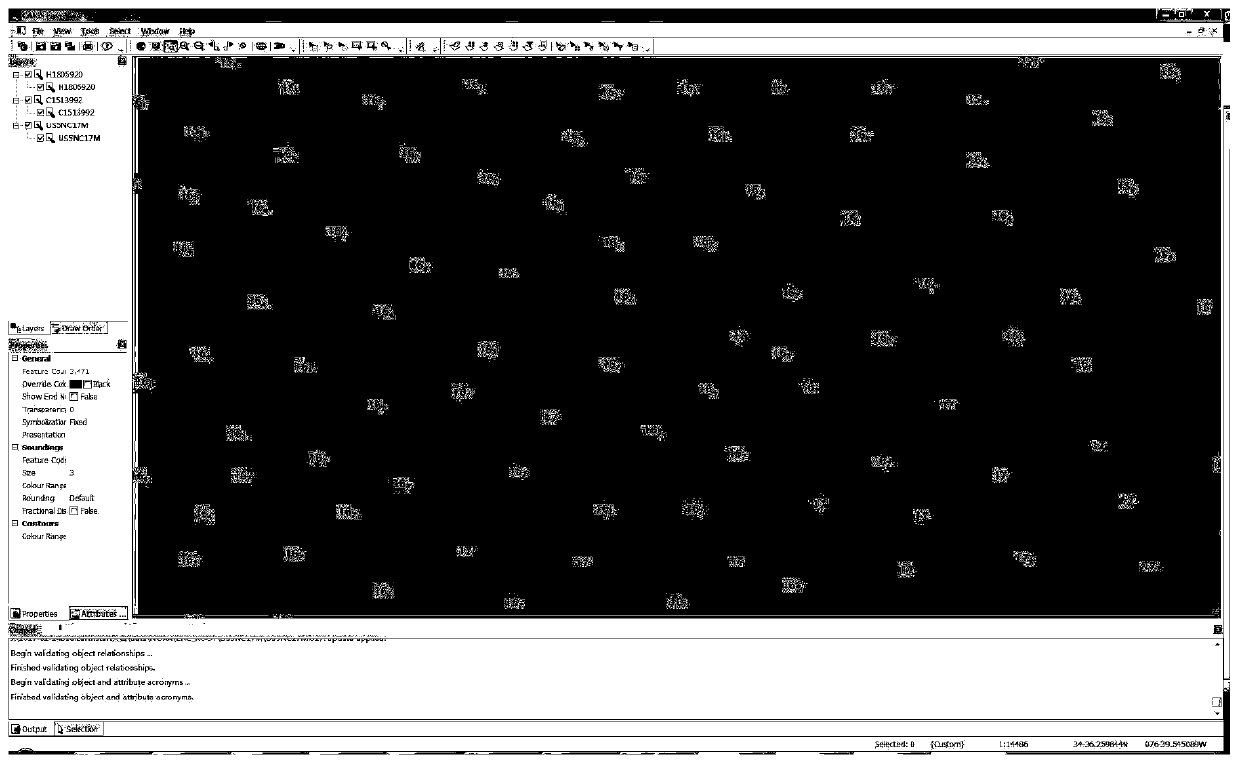
[0056] Below to figure 1 The rhombus distribution of water depth derived from US5NC17M.000 is given as an example to illustrate this step....


PUM


Abstract

The invention relates to a submarine topography analog simulation method based on multi-scale chart data. The submarine topography analog simulation method is mainly and technically characterized by comprising the steps: estimating the optimal scale of the multi-scale chart data; calculating associated chart data according to the geographic space range to be queried; extracting a water depth pointand a land area; performing regular grid interpolation on the submarine topography and splicing the submarine topography with sea and land; and constructing a sea-land three-dimensional rendering graph by using a colored tape color matching method. The method is reasonable in design, submarine topography analog simulation is achieved on the basis of chart data, and data acquisition is easier; through combination of multi-scale data, irregular features of chart framing can be flexibly adapted; through optimal scale estimation, better balance can be obtained in the aspects of effect and efficiency; after the submarine topography and the land topography are spliced, rendering is carried out through a unified color band, and the effects of attractiveness and high efficiency are achieved.

Description

technical field [0001] The invention belongs to the technical field of marine surveying and mapping, in particular to a seabed terrain simulation method based on multi-scale chart data. Background technique [0002] Seabed terrain simulation is of great significance to marine research, development and utilization. Due to confidentiality reasons, it is difficult to obtain the original data of bathymetry, and the international public seabed terrain regular grid data has insufficient resolution and accuracy, which cannot meet the needs of diverse applications. Compared with topographic map data, electronic nautical chart data has irregularities in latitude and longitude range and scale, etc., according to the purpose (usually divided into: overview, general, offshore, coastal, port, anchoring), navigation area and data mastery, etc. The factors are comprehensively determined. Electronic nautical charts for the same purpose involve several different scales and have a certain r...

Claims


Application Information

Patent Timeline
Patent Type & Authority Applications(China)
IPC IPC(8): G06T17/05G06F30/20
CPCG06T17/05
Inventor 陈长林陈长清贾俊涛张博赵健陈超王耿峰
Owner THE CHINESE PEOPLES LIBERATION ARMY 92859 TROOPS
Why Eureka
Try Eureka