Grid-based high-temperature real-time early warning publishing and displaying method, system and equipment
A display method and grid technology, applied to the temperature measurement of moving fluids, thermometers, alarms, etc., can solve the problems of large differences in basic air temperature and achieve the effect of improving accuracy and reducing injuries
- Summary
- Abstract
- Description
- Claims
- Application Information
AI Technical Summary
Problems solved by technology
Method used
Image
Examples
Embodiment 1
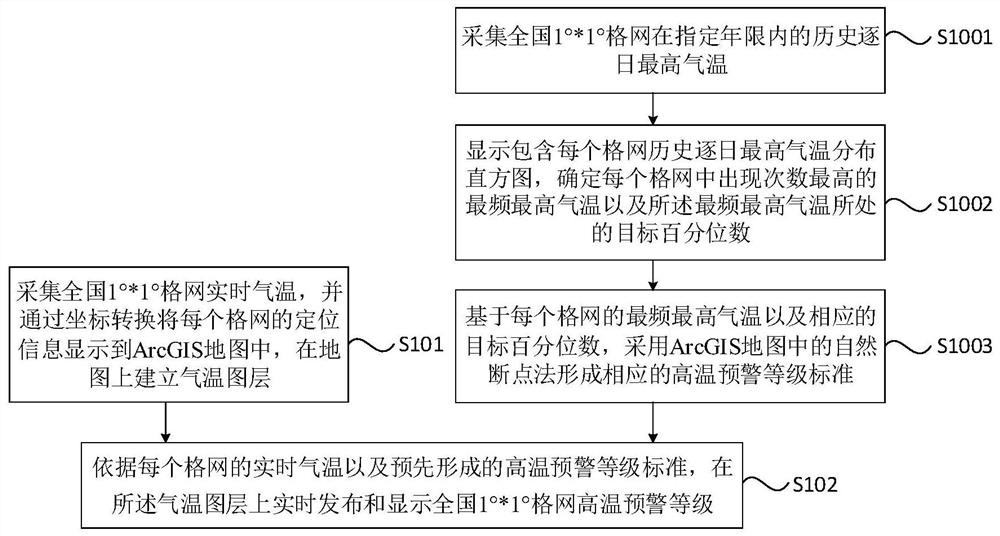
[0034] figure 1 It is a flow chart of a grid-based real-time high temperature early warning release and display method provided by Embodiment 1 of the present invention. This embodiment is applicable to the high temperature early warning release and display for any region. A grid-based real-time high-temperature early warning release and display method provided in this embodiment can be executed by a grid-based high-temperature real-time early warning release and display system provided in an embodiment of the present invention. The system can use software and / or hardware implemented in a manner, and integrated in an electronic device performing the method.
[0035] see figure 1 , the method of this embodiment includes but not limited to the following steps:
[0036] S101. Collect the real-time temperature of the national 1°*1° grid, and display the positioning information of each grid on the ArcGIS map through coordinate conversion, and establish a temperature layer on the ...
Embodiment 2
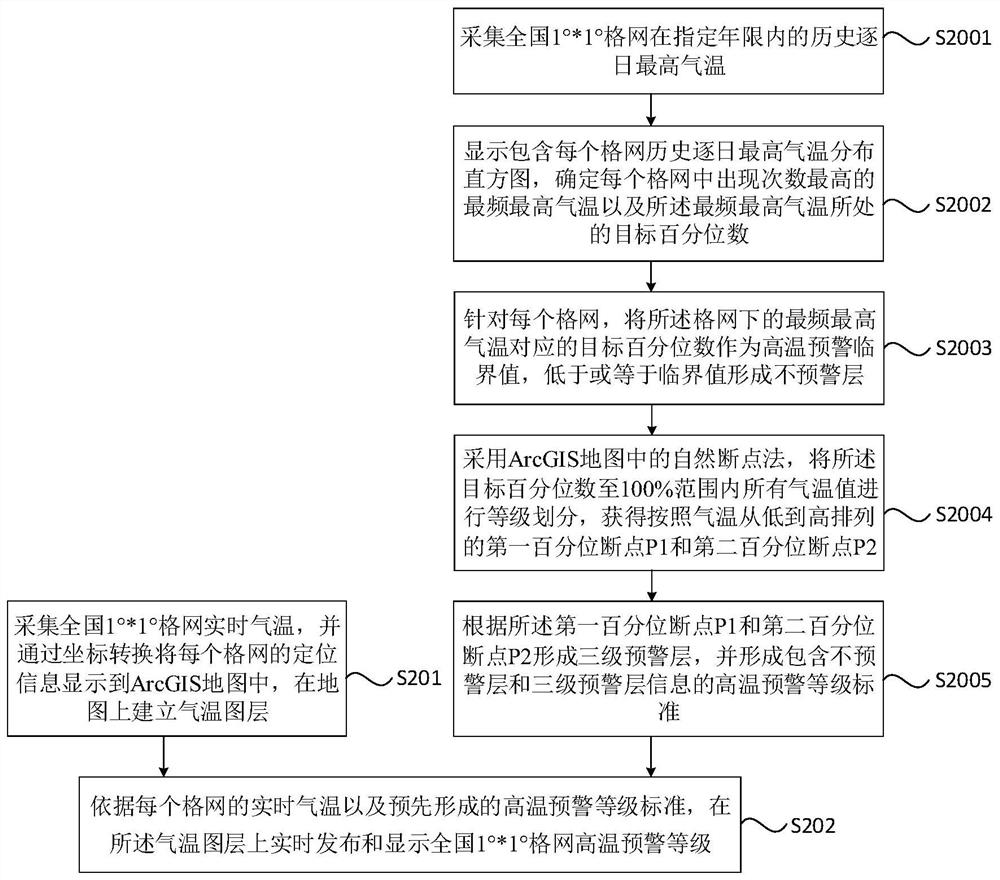
[0062] figure 2 It is a flow chart of a grid-based high temperature real-time early warning issuing and displaying method provided by Embodiment 2 of the present invention. The embodiments of the present invention are optimized on the basis of the foregoing embodiments. Optionally, this embodiment explains in detail the formation process of the high temperature warning level standard.
[0063] see figure 2 , the method of this embodiment includes but not limited to the following steps:
[0064] S201. Collect the real-time temperature of the national 1°*1° grid, and display the positioning information of each grid on the ArcGIS map through coordinate conversion, and establish a temperature layer on the map.
[0065] Optionally, the step of determining the high temperature warning level standard includes:
[0066] S2001. Collect the historical daily maximum temperature of the national 1°*1° grid within a specified period of time.
[0067] S2002. Display a histogram contai...
Embodiment 3
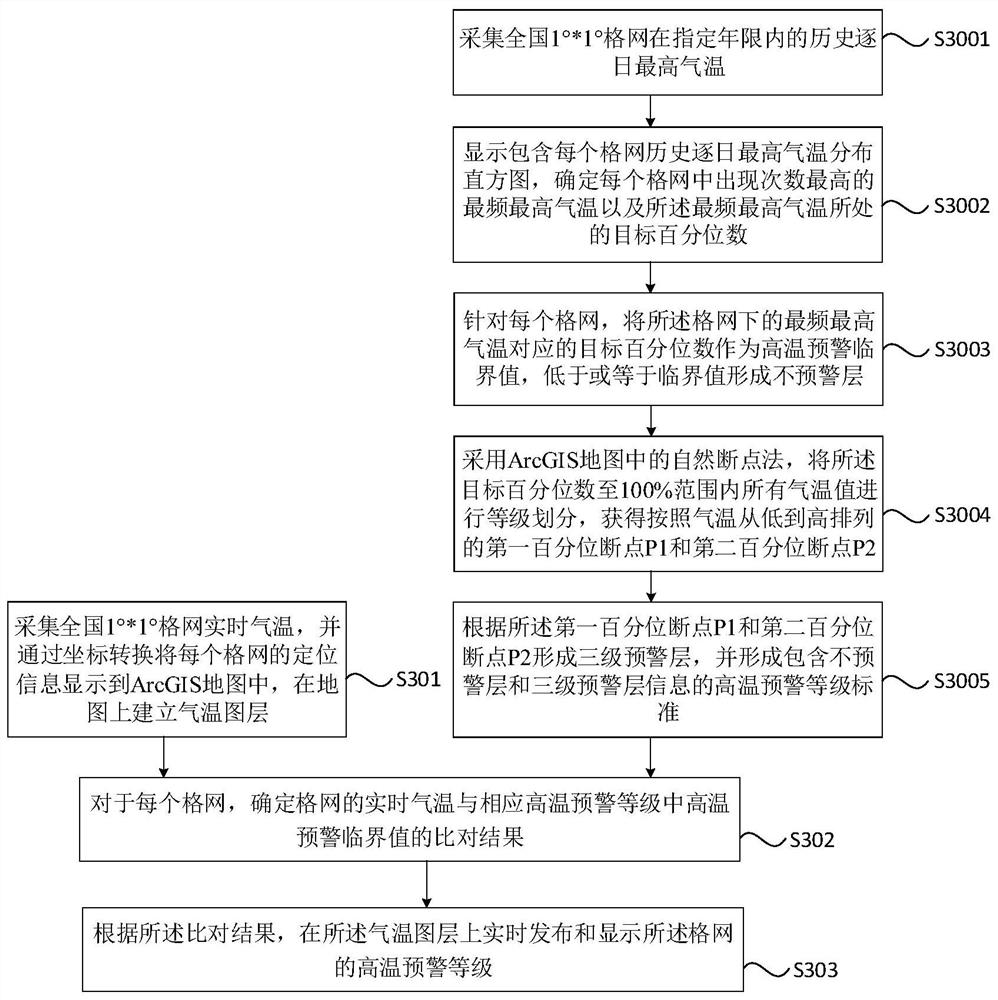
[0078] image 3 It is a flow chart of a grid-based high temperature real-time early warning issuing and displaying method provided by Embodiment 3 of the present invention. The embodiments of the present invention are optimized on the basis of the foregoing embodiments. Optionally, this embodiment explains in detail the process of releasing and displaying the national 1°*1° grid high temperature warning level in real time on the air temperature layer.
[0079] see image 3 , the method of this embodiment includes but not limited to the following steps:
[0080] S301. Collect the real-time temperature of the national 1°*1° grid, and display the positioning information of each grid on the ArcGIS map through coordinate transformation, and establish a temperature layer on the map.
[0081] Optionally, the step of determining the high temperature warning level standard includes:
[0082] S3001. Collect the historical daily maximum temperature of the national 1°*1° grid within a...
PUM
 Abstract
Description
Claims
Application Information
 - R&D
- Intellectual Property
- Life Sciences
- Materials
- Tech Scout
- Unparalleled Data Quality
- Higher Quality Content
- 60% Fewer Hallucinations
Browse by: Latest US Patents, China's latest patents, Technical Efficacy Thesaurus, Application Domain, Technology Topic, Popular Technical Reports.
© 2025 PatSnap. All rights reserved.Legal|Privacy policy|Modern Slavery Act Transparency Statement|Sitemap|About US| Contact US: help@patsnap.com


