SEGY-based visual display method for shallow stratum profile original data

A technology of raw data and display method, applied in seismology, sound wave reradiation, measuring devices, etc. for areas covered by water, which can solve the problems of over-reliance on international commercial software for office processing

Pending Publication Date: 2020-11-24
TIANJIN UNIV
View PDF3 Cites 1 Cited by
  • Summary
  • Abstract
  • Description
  • Claims
  • Application Information

AI Technical Summary

Problems solved by technology

[0005] In view of the above prior art, in order to solve the problem that the office processing of the raw data of the shallow stratum profile relies too much on international commercial software, the present invention proposes a visual display method of the raw data of the shallow stratum profile based on SEGY, which is based on the measured data On the basis of the survey line, set up reasonable observation system parameters (horizontal distance betwe

Method used


Image

  • SEGY-based visual display method for shallow stratum profile original data
  • SEGY-based visual display method for shallow stratum profile original data
  • SEGY-based visual display method for shallow stratum profile original data

Examples


Embodiment Construction

[0033] The present invention will be further described below in conjunction with the accompanying drawings and specific embodiments, but the following embodiments in no way limit the present invention.

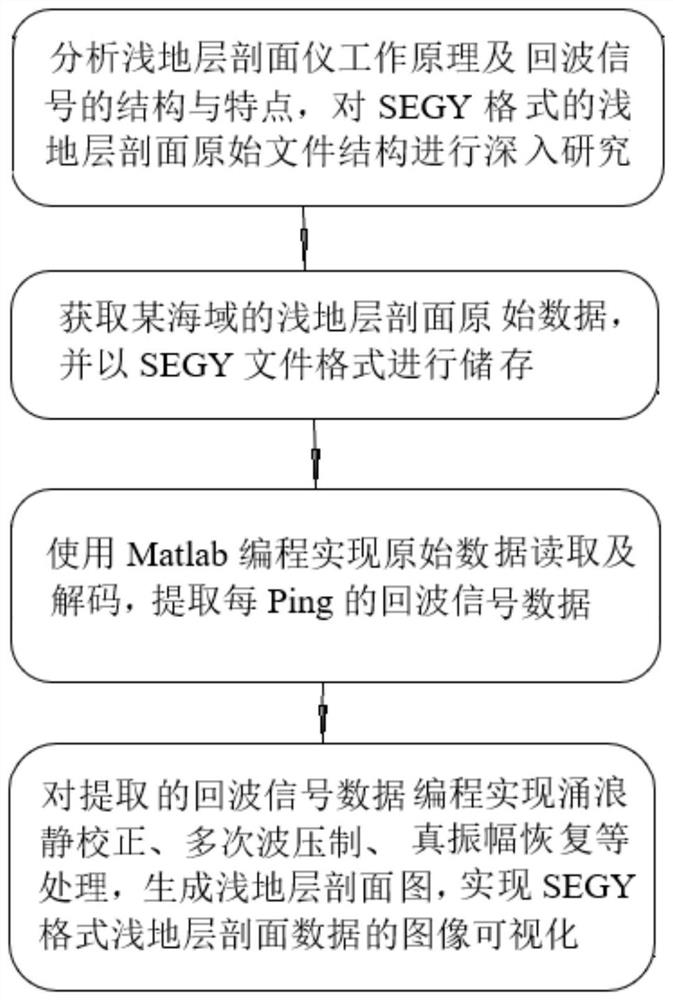
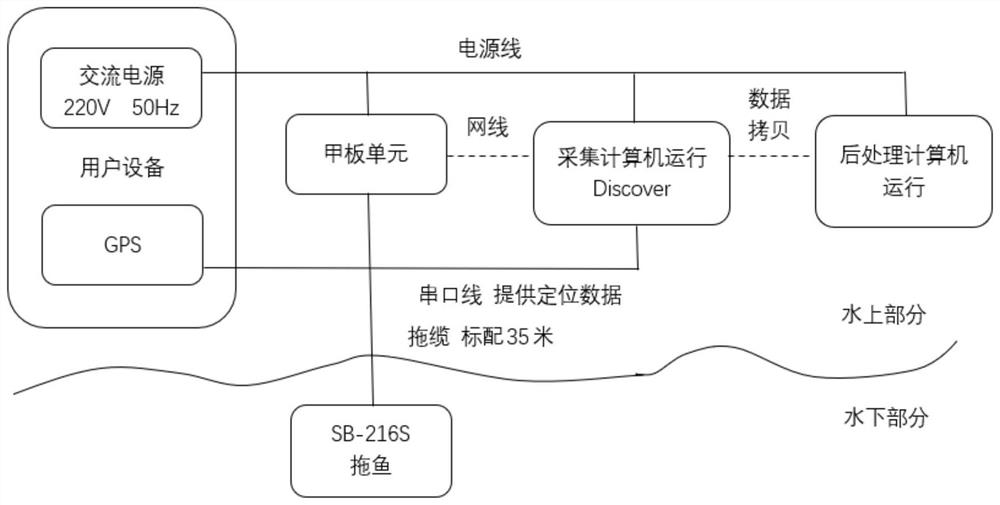
[0034] Such as figure 1 As shown, the present invention proposes a visual display method based on SEGY-based shallow stratum profile raw data, which is characterized in that the equipment involved includes a shallow stratum profiler, GPS and a computer, and data Acquisition software, Matlab programming software is installed in the described computer, and the step of this method is as follows:

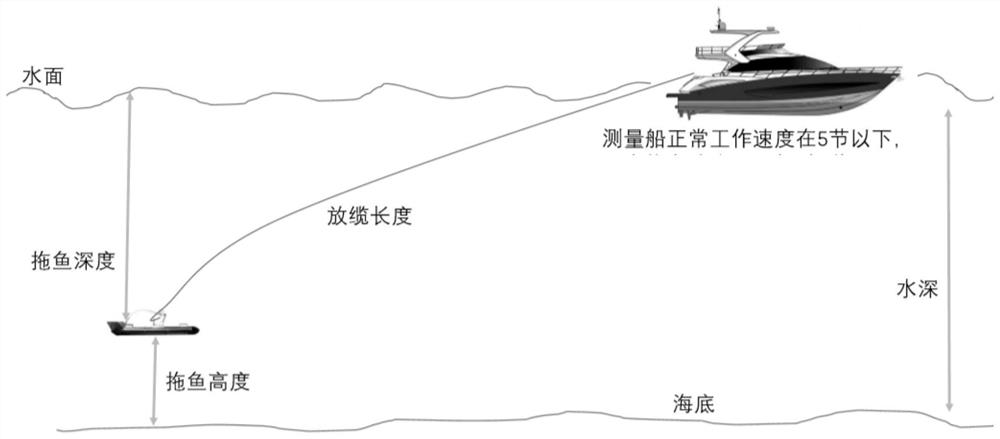
[0035] Step 1. Referring to the "Marine Survey Specifications", combined with the on-site water depth and terrain survey, and meeting the requirements of survey line layout and observation system parameters, use the shallow stratum profiler and its data acquisition software to obtain the original data of the shallow stratum profile in a certain sea area, and Store in SEGY file format, ...


PUM


Abstract

The invention discloses a visual display method for shallow stratum profile original data based on SEGY, and the method comprises the steps: firstly, referring to ocean survey specifications, combining with the on-site water depth topographic survey conditions, collecting and obtaining the shallow stratum profile original data under the condition that the requirements of survey line arrangement and observation system parameters are met, and storing the shallow stratum profile original data in an SEGY file format; importing a shallow stratum profile original data file of the SEGY of a certain measuring line, realizing data reading and decoding by using Matlab programming, and extracting all echo signal data of the measuring line by taking Ping as an abscissa and time depth as an ordinate; programming the extracted echo signal data to perform surge static correction, multiple wave suppression and true amplitude recovery processing, and generating a shallow stratum profile map to realizeimage visualization of the shallow stratum profile data. The method can be applied to analysis of single-channel and multi-channel seismic original data of deep and shallow water type shallow stratumprofiles mainly based on SEGY, and meanwhile necessary reference can be provided for analysis of side-scan sonar original data mainly based on an XTF format.

Description

technical field [0001] The invention relates to a method for ocean surveying and mapping, in particular to a method for visually displaying raw data of shallow stratum sections based on SEGY. Background technique [0002] With the development of marine surveying and mapping and the needs of marine engineering survey, seabed bottom detection is an important content for the types and properties of shallow seabed sediments. The traditional submarine sediment detection method is to use clam-type, box-type, gravity and other samplers to collect sediment samples on site and transport them to the laboratory for analysis and testing. It is the most direct and effective method to obtain the classification and properties of the sediment, but it is expensive It requires a lot of manpower and financial resources, takes a long time, and can only obtain discrete sea bottom particle data. Seabed bottom inversion based on acoustic telemetry refers to the technology of using single-beam, mu...

Claims


Application Information

Patent Timeline
IPC IPC(8): G01V1/38G01S15/89G01S7/56
CPCG01V1/38G01S15/89G01S15/8902G01S7/56
Inventor 李铭珂王虎翟京生张学峰
Owner TIANJIN UNIV
Why Eureka
Try Eureka