Microscopic visual analysis method for high-density group trajectory data

A trajectory data and analysis method technology, applied in the field of micro-visual analysis of high-density group trajectory data, can solve the problems of not being able to analyze the traffic data of multiple intersections at the same time, and not being able to display the potential relationship of trajectories, so as to improve scalability , Strengthen the effect of management

Active Publication Date: 2021-03-09
ZHEJIANG UNIV OF TECH
View PDF3 Cites 3 Cited by
  • Summary
  • Abstract
  • Description
  • Claims
  • Application Information

AI Technical Summary

Problems solved by technology

However, these methods cannot analyze the traffic data of multiple intersections at the same time, and it ca...

Method used


Image

  • Microscopic visual analysis method for high-density group trajectory data
  • Microscopic visual analysis method for high-density group trajectory data
  • Microscopic visual analysis method for high-density group trajectory data

Examples


Embodiment Construction

[0046] specific implementation plan

[0047] Below in conjunction with accompanying drawing, the present invention will be further described;

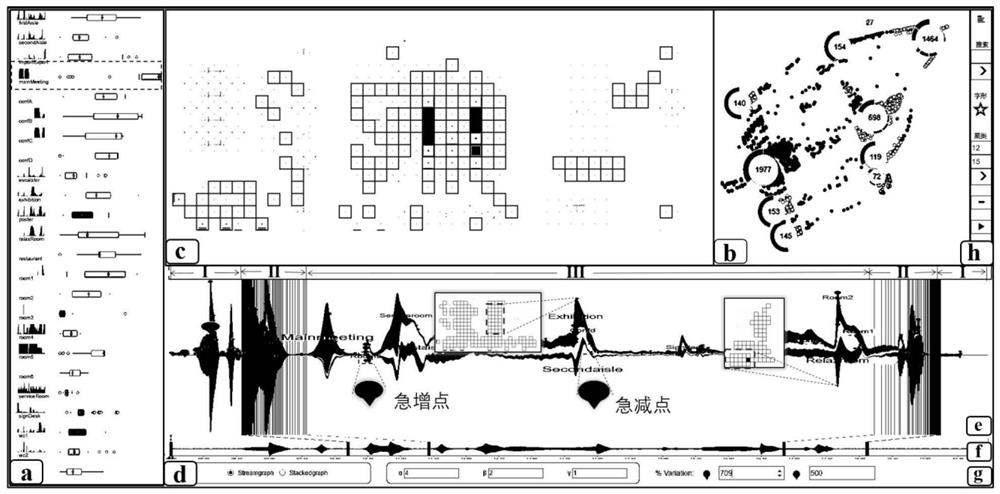
[0048] refer to Figure 1 to Figure 6 , a microscopic visual analysis method of high-density group trajectory data, the present invention uses D3.js to draw the front-end interface, and the background data is obtained through Java;

[0049] The microscopic visual analysis method of the high-density group trajectory data comprises the following steps:

[0050] 1) Data processing; it is of practical significance to consider the characteristics of the trajectory represented by the spatial attribute position sequence. In order to improve the scalability of the trajectory data and improve the running speed, the space is divided into multiple levels and the heat is calculated according to the spatial attribute characteristics, so that the trajectory The data is transformed into a spatial event sequence based on grid heat;

[0051] (1-1) C...


PUM


Abstract

The invention discloses a microscopic visual analysis method for high-density group trajectory data. The method comprises the steps of original trajectory data processing, data statistics and data feature analysis; displaying the feature distribution of the trajectory data in time and space dimensions through a feature statistical view based on the small-multipules, wherein the multi-resolution river view is used for supporting the change of track data displayed from a multi-level aggregation angle; projecting views of the trajectories to reveal correlations between high-density group trajectories; and the multi-level space map being used for displaying the specific distribution condition of the track data. The invention designs a set of interactive visual analysis method, and the method consists of a feature statistics view, a multi-resolution river view, a trajectory projection view and a multi-level space map, so as to help understand the microscopic evolution relation of high-density group trajectory data. And a solution is provided for subsequent microscopic visual analysis of high-density group trajectory data.

Description

technical field [0001] The invention relates to a microcosmic visual analysis method for high-density group trajectory data. Background technique [0002] Human production activities will continue to generate a large amount of spatiotemporal trajectory data, and fully mining the hidden patterns in spatiotemporal trajectory data can help understand the laws of human production and life. Research in many disciplines has involved spatio-temporal trajectory data, for example, economists have studied regional economic changes based on migration flow data, and disease scientists have studied the spread of diseases between regions and countries based on population flow data. [0003] The visualization of trajectory data has always been an important challenge in the field of visualization. It not only needs to show the situation in space and time from a macro perspective, but also needs to show multi-dimensional information at a certain moment from a micro perspective. Analyzing mi...

Claims


Application Information

Patent Timeline
IPC IPC(8): G06F16/29G06F16/9537G06F16/248G06F16/28
CPCG06F16/29G06F16/248G06F16/9537G06F16/287
Inventor 孙国道朱素佳沈悦江棨夏旺李峰施超孙阳梁荣华
Owner ZHEJIANG UNIV OF TECH
Why Eureka
Try Eureka