Chart processing method and device, equipment and medium

A processing method and chart technology, which can be applied in the fields of electrical digital data processing, natural language data processing, and data processing input/output process, etc. The effect of improving usability

Pending Publication Date: 2021-03-26
BEIJIG YUPONT ELECTRIC POWER TECH
View PDF0 Cites 3 Cited by
  • Summary
  • Abstract
  • Description
  • Claims
  • Application Information

AI Technical Summary

Problems solved by technology

[0003] The disadvantage of the above solution is that the process of developing built-in plug-ins is time-consuming, and the code coupling is too high to adapt to different developers. Once it is made, it cannot be modified, thereby reducing the applicability of the chart.

Method used


Image

  • Chart processing method and device, equipment and medium
  • Chart processing method and device, equipment and medium
  • Chart processing method and device, equipment and medium

Examples


Embodiment 1

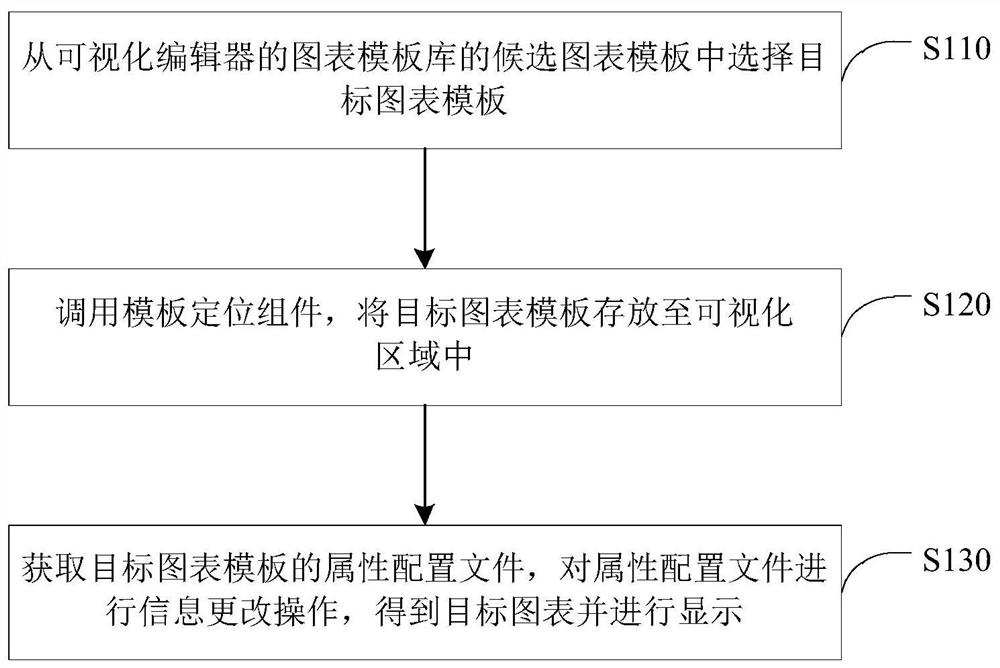
[0052] figure 1 It is a schematic flow chart of the chart processing method in Embodiment 1 of the present invention. This embodiment is applicable to the situation of making and displaying data charts. The method of this embodiment can be executed by a graph processing device, which can be implemented in hardware / or software, and can be configured in electronic equipment, wherein the electronic equipment is preferably a front-end equipment. The chart processing method described in any embodiment of the present application can be implemented. Such as figure 1 As shown, the method specifically includes the following:

[0053] S110. Select a target chart template from candidate chart templates in a chart template library of the visual editor.

[0054] In this embodiment, the visual editor is an editor installed on the front-end device for creating, changing and displaying data charts, and the charts made by the visual editor can be displayed on the webpage, and the displayed...

Embodiment 2

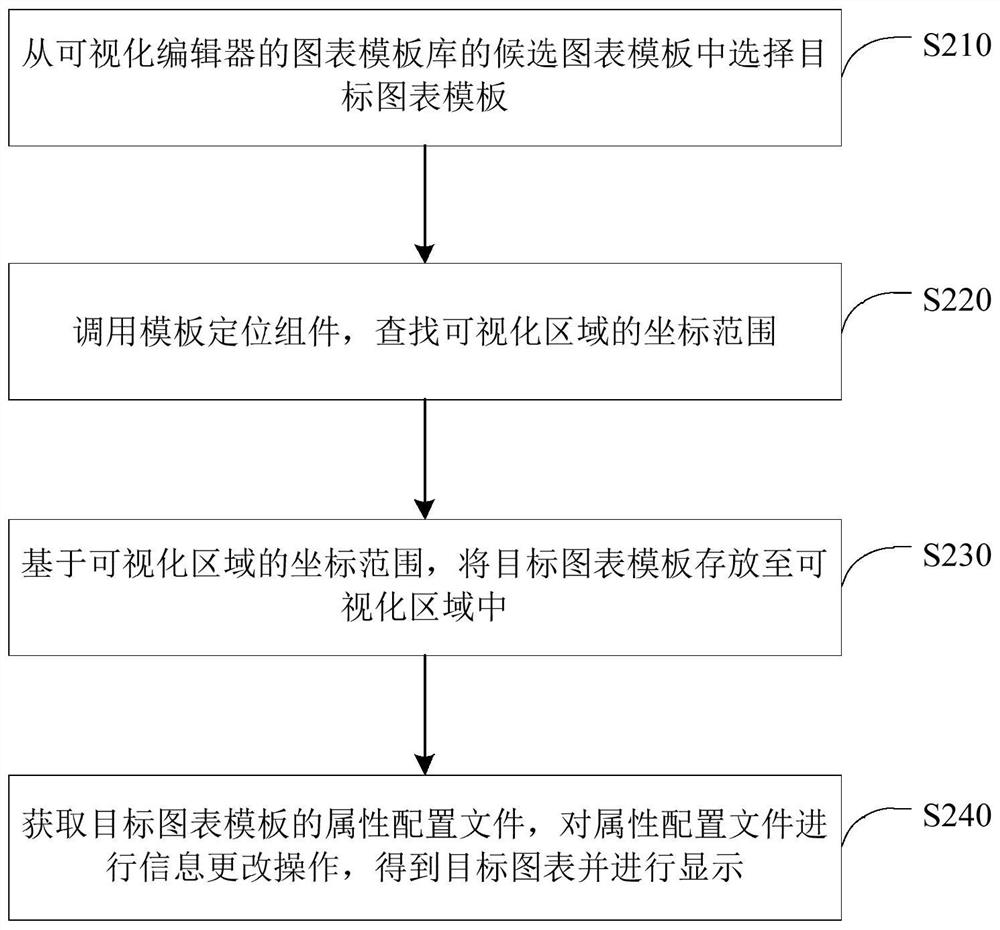
[0065] figure 2 It is a schematic flowchart of the method for processing charts in Embodiment 2 of the present invention. This embodiment is further expanded and optimized on the basis of the above embodiments, and can be combined with any optional solution in the above technical solutions. Such as figure 2 As shown, the method includes:

[0066] S210. Select a target chart template from candidate chart templates in a chart template library of the visual editor.

[0067] S220. Call the template positioning component to find the coordinate range of the visualization area.

[0068] In this embodiment, the coordinate range of the visualization area is the coordinate range of the position of the visualization area in the visual editor; using the template positioning component to find the coordinate range of the visualization area may include: using the template positioning component to locate the visual editor Determine the location of the display area; and determine the coo...

Embodiment 3

[0088] Figure 4 It is a schematic structural diagram of the chart processing device in Embodiment 3 of the present invention. This embodiment is applicable to the situation of making and displaying data charts. The device is configured in an electronic device, and can implement the graph processing method described in any embodiment of the present application. The device specifically includes the following:

[0089] A chart template selection module 410, configured to select a target chart template from the candidate chart templates in the chart template library of the visual editor;

[0090] The chart template storage module 420 is used to call the template positioning component and store the target chart template in the visualization area;

[0091] The target graph determination module 430 is configured to obtain the attribute configuration file of the target graph template, perform information modification operations on the attribute configuration file, obtain and displa...


PUM


Abstract

The invention discloses a chart processing method and device, equipment and a medium. The method comprises the following steps: selecting a target chart template from candidate chart templates of a chart template library of a visual editor; calling a template positioning assembly, and storing the target chart template in a visual area; and obtaining an attribute configuration file of the target chart template, and performing information change operation on the attribute configuration file to obtain a target chart and display the target chart. According to the embodiment of the invention, the construction of the target chart can be realized through different template types in the visual editor, so that the applicability of the chart is improved.

Description

technical field [0001] Embodiments of the present invention relate to the field of a large-screen visual editor, and in particular to a chart processing method, device, device and medium. Background technique [0002] In the development process of large-screen data visualization, users mainly draw the data to be edited into tables or charts for viewing, so as to realize centralized statistical analysis of multiple data; currently, the commonly used chart drawing methods are mainly based on data design diagrams using programming The software designs various chart display frames, and develops built-in plug-ins to realize the access of the frames to make data charts. [0003] The disadvantages of the above solution are: the process of developing built-in plug-ins is time-consuming, and the code coupling is too high to adapt to different developers. Once completed, it cannot be modified, thereby reducing the applicability of the chart. Contents of the invention [0004] The e...

Claims


Application Information

Patent Timeline
Patent Type & Authority Applications(China)
IPC IPC(8): G06F40/186G06F40/166G06F3/0488G06F3/0484
CPCG06F3/0484G06F3/0488G06F40/166G06F40/186
Inventor 郎倩倩范亮星
Owner BEIJIG YUPONT ELECTRIC POWER TECH
Why Eureka
Try Eureka