Method for measuring gravity center change of farmland production capacity based on grid scale

A technology of changing production capacity and center of gravity, applied in measuring instruments, measuring devices, surveying and mapping, and navigation, etc., can solve the problems of uncultivated land or grain production center of gravity calculation, errors, large errors, etc., to improve calculation efficiency and accuracy, The effect of changing the result in line with the reduction of labor costs

Active Publication Date: 2021-12-31
INST OF GEOGRAPHICAL SCI & NATURAL RESOURCE RES CAS
View PDF5 Cites 0 Cited by
  • Summary
  • Abstract
  • Description
  • Claims
  • Application Information

AI Technical Summary

Problems solved by technology

[0005] In the actual calculation process, it is often time-consuming and labor-intensive to calculate the center of gravity of cultivated land or grain production due to too many vector polygons, and the calculation personnel must have specialized experience and knowledge to ensure the accuracy of the final calculation results
[0006] In addition, when studying the center of gravity of cultivated land or grain production, the smallest statistical unit of statistical data currently used is often the county. On the one hand, it is impossible to calculate the center of gravity of cultivated land or grain production for areas below the county level; The results are usually based on the assumption that the arable land or grain production capacity in each county is consistent, which leads to a certain error between the calculated results and the actual situation. Moreover, the larger the county area, the greater the error of the calculation results. Big

Method used


Image

  • Method for measuring gravity center change of farmland production capacity based on grid scale
  • Method for measuring gravity center change of farmland production capacity based on grid scale
  • Method for measuring gravity center change of farmland production capacity based on grid scale

Examples


Embodiment Construction

[0032] In order to better understand the above-mentioned purpose, features and advantages of the present application, the present application will be further described in detail below in conjunction with the accompanying drawings and specific embodiments. It should be noted that, in the case of no conflict, the embodiments of the present application and the features in the embodiments can be combined with each other.

[0033] In the following description, a lot of specific details are set forth in order to fully understand the application, however, the application can also be implemented in other ways different from those described here, therefore, the protection scope of the application is not limited by the following disclosure Limitations of specific embodiments.

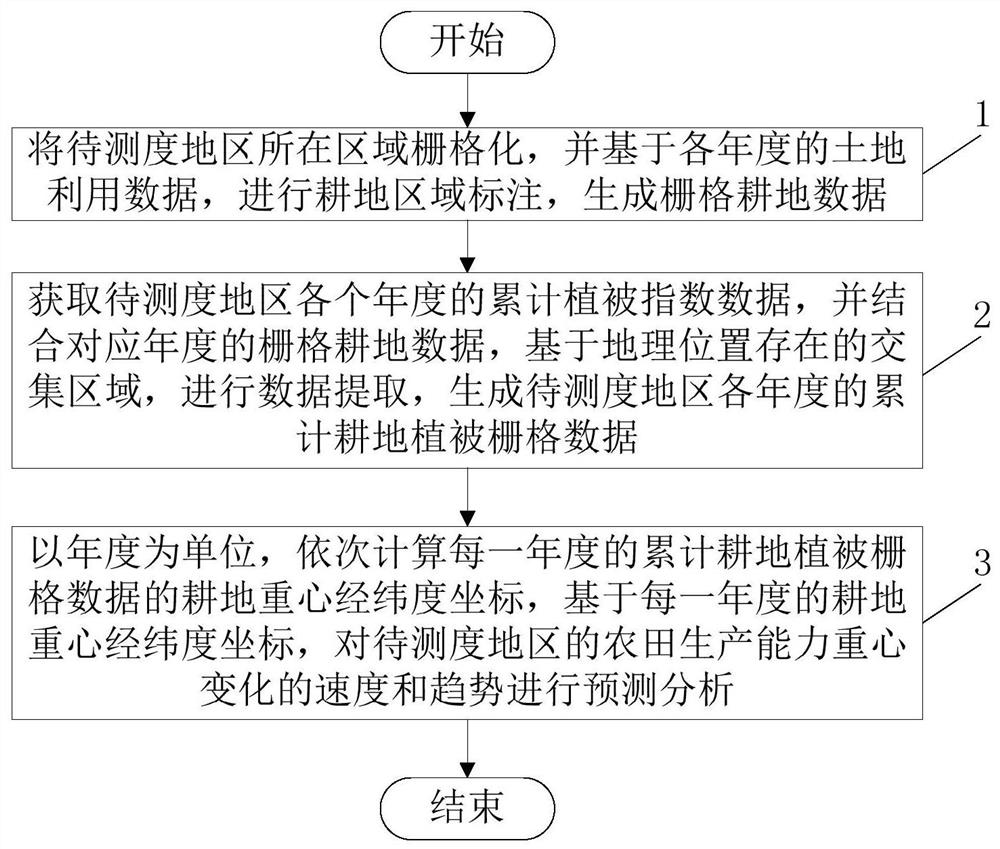
[0034] Such as figure 1 As shown, this embodiment provides a method for measuring the center of gravity change of farmland production capacity based on the grid scale, which includes:

[0035] Step 1. Rasterize...


PUM


Abstract

The invention discloses a method for measuring gravity center change of farmland production capacity based on a grid scale, and the method comprises the steps: step 1, carrying out the rasterization of a region where a to-be-measured region is located, carrying out the marking of a farmland region based on the land utilization data of each year, and generating grid farmland data; step 2, acquiring accumulated vegetation index data of the to-be-measured region in each year, and performing data extraction based on an intersection area existing in a geographic position in combination with the grid cultivated land data of the corresponding year to generate accumulated cultivated land vegetation grid data of the to-be-measured region in each year; and step 3, by taking the year as a unit, calculating the farmland gravity center latitude and longitude coordinates of the accumulated farmland vegetation raster data of each year in sequence, and based on the farmland gravity center latitude and longitude coordinates of each year, carrying out prediction analysis on the farmland production capacity gravity center change speed and trend of the to-be-measured region. According to the technical scheme, the calculation result of the latitude and longitude coordinates of the gravity center of cultivated land or grain production is optimized, so that the calculation result is more consistent with a real result.

Description

technical field [0001] This application relates to the technical fields of agricultural geography, land resource management, and prediction of cultivated land change, and specifically relates to a method for measuring the center of gravity change of cultivated land production capacity based on a grid scale. Background technique [0002] Cultivated land resources are the most basic material conditions for agricultural production, and changes in their quality and quantity will directly affect the grain supply pattern and security level. With the continuous acceleration of urbanization, in some areas, especially the economically developed eastern areas, the trend of cultivated land non-agriculturalization is obvious and it is difficult to reverse in the short term. The increase or decrease of cultivated land in different regions directly affects the spatial distribution pattern of cultivated land in my country, which in turn affects the pattern of grain planting and production....

Claims


Application Information

Patent Timeline
Patent Type & Authority Applications(China)
IPC IPC(8): G06F30/20G06Q50/02G01C15/00G06F119/02
CPCG06F30/20G06Q50/02G01C15/00G06F2119/02Y02A90/10
Inventor 刘正佳刘彦随钟会民王介勇
Owner INST OF GEOGRAPHICAL SCI & NATURAL RESOURCE RES CAS
Why Eureka
Try Eureka