[0074] In order to better understand the present invention, we will further elaborate the present invention below in conjunction with specific examples.
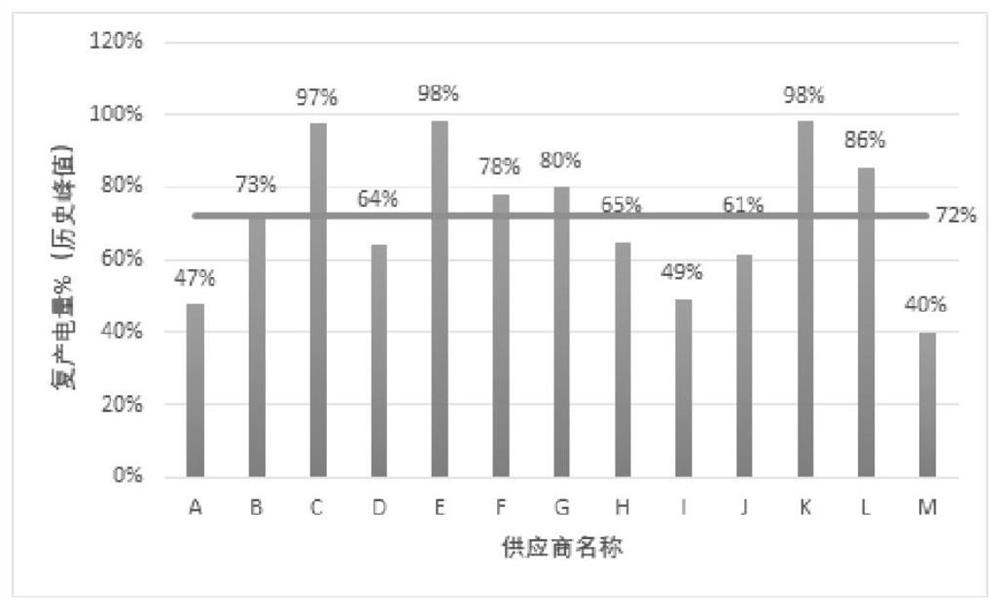
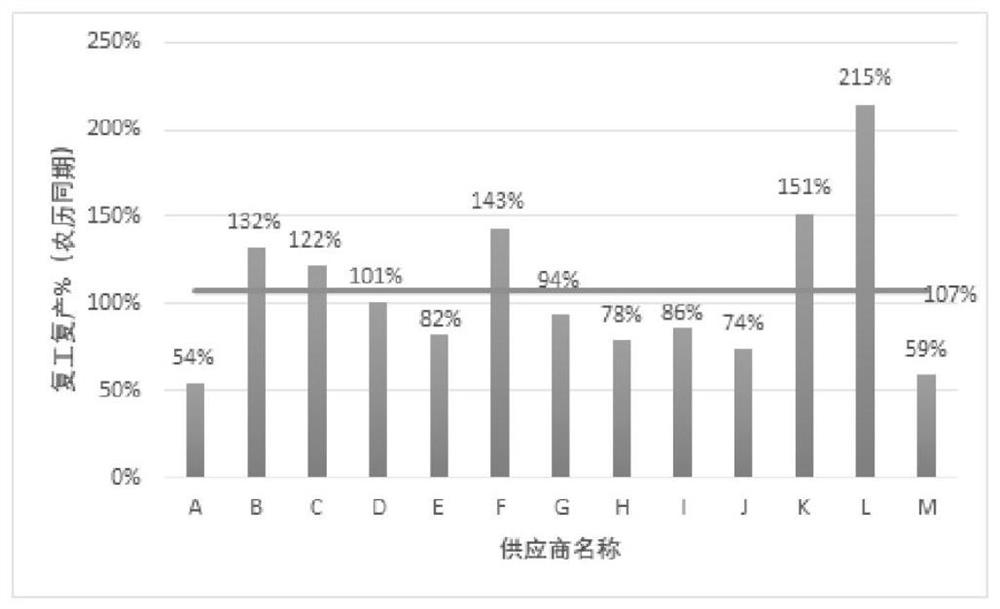
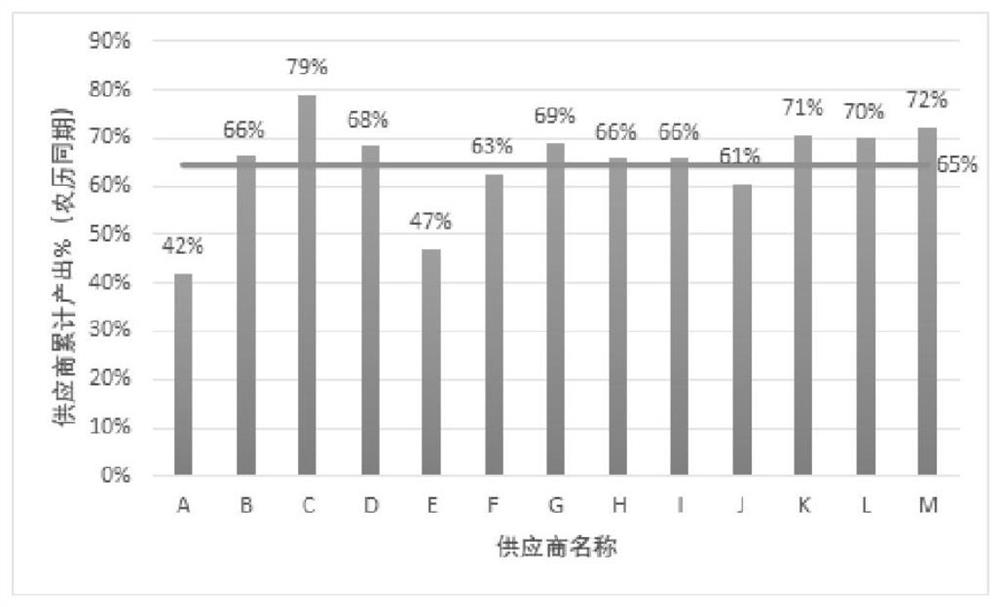
[0075] Take 13 suppliers of a material in Jiangsu Province as an example. It is in suspension from February 3, 2020 to February 9, 2020. Production will gradually resume from February 10, 2020. In order to predict the recovery of production capacity after the resumption of production, the power company analyzed its electricity consumption data of the previous year (Lunar calendar year).
[0076] Preferably, in this embodiment, a clustering algorithm is used to calculate the basic electricity consumption, including the following steps:
[0077] J1: Select the historical daily electricity consumption data of the supplier to be analyzed as the total sample size, randomly select k samples of the daily electricity consumption data as the initial clustering center point, and divide each sample into the nearest cluster according to certain selection criteria cluster center;
[0078] J2: Calculate the average value of each cluster;
[0079] J3: According to the average value of each cluster, that is, the central sample, calculate the distance between each sample and these central samples;
[0080] J4: According to the distance between each sample in the data set and the k center points, it is divided into the class with the smallest distance;
[0081] J5: Recalculate the average value of each cluster that has changed;
[0082] J6: Repeat steps J2 to J5 until each cluster no longer changes;
[0083] J7: After determining the final clustering result, select the minimum value of the cluster center point from the k clusters as the supplier's basic power consumption.
[0084] After the above calculation, the basic power consumption of each supplier is obtained respectively.
[0085] In order to predict the recovery of production capacity of each supplier and provide a reference for order signing, with the gradual recovery of production capacity of each supplier, March 15, 2020 is randomly selected as the inspection day, and the recovery of each supplier is calculated according to the following method Production capacity (historical peak value) data, resumption of production capacity (the same period in the lunar calendar) data, and supplier cumulative output data:
[0086] Resumption of production electricity % (historical peak value) = (current day electricity consumption - basic electricity consumption) / (historical single-day peak electricity consumption - basic electricity consumption);
[0087] Electricity resumption% (the same period in the lunar calendar) = (electricity consumption on the current day - basic electricity consumption) / (electricity consumption in the same period in the lunar calendar of the previous year - basic electricity consumption);
[0088] Cumulative output % of the supplier (the same period of the lunar calendar) = (total electricity consumption from the tenth day of the lunar calendar to the evaluation day of the current year - the accumulated basic electricity consumption) / (total electricity consumption in the same period from the tenth day of the lunar calendar to the evaluation day of the previous year - the accumulated basic electricity consumption ) to calculate the cumulative output % (the same period in the lunar calendar) data of each supplier.
[0089] The result is as Figure 1 to Figure 3 shown in .
[0090] Average the resumption of production capacity (historical peak value), resumption of production capacity (the same period in the lunar calendar) and the cumulative output of suppliers (the same period in the lunar calendar) of different suppliers to get the overall average value shown in the figure, and then it will be higher than the average Suppliers with a value of 10000000000000000000000000000000000000000000000000000000000000000000 products considered their corresponding index parameters as high, suppliers which were below the average value considered their corresponding 1000 parameters as low.
[0091] like Figure 1 to Figure 3 shown in the figure 1 Among them, suppliers C, E, F, G, K, and L are all higher than the average value; in figure 2 Among them, suppliers B, C, F, K, and L are all higher than the average value; in image 3 Among them, suppliers B, C, D, G, H, I, K, L, and M are all higher than the average value;
[0092] Then perform cross-comparison and output the judgment result in the following way:
[0093] (1) When the supplier's cumulative output % (the same period in the lunar calendar) is high, the resumption of production electricity % (in the same period of the lunar calendar) is also high, and the resumption of production electricity % (historical peak value) is high, the supplier's cumulative production capacity is considered to meet the demand, It may be rushed to the end, there is ample production capacity, and orders can be placed first;
[0094] (2) When the supplier's cumulative output % (in the same period of the lunar calendar) is high, the % of resumption of production electricity (in the same period of the lunar calendar) is also high, and the % of resumption of production electricity (historical peak value) is low, the supplier's cumulative production capacity is considered to meet the demand, There may be sufficient production capacity, and the order can be placed first. According to the further confirmation of the order being executed, if the order volume this year is the same as last year, the production capacity is relatively rich; if there are relatively more orders this year, there may be delivery risks;
[0095] (3) When the supplier’s cumulative output % (in the same period of the lunar calendar) is high, the % of resumed production electricity (in the same period of the lunar calendar) is low, and the % of resumed production electricity (historical peak value) is high, it is considered that the supplier’s data is wrong, and further verify;
[0096] (4) When the supplier's cumulative output % (in the same period of the lunar calendar) is high, the resumption of production electricity % (in the same period of the lunar calendar) is low, and the resumption of production electricity % (historical peak value) is low, it is considered that the supplier's cumulative production capacity meets the demand, not If you need to rush to work, you can place an order first;
[0097] (5) When the supplier's cumulative output % (in the same period of the lunar calendar) is low, the % of resumption of production electricity (in the same period of the lunar calendar) is high, and the % of resumption of production electricity (historical peak value) is high, it is considered that the supplier's cumulative production capacity does not meet the demand, In the process of rushing to work at full capacity, there is no sufficient production capacity, so we need to pay attention to the delivery date of the current order, and it is not recommended to place an order;
[0098](6) When the supplier's cumulative output % (in the same period of the lunar calendar) is low, the % of resumption of production electricity (in the same period of the lunar calendar) is high, and the % of resumption of production electricity (historical peak value) is low, it is considered that the supplier's cumulative production capacity does not meet the demand, It is not recommended to place an order if the work is not at full capacity. It is necessary to pay attention to the delivery situation and further verify it according to the orders being executed. If this year’s orders are relatively small compared with last year, there is no need to rush to work; if this year’s orders are relatively large, there may be some difficulties in restoring production capacity;
[0099] (7) When the supplier's cumulative output % (in the same period of the lunar calendar) is low, the resumption of production electricity % (in the same period of the lunar calendar) is low, and the resumption of production electricity % (historical peak value) is high, it is considered that the supplier's data is wrong, and further verify;
[0100] (8) When the supplier's cumulative output % (in the same period of the lunar calendar) is low, the % of resumption of production electricity (in the same period of the lunar calendar) is low, and the % of resumption of production electricity (historical peak) is low, it is considered that the cumulative production capacity of the supplier does not meet the demand for recovery. The production level is low, it is not recommended to place an order, and it is necessary to focus on whether there is a delivery risk;
[0101] After comprehensive consideration, choose supplier C to sign the order;
[0102] Then construct the capacity rise and fall speed index to monitor supplier C's order digestion capacity. The production capacity fluctuation rate index is judged based on the production capacity recovery growth rate in the past three days, and is specifically calculated according to the following formula:
[0103] Growth rate of production capacity recovery in the past three days = (power consumption of the current day - power consumption of the previous day) / power consumption of the previous day;
[0104] Track the electricity consumption data of supplier C who signed the order for the material, and judge the possibility of delivering the ordered goods on schedule according to its production capacity rise and fall speed index,
[0105] Vn=(Pn-Pn-1)/Pn-1, (n is a natural number ≥ 2), where Pn represents the electricity consumption on the nth day; Vn represents the growth rate of production capacity recovery in the past three days based on the nth day;
[0106] Calculate the supplier's daily production volume M according to Vn,
[0107] Assume that the production volume of the second day M2=M1(1+V2)=M1(1+(P2-P1)/P1);
[0108] Production volume on the third day M3=M1(1+V2)(1+V3)=M1(1+(P2-P1)/P1)(1+(P3-P2)/P2);
[0109] By analogy, the daily output of any day is obtained as,
[0110] Mn=M1(1+V2)(1+V3)...(1+Vn)=M1(1+(P2-P1)/P1)(1+(P3-P2)/P2)...(1+( Pn-Pn-1)/Pn-1);
[0111] Forecast the number of days still needed for production D 生产 =(M 总 -M1-M2-M3-...Mn)/Mn, where M 总 is the total amount of the order, and then D 生产 Compared with the order delivery date Dd,
[0112] (1) If D 生产 ≤Dd-Dn, the supplier's current production speed can meet the project demand date;
[0113] (2) If D 生产Dd-Dn, n≤1/2 of the order delivery date, it is considered that the supplier is in the early stage of resuming production, and the production capacity fluctuation rate index is in the rising period, and no warning is given at this time;
[0114] (3) If D 生产Dd-Dn, n>1/2 of the delivery date of the order, then the current production speed of the supplier cannot meet the date of the project demand, and the early warning will remind the relevant departments of the power company to make relevant resource allocation;
[0115] In this embodiment, supplier C’s daily electricity consumption data and the production volume calculated based on electricity consumption are shown in Table 1.
[0116] Table 1: Supplier C’s power consumption and production status when the order was signed on March 15 and production began on March 16 until half of the order delivery date
[0117]
[0118] The total amount of order materials purchased by the power company from it is 470 units.
[0119] The scheduled order delivery period is one month, and the deadline is April 14.
[0120] According to the electricity consumption, a total of 237.6 units were produced when the order delivery date was half (March 30). On March 31, forecast the supplier's capacity. Predict that it needs D to complete the order 生产 =(470-237.6)/13.9=16.7 days. That is, around April 16, the order can be completed, and the order delivery date has exceeded, and an early warning is issued.
[0121] Continue to monitor the actual electricity consumption of supplier C before April 14, and calculate its production volume. As shown in Table 2, 182.5 units will be produced within the remaining order delivery period.
[0122] Table 2: Supplier C's actual electricity consumption statistics and forecasted production
[0123]
[0124] According to the supplier's on-time delivery analysis results, adjust the procurement strategy. If the supplier's current production speed can meet the project demand date, continue to track the electricity consumption data until the end of the order period;
[0125] If the supplier is in the early stage of resuming production and the production capacity fluctuation speed index is in the rising period, continue to track the electricity consumption data, and continuously adjust the D 生产 Compare with the order delivery date Dd until the judgment result is (1), enter the normal tracking until the end of the order period; if the judgment result turns to (3), proceed according to the situation of (3);
[0126] If the current production speed of the supplier cannot meet the date of the project demand, the early warning will prompt the relevant departments of the electric power company to make relevant resource allocation and need to adjust the procurement strategy;
[0127] In this embodiment, since supplier C cannot meet the project demand date, it is necessary to adjust the procurement strategy, coordinate production and supply with other suppliers, and continue to track its electricity consumption data until the end of the order period.
[0128] In the end, the delivery status of supplier C was to complete the production task of 420 units on April 14, and the total order quantity was not completed within the order delivery period, which was consistent with the prediction. Therefore, the method disclosed in the present invention can realize accurate prediction of supplier's supply situation, is of great significance for adjustment of purchasing strategy, and can effectively avoid project delay caused by unscheduled delivery.
[0129] The foregoing are specific embodiments of the present invention. It should be pointed out that for those skilled in the art, some improvements and modifications can be made without departing from the principle of the present invention, and these improvements and modifications are also regarded as the protection scope of the present invention.