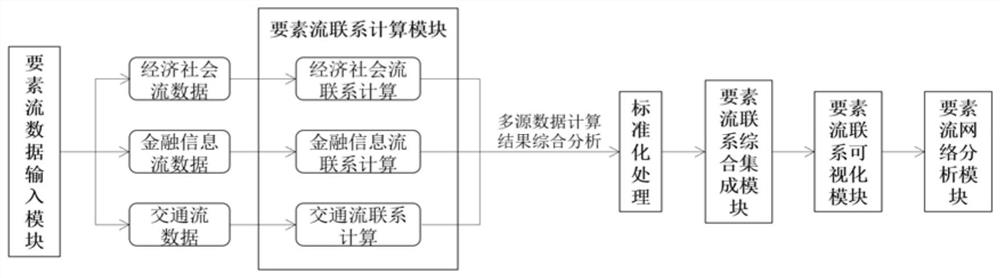
[0056] The present invention proposes a method of universal and multi-source data, using multi-model comprehensive analysis, and urban elements such as flow, cargo stream, information flow, financial flow, economic stream into social economy streams, finance Information flow, three categories of traffic flow, the three types of elements streams are designed, and the three types of elements stream can be realized, and the urban elements stream integrated analysis, the election stream contact visualization, the function stream network analysis, etc., and formed Simple and easy to use smart city stream analysis software platform.
[0057] Specifically, the present invention divides various types of elements in plan into three categories: people flow, cargo stream, and capital flow belong to traffic flow, economic and social development elements are social economy streams, corporate flow, and financial flow belong to financial information. Information flow and ecological stream belong to traffic flow (Baidu search, air or wind flow), also belong to financial information (social contact, land resource index replacement). According to the principle of common margin, the elements stream data introduction module of the present invention includes three input ports:
[0058] (1) Social economy stream data port
[0059] Data type: GDP size, population size, land size, infrastructure scale, investment scale, etc
[0060] Data format: Statistics value.
[0061] (2) Financial information flow data port
[0062] Data type: Enterprise registered capital equity, social network relationship, Taobao orders, freight orders, bank headquarters and branch relationship, logistics headquarters and network relationship, Baidu search, telephone incoming exhalation, Ctrip orders, etc .;
[0063] Data format: Relationship matrix.
[0064] (3) Traffic stream data port
[0065] Data Type: Mobile Signaling, Smart Swipe, Video Image, Wireless WiFi, GPS, Network Sign in, Sensor Monitoring, etc .; Timetable, Network Text or Image;
[0066] Data format: location or trajectory data; grid location data; relational matrix.
[0067] According to the three types of stream data classification and data structure, the elements of the present invention provide three types of stream analysis algorithms, respectively.
[0068] (1) Social economic flow calculation module
[0069] Step 1: Calculate inter-city elements
[0070]
[0071] Where: r ij Indicates two cities elements; A i , A j Indicator 1 (for example, a population); B i , B j Indicator 2 (for example, GDP); N i , N i Indicates the indicator n; D; D; D; D ij Indicates the traffic distance between the city I, J (calculated according to the shortest driving time provided by Baidu map).
[0072] Step 2: Connect to all elements of each city and calculate the intensity of each city to external elements:
[0073]
[0074] Where: r i Indicates that the city i is connected to the external elements; ik For the elements of the city i and other cities, n is the number of urban.
[0075] Step 3: The social and economic stream contact between the two or two cities is as follows:
[0076] i / j R ij
[0077] Step 4: Standardize the elements between the two or two cities:
[0078]
[0079] In r ij 'Connect to the city i's elements, R ij Connect to city I, J room, R i Contact strength for city i on external elements.
[0080] (2) Financial information flow calculation module
[0081] Method 1 (suitable for elements that do not include hierarchical relationships, such as information flow, equity capital flow, product consumption flow):
[0082] Step 1: Calculate the elements between the city:
[0083] S ij = ji = ij '× r ji '
[0084] In the form of ij For city i and city J elementary relationship index, R ij 'Connect to the city J of the city J, R ji 'Connecting to city i's elements of urban i for standardized urban J;
[0085] Step 2: Requirements for all elements of each city, computing the city's node large value S in the elements relationship network system i Reflee the level of the city in the network system of the elements:
[0086]
[0087] In the form of i The node of the city i, S ix The elements of the city i and other cities, n are the number of urban;
[0088] Step 3: Get the financial information flow between two or two cities contact relationship matrices:
[0089] i / j S ij
[0090] Method 2 (suitable for elements that contain hierarchical relationships, such as financial flow, logistics distribution):
[0091] Step 1: Get the distribution of enterprise branches in studying regional cities, and statistics the number of distributions of various agencies;
[0092] Step 2: According to the management relationship between enterprises, the different levels of organizations are assigned, respectively, the service value of enterprise A in the city I use V ia Represents the service value matrix between urban and enterprises;
[0093]
[0094] Step 3: Calculate the contact value between each company in the middle of the two cities.
[0095] S ij,a = V ia * V ja
[0096] Step 4: Calculate the financial information factors between the two cities in J, network connection degree ij The value of the company and branches between companies and branches in the two cities, formulas:
[0097]
[0098] Step 5: Calculate the financial information feature network connection between the city i with all other cities i
[0099]
[0100] In the form of i The sum of the sum of the financial information factors of the city i and all other cities, s ix Financial information feature network connection between city i and other cities.
[0101] Step 6: Get the financial information flow between the two cities Contact relationship matrices:
[0102] i / j S ij
[0103] Calculation example:
[0104] (1) Original data: distribution of various cities in all financial institutions in the network
[0105]
[0106]
[0107] (2) The institution type and grade in statistics, and the expert scoring method will give the corresponding weight according to the actual situation:
[0108] Institutional type Weights ATM 0.1 Bank; 4 Bank Branches 3 Bank Branch 2 Finance; 4 Finance; branch 3 Finance; credit cooperatives 1
[0109] (3) Calculate the value of services in each financial institution in each city. Taking A institution in i city as an example:
[0110] V IA= 145 * 0.1 + 1 * 4 + 4 * 3 + 21 * 2 = 72.5
[0111] (4) Get the service value matrix between urban and financial institutions:
[0112]
[0113] (5) Calculate the contact value between each institution in the two municipalities in the two cities, take an institution in I, J two cities as an example:
[0114] S IJ,A = 72.5 * 53.2 = 3857
[0115] (6) Calculate the access value of enterprises and branches in the two cities, which is the financial information factor network connection between the two cities and the city, with i, j two cities as an example:
[0116] S IJ = S IJ,A + S IJ,B + S IJ,C + S IJ, + S IJ,E = 3857 + 114 + 2516.15 + 54 + 325 = 6866.15
[0117] (7) Get the contact relationship matrix of financial information between two or two cities in the network:
[0118]
[0119]
[0120] (3) Traffic flow computing module
[0121] Step 1: Based on the long-distance bus timetable and the rail run schedule and flight number of flights, calculate the traffic output of passenger transportation in a single city. Calculation formula:
[0122] T ij = A ij + B ij + C ij
[0123]
[0124] Where: T ij Passenger traffic for i cities to J city; A ij , B ij , C ij I have the total amount of people in I cities to j city automobile, railway, and aircraft passenger transport; T i The total amount of people in the Passenger transportation of i-city. in:
[0125] (1) Calculation of motor flow:
[0126]
[0127] The long-distance bus is divided into large-scale, medium-sized, small three categories according to the number of seats (ie, the number of passengers). Where: K n The number of people can accommodate for the nth model passenger; A n The number of passenger cars for the nine model passenger car.
[0128] (2) Railway passenger flow calculation:
[0129] B ij = 118 × (B 1 + B 2 + B 3 + B 4 + 80 × (B ' 1 + B ' 2 + B ' 3 + B ' 4 )
[0130] Taking a regular train compartment full of 118, the high-speed train full of 80 people as an example. Divide the train passenger flow into the following cases, B 1 : Departure City is the originating station, the target city is the terminal, the flow of people in the train is (8-2n) the car, and the lower limit is 2.5 feet, where N is the number of intermediate sites, and all of the traffic will be The number of car boxes is added, and the total number of passes in this case B 1; B 2 : Departure city is the originating station, the target city is not the terminal, each train transport is 2 cars, and the total number of single-day compartments in this case B 2; B 3 : Departure city is not the originating station, the target city is the terminal, and the flow of the train is 1 car, and the total number of single-day compartments in this case B 3 B4: Departure city is not the originating station, the target city is not the terminal, and the flow of the train is 1 car, and the total number of single-day compartments in this case B 4.
[0131] (3) The aircraft passenger flow calculation:
[0132] C ij = 180 × (p + kq)
[0133] The number of passengers carrying aircraft in China is about 180, according to the flight class, according to the direct and transfer of two types of flight statistics aircraft passenger traffic. Where: P is flying from i-city to J-j city, the number of flights at the J city; Q is the number of transit flights from i cities to J City; k is the transfer flight coefficient.
[0134] Step 2: A number of population flow between the two or two cities and the total traffic out of the city;
[0135] Step 3: Get the relationship between the traffic flow between two or two cities:
[0136] i / S ji
[0137] Further, the present invention provides a comprehensive calculation of three types of elements streams for the integrated integrated intensity calculation module:
[0138] Step 1: Connect the three types of energy streams between the two or two cities:
[0139]
[0140]
[0141] In r ij ', S ij ', T ij 'Is the social economy, financial information flow, traffic stream, RC, RC, respectively, the city J ij S ij , T ij Social economy, financial information flow, traffic stream, R i S i , T i In order to provide the total strength of the city I to foreign social economy, financial information flow, and intensity of the elements of various urban elements);
[0142] Step 2: Set the standardized I, J two city, social economic flow, financial information flow, traffic flow, respectively ij ', S ij ', T ij ', Use expert scoring method, calculate the weights A, B, C of three types of elements.
[0143] Step 3: Through the two or two city elements, contact the standardized value and the expert points of each element stream, calculate the integrated contact number of two or two cities in the city. ij :
[0144] P ij = Ar ij '+ BS ij '+ CT ij '
[0145] Step 4: Get the integrated relationship matrix of the elements between two or two cities:
[0146] City i j k … n i P ji
[0147] Further, in the present invention, the elements stream contact visualization module can be visually visualized to the urban elements stream:
[0148] Step 1: Use the natural fracture point (or k-means) clustering method to contact the relationship matrix (which can be a social economic stream, financial information flow, any of the elements of any of the transportation flow, or the integration of the integration of elements The value in the contact matrix) is divided into several intervals to distinguish between different levels of different levels;
[0149] Step 2: Use the ArcGIS social network analysis method (or other methods) to perform the functional stream to contact visualization.
[0150] Further, in the present invention, the elementary analysis and dielectric analysis of the functional center analysis and the centrality analysis of the centrality analysis and the centrality of each city are obtained for each city:
[0151] (1) Center analysis:
[0152] The center of normalization of city i is defined as:
[0153]
[0154]
[0155] Medium, DC i To normalize the center, k i The sum of the intensity of the energy between I cities and other N-1 cities, n is the total number of urban in the network. Calculate the centrality value of the normalization degree of each city, comparison analysis. The larger the center of normalization of a city, the more important the city is more important in the network.
[0156] (2) Medical centrality analysis:
[0157] The center of the urban I is defined as:
[0158]
[0159] Where g jk For the shortest path number from the city J to the city K, G from the city J to the city K jk The minimum path of the urban i in the shortest path. Calculate the centrality value of each city, the greater the value, the more important the city is in the network.
[0160] The above is merely the preferred embodiment of the present invention, and it should be noted that: It should be considered as the scope of the present invention.