Radar communication integrated 5G signal design method
A signal design and radar technology, which is applied in the field of 5G communication, can solve the problems of short duration of a single OFDM symbol, difficulty in obtaining the optimum at the same time, and inability to obtain the detection distance, etc., so as to achieve the effect of high optimization efficiency
- Summary
- Abstract
- Description
- Claims
- Application Information
AI Technical Summary
Problems solved by technology
Method used
Image


Examples
Embodiment 1
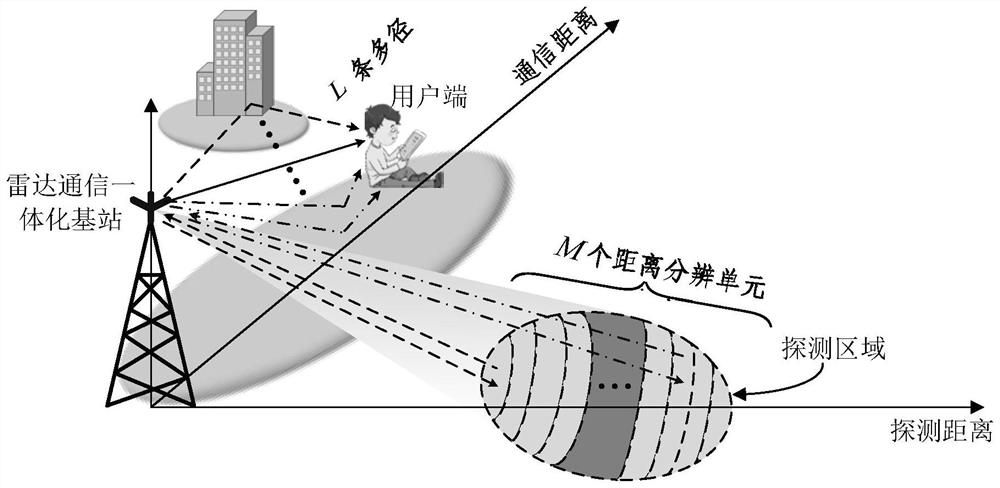
[0034] This embodiment takes figure 1 The typical integrated radar communication system shown is an example, and the content of the present invention is described, and the implementation process of the present invention includes the following steps:
[0035] Step 1: Establish a radar communication integration scene map and initialize system parameters
[0036] like figure 1 , a typical radar communication integrated system Ω includes a radar communication integrated 5G base station A and a user terminal B. The radar communication integrated 5G base station is used to transmit the integrated signal and receive the detection echo signal, and the user terminal B is used to receive the communication signal. Signal. The center frequency of the system is f c = 3.4GHz, the detection area Φ irradiated by the main lobe of the radar communication integrated 5G base station A antenna is divided into M=300 distance resolution units along the distance direction, and there are L=411 comm...
Embodiment 2
[0086] The scheme of the present invention is further verified according to a Matlab simulation example below. The corresponding values of relevant parameters are shown in Table 1.
[0087] Table 1
[0088] parameter symbol value frequency domain subcarrier spacing △f 60kHz signal bandwidth B r
[0089] image 3 and Figure 4 It is a comparison chart of CDF curves of peak-to-average power ratio and signal-to-noise ratio restoration factor under different modulation intervals in the method of the present invention. It is easy to see that under the method proposed by the present invention, the larger the modulation interval is, the smaller the peak-to-average power ratio of the signal is, and the larger the signal-to-noise ratio recovery factor is. Figure 5 and Figure 6 It is a comparison chart of CDF curves of peak-to-average power ratio and signal-to-noise ratio recovery factor under different modulation intervals in the method of the prese...
PUM
 Abstract
Description
Claims
Application Information
PatSnap Eureka turns technology decisions into work you can execute. Powered by our Innovation Knowledge Graph, it runs expert workflows across engineering, life sciences, materials and intellectual property. Get your review-ready output in minutes.


