Visualization platform and method based on electric power big data

A big data and platform technology, applied in the fields of energy and information science, can solve the problems of limited data processing ability, large power data volume, slow processing speed, etc., to improve query performance, storage expansion ability, data type and so on. Complex, diverse, and time-sensitive effects

Pending Publication Date: 2022-04-29
INST OF ECONOMIC & TECH STATE GRID HEBEI ELECTRIC POWER +2
View PDF0 Cites 2 Cited by
  • Summary
  • Abstract
  • Description
  • Claims
  • Application Information

AI Technical Summary

Problems solved by technology

[0003] However, these electric power big data have the characteristics of large data volume, various data types, low value density, and fast processing. However, the centralized traditional mode used by the power grid has limited data processing capabilities, and it is difficult to mine valuable information from massive data. To reflect the operation of the grid
And in the face of the massive growth of electric power big data, the traditional mode of using a single server as support has the problems of slow processing speed and low system efficiency

Method used


Image

  • Visualization platform and method based on electric power big data
  • Visualization platform and method based on electric power big data
  • Visualization platform and method based on electric power big data

Examples


Embodiment 1

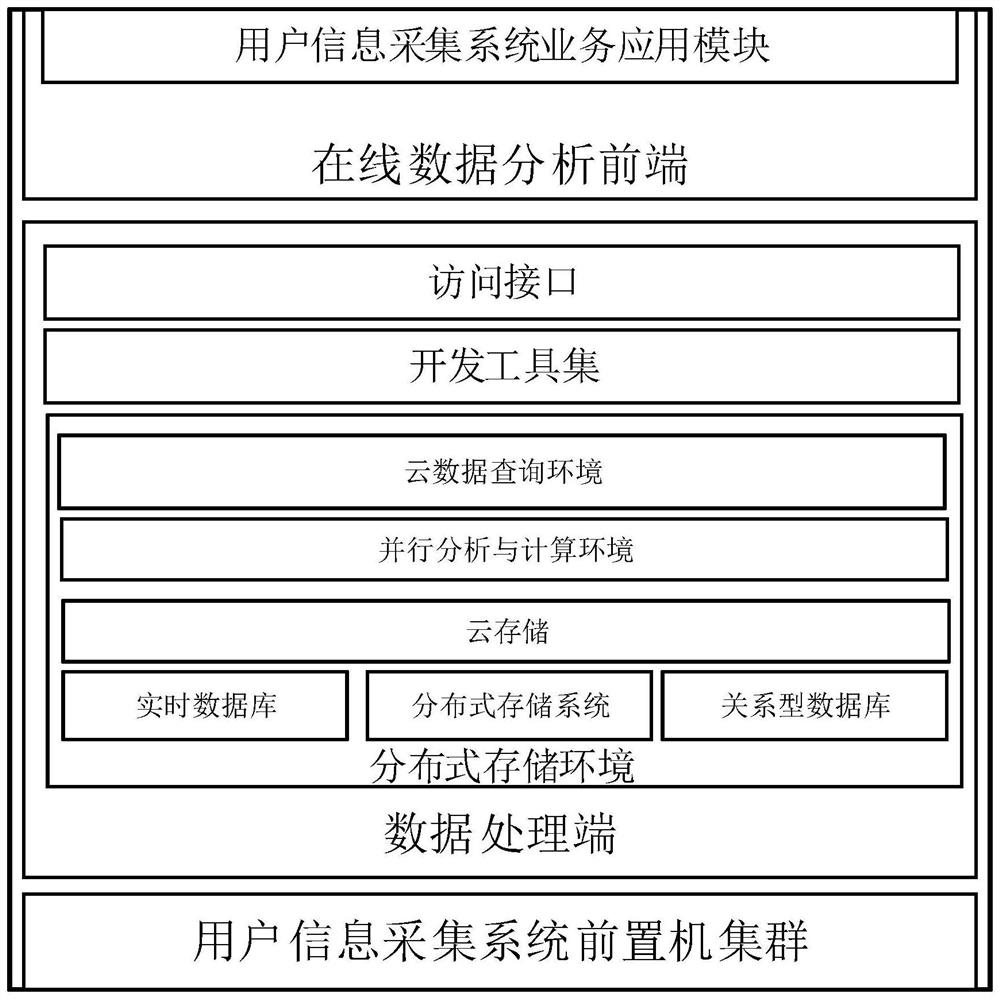
[0084] The visualization platform based on electric power big data provided by the present invention has an overall architecture diagram as follows: figure 1 shown, including: data processing end and online data analysis front end;

[0085] The data processing terminal is used for data integration, storage management and complex data calculation and analysis of the operating data of the power system to obtain power big data and perform data transmission;

[0086] The online data analysis front end is used to analyze the electric power big data based on a pre-established electric power system model, organize it into a data structure required for visualization, and display it through visualization technology.

[0087] The development of smart grid has led to the explosive growth of data scale. The data set has the characteristics of huge volume, diverse sources, and complex data structure. However, the centralized traditional processing mode used by the current grid has been dif...

Embodiment 2

[0154] In order to prove the effectiveness of the visualization platform based on power big data designed by the present invention, the experimental environment used in this embodiment is a PC with 4 cores and 8 threads intel Core i7 7700k, 16GB memory, and 1TB mechanical hard disk. An experimental Kubernates cluster is deployed using minikube provided by Kubernetes, and all operations are carried out with access to foreign networks.

[0155] As part of the microservice system of the power big data system, each component of the big data system needs to be deployed under Kubernetes in the form of Docker containers, and the services themselves are packaged in the form of Docker images. For software supported by the community, you can find ready-made packaged images, while for self-developed software, you need to configure the compilation, installation and configuration of the software to form your own deployment image.

[0156] The component relationship of application dep...

Embodiment 3

[0176] Based on the same inventive concept, the present invention also provides a visualization method based on electric power big data, the schematic flowchart of which is as follows Figure 20 shown, including:

[0177] Data integration, storage management, and complex data calculation and analysis are performed on the operating data of the power system through the data processing terminal, so as to obtain power big data and perform data transmission;

[0178] Through the online data analysis front-end, the power big data is analyzed based on a pre-established power system model, organized into a data structure required for visualization, and displayed through visualization technology.

[0179] The data processing terminal performs data integration, storage management and complex data calculation and analysis on the operating data of the power system to obtain power big data and perform data transmission, including:

[0180] Use cloud storage to safely and comple...


PUM


Abstract

The invention provides a visualization platform and method based on electric power big data. The visualization platform comprises a data processing end and an online data analysis front end, the data processing end is used for performing data integration, storage management and complex data calculation and analysis on the operation data of the power system to obtain power big data and perform data transmission; and the online data analysis front end is used for analyzing the electric power big data based on a pre-established electric power system model, organizing the electric power big data into a data structure required by visualization, and displaying the data structure through a visualization technology. By utilizing the method, large-scale electric power big data can be processed, the processing timeliness is high, the data types which can be processed are complex and diversified, the defects of non-structuralization of the traditional technical means and the insufficient processing capability of other data formats such as space vector data are overcome, the problem that the traditional technical means cannot meet the requirement of electric power big data processing is solved, and the method is suitable for large-scale electric power big data processing. And main business applications such as electric power big data online analysis, multi-dimensional query and large-scale analysis and calculation are realized.

Description

technical field [0001] The invention belongs to the field of energy and information science, in particular to a visualization platform and method based on electric power big data. Background technique [0002] With the wide application of information technology and power automation technology in the power grid and the intelligent development trend of the power grid, people have installed a large number of data collection and Monitoring equipment, thus generating massive power data including operation monitoring information, maintenance information, power consumption data, consumption data, and enterprise management data. The amount of data collected by relevant monitoring systems in the power grid field is huge and continues to increase every year, including structured, semi-structured and unstructured data. While the scale of power data is growing exponentially, the hidden value is also increasing. Power big data mainly includes power grid operation and equipment monitorin...

Claims


Application Information

Patent Timeline
IPC IPC(8): G06F16/26G06F16/2458G06F16/29G06Q50/06
CPCG06F16/26G06F16/2462G06F16/29G06Q50/06Y04S10/50
Inventor 魏孟举杨洋胡梦锦潘明明刘钊赵贤龙
Owner INST OF ECONOMIC & TECH STATE GRID HEBEI ELECTRIC POWER
Why Eureka
Try Eureka