Single cell RNA-SEQ data processing
A data processing and data technology, applied in the direction of electrical digital data processing, digital data processing parts, laboratory analysis data, etc., can solve the problems of limited analysis results, affecting gene-gene correlation inference, etc.
- Summary
- Abstract
- Description
- Claims
- Application Information
AI Technical Summary
Problems solved by technology
Method used
Image
Examples
example 1
[0087] Example 1. Data preprocessing using representative normalization / imputation methods
[0088] Several representative normalization / imputation methods were benchmarked, focusing on their impact on inference of gene-gene associations. The global scaling normalization method performs minimal data manipulation by normalizing the gene expression of each cell by the total expression. Because log transformation and z-score scaling do not change the ordination correlations, this approach is usually followed after log transformation and z-score scaling; only total UMI normalization (termed NormUMI) was included in the comparison. Includes a framework for normalizing and stabilizing the variance of scRNA-seq data using "regularized negative binomial regression" (termed NBR), which removes the effects of technical noise while preserving biological heterogeneity. Also included are three other methods representing different classes of imputation methods, e.g., (i) MAGIC - a data smo...
example 2
[0090] Example 2. Computing gene-gene correlations in single cells
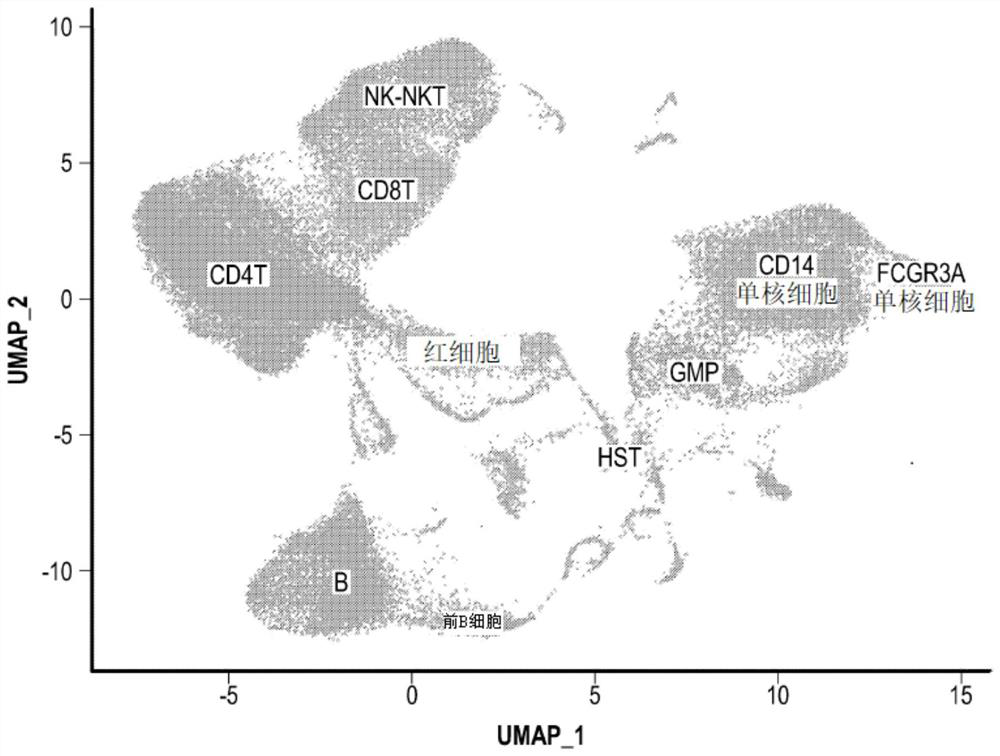
[0091] Real bone marrow scRNA-seq data from the Human Cell Atlas Preview dataset was used as a benchmark dataset for various data preprocessing methods (Regev et al.). like image 3 As shown in Table 1, the complete dataset contains 378,000 myeloid cells that can be divided into 21 cell clusters, covering all major immune cell types. 50,000 cells were randomly sampled from the original dataset. Genes expressed in less than 0.2% (100 cells) were excluded from this subset. The final dataset contained 12,600 genes and yielded more than 79 million possible gene pairs.
[0092]
[0093] Figure 4 An overview of the benchmark framework is shown. Apply five representative data preprocessing methods (e.g., NormUMI, NBR, DCA, MAGIC, and SAVER) to single-cell expression data matrices (e.g., bone marrow, single-cell expression data), as Figure 4 shown. Gene-gene correlations calculated directly from the resul...
example 3
[0095] Example 3. Observing artifacts using data preprocessing methods
[0096] Five representative data preprocessing methods (e.g., NormUMI, NBR, DCA, MAGIC, and SAVER) were applied to bone marrow scRNA-seq data from the Human Cell Atlas project. The distribution of overall gene-gene correlations in five different data matrices processed by different methods was compared. Since most gene pairs do not have any association, the peak of the association distribution is expected to be 0. like Figure 5A As shown, NormUMI produces a correlation distribution with a peak of 0. However, the median correlations for the other four methods are much higher, according to the Spearman correlation coefficient, as Figure 5A As shown, (NormUMIρ=0.023, NBRρ=0.839, MAGICρ=0.789, DCAρ=0.770, SAVERρ=0.166).
[0097] After applying specific data preprocessing methods, the interactions between two genes are captured to reveal whether a higher correlation reflects a higher chance of a functiona...
PUM
 Abstract
Description
Claims
Application Information
 - R&D
- Intellectual Property
- Life Sciences
- Materials
- Tech Scout
- Unparalleled Data Quality
- Higher Quality Content
- 60% Fewer Hallucinations
Browse by: Latest US Patents, China's latest patents, Technical Efficacy Thesaurus, Application Domain, Technology Topic, Popular Technical Reports.
© 2025 PatSnap. All rights reserved.Legal|Privacy policy|Modern Slavery Act Transparency Statement|Sitemap|About US| Contact US: help@patsnap.com


