Reservoir classification method and device, electronic equipment and computer readable storage medium
A classification method and reservoir technology, applied in the computer field, can solve the problems of low classification accuracy and low work efficiency, and achieve the effect of improving accuracy and work efficiency.
Pending Publication Date: 2022-05-27
北京月新时代科技股份有限公司
0 Cites 0 Cited by
AI-Extracted Technical Summary
Problems solved by technology
The manual-based reservoir classification method mainly relies on expert experience and will be affected by subjective facto...
Method used
By the reservoir classification method of this program, compared to the method in the prior art that only conventional logging curves or only imaging logging data are analyzed, this program comprehensively considers the target imaging logging image and the target conventional logging The two sets of data of well curve data, through the comprehensive analysis of imaging logging images and conventional well logging data, are beneficial to improve the accuracy of classification.
In well logging operation, due to random effects such as nuclear decay, extranuclear electrons and gamma quantum, or reasons such as random collision of well logging probe, multiple refraction and reflection of sound waves, initial well logging curve will contain a large amount of interference information . If we directly use these signals that have nothing to do with geological characteristics for logging analysis, it may have a greater impact on the analysis results. Therefore, we use the method of curve smoothing filtering to smooth and filter each initial logging curve, retain the useful signals related to geological special effects to the greatest extent, and effectively suppress the interference of short-period burr signals.
[0137] S1016: For each first well log data, according to the first maximum first curve value and the minimum first curve value in the first well log data, for each first well log data in the first well log data A curve value is normalized respectively to obtain the second curve value corresponding to each first curve value, and the second well logging curve data and the second well logging curve are determined according to the second curve value corresponding to each depth The target logging curve corr...
Abstract
The invention provides a reservoir classification method and device, electronic equipment and a computer readable storage medium, and the method comprises the steps: obtaining a target imaging logging image and target conventional logging curve data corresponding to a target depth region in a target drilling well; inputting the target imaging logging image into a first convolutional neural network classification model, and outputting a first reservoir classification result of a target reservoir corresponding to the target depth region; inputting the target conventional logging curve data into a second convolutional neural network classification model, and outputting a second reservoir classification result of the target reservoir; inputting a splicing result obtained by splicing the first reservoir classification result and the second reservoir classification result into a target full-connection layer to obtain a target reservoir classification result of the target reservoir; and determining the category of the target reservoir according to the target reservoir classification result. According to the scheme, the reservoir is automatically classified through the convolutional neural network classification model, so that the working efficiency of reservoir classification and the classification accuracy are improved.
Application Domain
Character and pattern recognitionNeural architectures +1
Technology Topic
Classification resultEngineering +9
Image
Examples
- Experimental program(4)
Example Embodiment
[0097] Example 1:
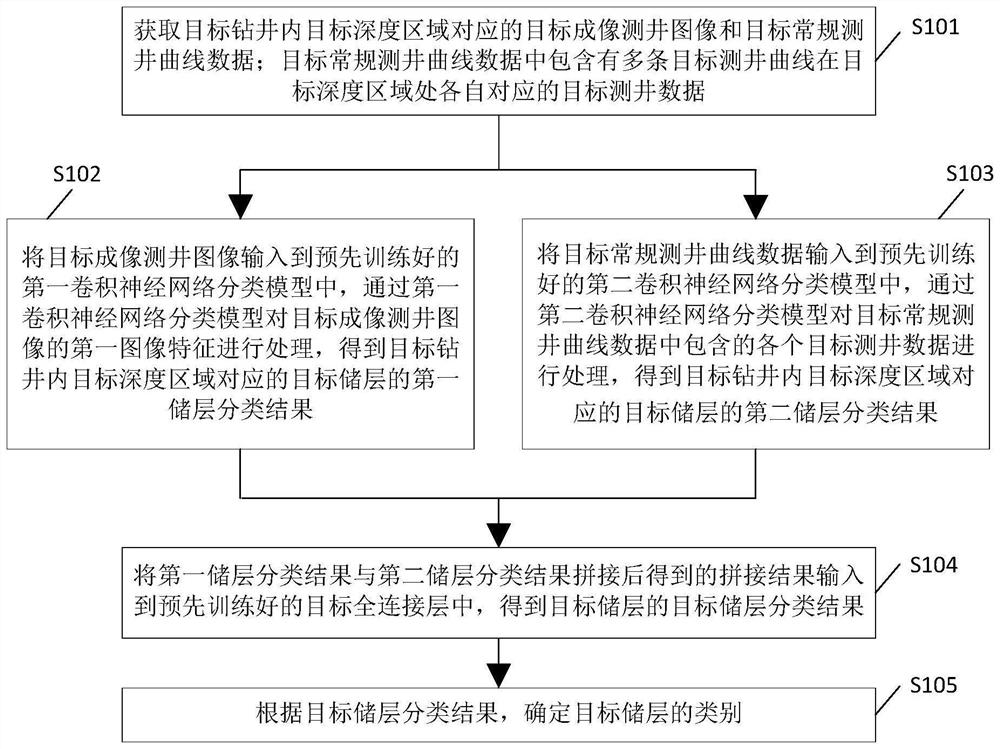
[0098] In order to facilitate the understanding of this embodiment, a method for classification of reservoirs disclosed in the embodiment of this application is first introduced in detail. figure 1 A flow chart of a method for classification of reservoirs provided by the embodiments of the present application is shown, as figure 1 shown, including the following steps:
[0099] S101: Acquire a target imaging logging image and target conventional logging curve data corresponding to a target depth area in a target well; the target conventional logging curve data includes target logs corresponding to multiple target logging curves at the target depth area data.
[0100] Substances such as oil and natural gas are stored in the target well, wherein the oil or natural gas is stored in the target well through the reservoir. The reservoir has interconnected pores that allow oil or natural gas to be stored in the target well through the reservoir.
[0101] The target well can be a newly drilled well. For a newly completed well (that is, a newly drilled well), it is necessary to determine the reservoir division results corresponding to different depths of the whole well, that is, to classify the reservoirs in the target well. Determine whether each reservoir within the target well is a high-quality or non-high-quality reservoir. The purpose of classifying the reservoir is to analyze the potential of oil and gas development in the target well, and to determine the key to further increase the recoverable reserves in the target well.
[0102] The target depth refers to the distance between each position in the well and the ground, and the target depth area refers to the distance between each area in the well and the ground. Exemplarily, the target depth area is between 100 meters and 102 meters, between 102 and 104 meters, and so on.
[0103] The target imaging logging image corresponding to the target depth area includes the borehole logging image corresponding to the target depth area in the target well. The target conventional logging curve data corresponding to the target depth region includes target logging data corresponding to a plurality of target logging curves corresponding to the target depth region in the target wellbore at the target depth region. There are multiple target logging curves, the abscissa of each target logging curve is the distance from the ground, that is, the depth in the well, and the ordinate is the curve value corresponding to each depth. Wherein, the quantity of data contained in the target conventional logging curve data is the same as the quantity of the target logging curve.
[0104] Exemplarily, there are 7 target logging curves, and each target logging curve corresponds to a curve value in the target depth region. Therefore, the target conventional logging curve data corresponding to the target depth region includes 7 curve values. According to the variation trend of the target logging curve with depth, the reservoir properties of different depth regions can be reflected.
[0105] S102: Input the target imaging logging image into the pre-trained first convolutional neural network classification model, and process the first image feature of the target imaging logging image through the first convolutional neural network classification model to obtain the target drilling The first reservoir classification result of the target reservoir corresponding to the inner target depth region.
[0106] The first convolutional neural network classification model may be a two-dimensional convolutional neural network classification model. Each target depth area corresponds to a target reservoir. For example, if the target depth area is between 100 and 102 meters, the target reservoir corresponding to the target depth area is the reservoir between the depths of 100 and 102 meters in the target well. Floor. The first reservoir classification result is the probability of each category of the target reservoir predicted by the first convolutional neural network classification model. Exemplarily, when the reservoir types are classified into non-high-quality reservoirs, first-class high-quality treated reservoirs, and second-class high-quality reservoirs, the first reservoir classification result is that the target reservoirs belong to non-high-quality reservoirs, first-class high-quality treated reservoirs, Probability of Class II high-quality reservoirs.
[0107] S103: Input the target conventional logging curve data into the pre-trained second convolutional neural network classification model, and use the second convolutional neural network classification model to perform each target logging data included in the target conventional logging curve data. processing to obtain a second reservoir classification result of the target reservoir corresponding to the target depth region in the target well.
[0108] The second convolutional neural network classification model may be a one-dimensional convolutional neural network classification model. The second reservoir classification result is the probability of each category of the target reservoir predicted by the second convolutional neural network classification model. For the same target reservoir, the first reservoir classification result and the second reservoir classification result corresponding to the target reservoir may be the same or different.
[0109] S104: Input the splicing result obtained by splicing the first reservoir classification result and the second reservoir classification result into the pre-trained target fully connected layer to obtain the target reservoir classification result of the target reservoir.
[0110] Exemplarily, the first reservoir classification result is [0.2, 0.5, 0.3], the second reservoir classification result is [0.1, 0.8, 0.1], and the splicing result obtained by splicing the two reservoir classification results is [0.2, 0.5, 0.3, 0.1, 0.8, 0.1], input this splicing result into the pre-trained target fully connected layer, and obtain the target reservoir classification result, that is, the target reservoir belongs to non-high-quality reservoirs and a class of high-quality reservoirs , the probability of a second-class high-quality reservoir.
[0111] S105: Determine the category of the target reservoir according to the classification result of the target reservoir.
[0112] The classification result of the target reservoir includes the probability that the target reservoir belongs to the non-high-quality reservoir, the first-class high-quality reservoir, and the second-class high-quality reservoir respectively. final category.
[0113] Exemplarily, if the target reservoir classification result includes a probability of 0.2 for the target reservoir belonging to a first-class high-quality reservoir, a probability of 0.45 for a second-class high-quality reservoir, and a probability of 0.1 for a non-high-quality reservoir, the probability of the second-class high-quality reservoir corresponding to the probability 0.45 is 0.2. The reservoir is determined as the category of the target reservoir, that is, the category of the target reservoir is the second-class high-quality reservoir.
[0114] Through the reservoir classification method of this scheme, compared with the method of analyzing only conventional logging curves or imaging logging data in the prior art, this scheme comprehensively considers target imaging logging images and target conventional logging curve data These two sets of data, through the comprehensive analysis of imaging logging images and conventional logging curve data, are beneficial to improve the classification accuracy.
[0115] In a feasible implementation manner, before performing step S101 to acquire the target imaging logging image corresponding to the target depth region in the target well, the method further includes:
[0116] S1011: Acquire an initial imaging logging image corresponding to the target well; the initial imaging logging image includes imaging logging information corresponding to each depth in the target well.
[0117] The initial imaging logging image is a method of imaging physical parameters of the borehole wall and objects around the borehole based on the observation of the geophysical field in the borehole, which can intuitively and visually reflect the formation characteristics corresponding to different depths in the target borehole.
[0118] The initial imaging logging image includes imaging logging images corresponding to each depth region in the entire target well, which are images captured by logging tools.
[0119] S1012: Segment the initial imaging logging image according to a preset depth interval to obtain a plurality of imaging logging images and a target depth region corresponding to each imaging logging image.
[0120] In a specific embodiment, the head and tail of the initial imaging logging image will have labelling information (ie redundant information), such as the number of the target well, the name of the target well, color labeling, guide north labeling, etc. Annotative information. Therefore, when the initial imaging logging image is segmented, the annotative information on the head and tail of the initial imaging logging image is firstly removed (ie, redundant information on the initial imaging logging image is removed). The initial imaging log image of . Then, according to the preset depth interval, the initial imaging logging image after removing the annotation information is segmented again to obtain multiple imaging logging images.
[0121] The size of the imaging logging image is smaller than the size of the initial imaging logging image, and the preset depth interval can be 1 meter, 1.5 meters, 2 meters, etc., which can be adjusted empirically.
[0122] Exemplarily, when the initial imaging logging image contains logging images with a depth of 100 meters to 500 meters in the target well, if the preset depth interval is 2 meters, there are 200 imaging logging images obtained after segmentation, It includes 1 imaging logging image corresponding to the target depth area of 100 meters to 102 meters, 1 imaging logging image corresponding to the target depth area of 102 meters to 104 meters, and the target depth area of 498 meters to 500 meters. 1 corresponding imaging log image at , and so on. Each imaging log image is the same size.
[0123] S1013: For each imaging logging image, perform grayscale processing on the imaging logging image to obtain a target imaging logging image corresponding to the imaging logging image.
[0124] The initial imaging logging images and imaging logging images are color images in RGB format (RGB represents three color channels of red R, green G, and blue B). Among them, each pixel point in the color image of the RGB color space is jointly determined by the data of the three channels of R, G, and B. Due to the complexity of processing the data of the three channels, in the imaging logging image, the color has no effect on the type of reservoir. The influence of the judgment is too small, so the imaging logging image is grayscaled, that is, the three channels of RGB are unified into the data of one channel. Since our human eyes have different sensitivities to the three colors of RGB, this scheme uses a weighted method to obtain the grayscaled data. The specific formula is as follows:
[0125] gray(x)=0.299×red(x)+0.587×green(x)+0.114×blue(x)
[0126] Among them, for each pixel x in the imaging logging image, red(x) represents the pixel value corresponding to the red R channel of the pixel x, and green(x) represents the pixel value corresponding to the green G channel of the pixel x , blue(x) represents the pixel value corresponding to the blue B channel of the pixel x, and gray(x) represents the gray value of the pixel x.
[0127] In a possible implementation manner, before performing step S101 to obtain the target conventional logging curve data corresponding to the position of the target depth region in the target well, the method further includes:
[0128] S1014: Acquire initial conventional logging curve data corresponding to the target well; the initial conventional logging curve data includes initial logging curve data corresponding to a plurality of initial logging curves; the initial logging curve data includes each The initial curve value corresponding to the depth.
[0129] There are multiple initial logging curves. For example, the initial logging curve can be 7 logging curves such as natural gamma, natural potential, borehole, acoustic wave, neutron, density, and resistivity. Both contain initial curve values corresponding to each depth in the target well, wherein the abscissa of each initial logging curve is the depth in the target well, and the ordinate is the corresponding curve value. The initial logging curve data corresponding to each initial logging curve includes curve values corresponding to each depth on the initial logging curve. The initial conventional logging curve data contains curve values corresponding to each depth of each initial logging curve.
[0130] S1015: For each initial logging curve data, perform smooth filtering processing on the initial logging curve data to obtain first logging curve data; the first logging curve data includes first curves corresponding to each depth in the target well value.
[0131] In logging operations, due to random effects such as nuclear decay, extra-nuclear electrons, and gamma quantum, or random collision of logging probes, multiple refractions and reflections of sound waves, etc., the initial logging curve will contain a lot of interference information. If we directly use these signals unrelated to geological features for logging analysis, it may have a greater impact on the analysis results. Therefore, we use the curve smoothing filtering method to smooth and filter each initial logging curve to retain the useful signals related to geological special effects to the greatest extent, and effectively suppress the interference of short-period burr signals.
[0132] Among them, the method used in the smoothing filtering process is Savitzky-Golay smoothing filtering (a filtering method based on least squares fitting), which eliminates noise while keeping the morphological characteristics of the original curve unchanged.
[0133] In a specific embodiment, when the Savitzky-Golay smoothing filtering method is used for the smoothing filtering process, specifically, the k-th order polynomial fitting is performed on the data points in the window of a certain length by the weighted average algorithm of the moving sliding window, so as to obtain The effect after fitting.
[0134] Exemplarily, for each initial logging curve, if there are curve values corresponding to 20 depths on the initial logging curve, the 20 depths are divided, and each 5 depths are grouped into a group to obtain 4 sets of data, That is, the width of the moving sliding window is 5 at this time. For each group of data (that is, for the data in each moving sliding window), use this group of data to perform k-order polynomial fitting to obtain the parameter a in the following formula i (i=1...k), then input the curve value corresponding to each depth contained in the set of data into the following formula:
[0135] Y=a 0 +a 1 x+a 2 x 2 +…+a k x k
[0136] Wherein, x represents the curve value on the initial logging curve corresponding to a certain depth, and Y represents the first curve value on the first logging curve data corresponding to the depth after smoothing.
[0137] S1016: For each first logging curve data, according to the maximum first curve value and the minimum first curve value in the first logging curve data, each first curve value in the first logging curve data Perform normalization processing respectively to obtain the second curve value corresponding to each first curve value, and determine the second well logging curve data and the corresponding second well logging curve data according to the second curve value corresponding to each depth. Target logging curve; the value range of the second curve value is 0-1. Since different first logging curves have different fluctuation ranges, and their dimension ranges (ie, fluctuation ranges) are different, the first logging curve with a smaller final value will be swallowed up by the first logging curve with a larger value. Each first logging curve data is normalized, and the dimensional expression is changed into a dimensionless expression, which improves the convergence speed and classification accuracy of the model.
[0138] Exemplarily, the ordinate of some first logging curves may fluctuate between 1-5, while the ordinate of another first logging curve may fluctuate between 40-50. In order to avoid different fluctuation ranges The classification results are affected. In this scheme, each first curve value in the first logging curve data of each first logging curve is respectively normalized. Specifically, for each first logging curve, the Each first curve value in the first log curve data of the first log curve is respectively input into the following formula:
[0139]
[0140] Among them, P max Represents the maximum value among all the first curve values contained in the first logging curve data, P min Represents the minimum value among all the first curve values contained in the first logging curve data, P i Represents each first curve value included in the first logging curve data, Q i Indicates the normalized second curve value corresponding to each first curve value included in the first logging curve data. Since the second curve value included in each second logging curve data is between 0-1, the fluctuation range of the ordinate of each second logging curve is between 0-1.
[0141]S1017: For the second logging curve data corresponding to each target logging curve, according to each target depth included in the target depth region, select a second curve corresponding to each target depth from the second logging curve data and average the selected second curve value to obtain the target curve value corresponding to the target depth area, and use the target curve value corresponding to the target depth area as the target logging curve corresponding to the target logging curve at the target depth area. Well data.
[0142] For each target logging curve, the second logging curve data corresponding to the target logging curve includes second curve values corresponding to each depth. For example, the second logging curve data includes: a second curve corresponding to 100 meters The value is 40.22, the second curve value corresponding to 101 meters is 43.932, the second curve value corresponding to 102 meters is 56.33, the second curve value corresponding to 103 meters is 67.9, and so on. If the target depth area is 100-102, the target depths contained in the target depth area are 100 meters, 101 meters, and 102 meters, and the second curve values corresponding to the target depth area 100-102 are 40.22, 43.932, and 56.33, and the target depth is calculated. The average value of the second curve values corresponding to the regions 100-102 is 48.827, that is, the target curve value corresponding to the target depth regions 100-102 is 48.827. Through this method, the target curve value corresponding to each target depth region can be calculated.
[0143] In a possible implementation manner, in step S102, the first image feature of the target imaging logging image is processed by the first convolutional neural network classification model to obtain the first image feature of the target reservoir corresponding to the target depth region in the target well. When the reservoir classification results are obtained, the specific steps can be performed as follows:
[0144] The initial image feature matrix corresponding to the target imaging logging image is used as the input image feature matrix, and the input image feature matrix is subjected to the first convolution processing of the first preset number of times and the first nonlinear transformation is performed after each first convolution processing. , and perform the first pooling process on the result obtained by each first nonlinear transformation.
[0145] The image feature matrix obtained by each first pooling process is used as the input image feature matrix of the next first convolution process.
[0146] The first convolution processing includes: calculating the dot product of each first receptive field data in the first image feature matrix and the first convolution kernel respectively, to obtain the first feature value corresponding to each first receptive field data, and according to Each first feature value constructs a second image feature matrix; the size of the matrix corresponding to the first receptive field data is the same as the size of the matrix corresponding to the first convolution kernel.
[0147] The first nonlinear transformation includes: for each third image feature matrix, inputting each second feature value in the third image feature matrix into a preset activation function to obtain each of the third image feature matrix. the third characteristic value corresponding to the second characteristic value; in the preset activation function, for each second characteristic value, when the second characteristic value is greater than 0, the second characteristic value is determined as the third characteristic value. Three characteristic values; when the second characteristic value is not greater than 0, the second characteristic value is changed to obtain a third characteristic value; the third characteristic value is used to construct a fourth image feature matrix;
[0148] The first pooling process includes: extracting a maximum value from each second receptive field data in the fifth image feature matrix, and constructing a sixth image feature matrix according to the maximum value extracted from each second receptive field data.
[0149] The first full connection process is performed on the output image feature matrix obtained by the last first pooling process to obtain the first reservoir classification result corresponding to the target imaging logging image.
[0150] The first convolutional neural network classification model takes the target imaging logging image itself as input, and does not need to stretch and deform the target imaging logging image, and retains the spatial structure of the target imaging logging image, as well as the shape, texture and other information in the image. .
[0151] The first convolutional neural network classification model mainly includes: the first convolutional layer of the first preset number of times, the first pooling layer of the first preset number of times, the first nonlinear transformation of the first preset number of times, and a first Fully connected layer. The first convolution processing is performed in the first convolution layer, which is specifically used for feature extraction of the input characteristic features; the first pooling processing is performed in the first pooling layer, and the first pooling processing is performed in the first fully connected layer. Full connection processing.
[0152] In a specific embodiment, when there are two first convolutional layers, they are the first convolutional layer J 1 and the first convolutional layer J 2 , there are two first pooling layers, namely the first pooling layer C 1 and the first pooling layer C 2. Among them, the first convolutional layer J 1 The output of the first pooling layer C 1 input, the first pooling layer C 1 The output of the first convolutional layer J 2 The input of the first convolutional layer J 2 The output of the first pooling layer C 2 input, the first pooling layer C 2 The output is used as the input of the first fully connected layer.
[0153] The convolutional layer is the core part of the convolutional neural network model, which is used to extract features from the input features. The chunk mimics how the human visual cortex works, arguing that adjacent pixels in an image are closely related, and pixels that are farther apart have no apparent connection. The convolutional layer preserves the spatial structure of the image, and uses a locally perceptual convolution method instead of the fully connected method. This local area is also called the receptive field, where the size of the receptive field depends on the size of the convolution kernel.
[0154] Firstly, according to the target imaging logging image, the initial image feature matrix of the target imaging logging image is determined. Input the initial image feature matrix of the target imaging log image into the first convolutional layer J 1 middle, figure 2 A schematic diagram showing the initial image feature matrix, the first convolution kernel, and the second image feature matrix provided by the embodiments of the present application, such as figure 2 shown, in the first convolutional layer J 1 , if the initial image feature matrix is a 5×5 matrix (that is, the input image feature is a 5×5 matrix), and the first convolution kernel is a 3×3 matrix, then according to the matrix size of the first convolution kernel, from A plurality of first receptive field data are determined in the initial image feature matrix. Among them, since the first convolution kernel is a 3×3 matrix, the first receptive field data is also a 3×3 matrix.
[0155] like figure 2 As shown, the 3×3 matrix of the shaded part (ie from the first row and the first column to the third row and the third column) is used as the first first receptive field data Z 1 , from the first row and the second column to the third row and the fourth column as the second first receptive field data Z 2 , from the first row and the third column to the third row and the fifth column as the third first receptive field data Z 3 , from the second row and the first column to the fourth row and the third column as the fourth first receptive field data Z 4 , in this order, nine first receptive field data can be obtained. That is, there are repeated parts between the first receptive field data.
[0156] Calculate the first receptive field data Z 1 The dot product with the first convolution kernel, the first characteristic value corresponding to the first receptive field data Z1 is obtained as 9; calculate the first receptive field data Z 2 Dot product with the first convolution kernel to get the first receptive field data Z 2 The corresponding first feature value is 3; calculate the first receptive field data Z 3 Dot product with the first convolution kernel to get the first receptive field data Z 3 The corresponding first characteristic value is 9. According to this sequence, 9 first characteristic values can be obtained.
[0157] Wherein, when calculating the dot product of the first receptive field data and the first convolution kernel, it may specifically be to point the values at the corresponding positions in the matrix corresponding to the first receptive field data and the matrix corresponding to the first convolution kernel. Multiply, and calculate the sum of the dot products. With the first receptive field data Z 1 Taking the dot product with the first convolution kernel as an example, the specific calculation process is as follows:
[0158] 1×1+1×2+0×0+1×2+0×1+1×1+2×1+0×0+1×1=9
[0159] The second image feature matrix is constructed according to the obtained nine first feature values, that is, the position of each first receptive field data on the first feature matrix is determined, and the first feature value corresponding to each first receptive field data is determined in the second position on the image feature matrix.
[0160] In this embodiment, the first convolution kernel of 3×3 size is used to extract the features of the imaging log, and it is considered that the superposition of several consecutive 3×3 small convolution kernels not only has the same receptive field as the large convolution kernel, but also More first nonlinear transformations are also introduced, which can better extract the deep features of the input data.
[0161] The first convolutional layer J 1 The outputted second image feature matrix is used as the third image feature matrix, and the third image feature matrix is subjected to the first nonlinear transformation. Specifically, for each third image feature matrix, each value in the matrix is respectively used as the third image feature matrix. A second feature value in the three-image feature matrix. Input each second feature value in the third image feature matrix into the preset activation function (ie the ELU activation function):
[0162]
[0163] Among them, y represents each second eigenvalue, ELU(y) represents the third eigenvalue obtained after performing the first nonlinear transformation, is a fixed constant, and e is a fixed constant.
[0164] In this embodiment, the activation function of the network adopts the ELU activation function instead of the ReLU activation function, which avoids the problem of neuron necrosis and improves the robustness of the model to noise.
[0165] The fourth image feature matrix output by the first nonlinear transformation is input to the first pooling layer C as the fifth image feature matrix 1 middle. image 3 A schematic diagram showing the fifth image feature matrix and the sixth image feature matrix provided by the embodiment of the present application, such as image 3 shown, in the first pooling layer C 1 , the fifth image feature matrix is divided to obtain at least one second receptive field data, and for each second receptive field data, the maximum value is extracted from the second receptive field data, and each second receptive field data corresponding to The maximum value of , according to the position of each second receptive field data on the fifth image feature matrix, the sixth image feature matrix is constructed using the maximum value corresponding to each second receptive field data. Among them, there is no repeated part between any two second receptive field data.
[0166] Exemplary as image 3 As shown, the 2×2 matrix of the shaded part (ie from the first row and the first column to the second row and the second column) is used as the first second receptive field data Y 1;From the third column of the first row to the fourth column of the second row as the second second receptive field data Y 2;From the first column of the third row to the second column of the fourth row as the third second receptive field data Y 3;From the third row and the third column to the fourth row and the fourth column as the fourth second receptive field data Y 4. According to this sequence, four second receptive field data can be obtained. Among them, the second receptive field data Y 1 The maximum value in is 8, the second receptive field data Y 2 The maximum value in is 9, the second receptive field data Y 3 The maximum value in is 7, the second receptive field data Y 4 The maximum value in is 5.
[0167]In a specific embodiment, if the second receptive field data is a 2×2 matrix, and the fifth image feature matrix is a 3×3 matrix, then the fifth image feature matrix needs to be filled with 0, that is, in the first The fourth column and the fourth row are filled with 0, and the fifth image feature matrix after the 0 is filled is divided to determine a plurality of second receptive field data.
[0168] The first pooling layer C 2 The output image feature matrix of is used as the input of the first fully connected layer. In the first fully connected layer, the first pooling layer C 2 The first full connection processing is performed on the output image feature matrix of the target imaging logging image, and the first reservoir classification result corresponding to the target imaging logging image is obtained.
[0169] In a possible embodiment, in step S103, the second convolutional neural network classification model is used to process each target logging data included in the target conventional logging curve data to obtain the second corresponding to the target depth area in the target well. When the reservoir classification results are obtained, the specific steps can be performed as follows:
[0170] Each target logging data contained in the target conventional logging curve data is used as input logging data, and the input logging data is subjected to a second convolution process for a second preset number of times, and a second convolution process is performed after each second convolution process. Non-linear transformation, performing a second pooling process on the result obtained by each second nonlinear transformation;
[0171] The feature data obtained by each second pooling process is used as the input logging data for the next second convolution process;
[0172] The second convolution processing includes: dividing all the first logging data to obtain at least one third receptive field data; for each third receptive field data, calculating the first logging included in the third receptive field data The dot product of the data and the second convolution kernel, the fourth characteristic value corresponding to the first receptive field data is obtained, and the second logging data is constructed according to the fourth characteristic value; the matrix size corresponding to the third receptive field data is the same as the second The matrix sizes corresponding to the convolution kernels are the same; the second nonlinear transformation includes: for each third logging data, judging whether the third logging data is greater than 0; if the third logging data is greater than 0, then The third logging data is determined as the fourth logging data; if the third logging data is not greater than 0, the product of the third logging data and the preset multiple is determined as the fourth logging data;
[0173] The second pooling process includes: dividing all the fifth logging data to obtain at least one fourth receptive field data; for each fourth receptive field data, extracting the maximum value from the fourth receptive field data, and Construct sixth logging data according to the maximum value extracted from each fourth receptive field data;
[0174] The second full connection process is performed on the output logging data obtained by the last second pooling process to obtain the second reservoir classification result corresponding to the target conventional logging curve data.
[0175] The second convolutional neural network classification model mainly includes: a second convolutional layer for a second preset number of times, a second pooling layer for a second preset number of times, a Leaky ReLU activation function, and a second fully connected layer. The second convolution process is performed in the second convolutional layer, the second pooling process is performed in the second pooling layer, the second nonlinear transformation is performed in the Leaky ReLU activation function, and the second fully connected layer is performed. Two full connection processing.
[0176] In a specific embodiment, if there are three second convolutional layers, they are respectively the second convolutional layer E 1 , the second convolutional layer E 2 , the second convolutional layer E 3; There are three second pooling layers, which are the second pooling layer R 1 , the second pooling layer R 2 , the second pooling layer R 3. Among them, the second convolutional layer E 1 The output of the Leaky ReLU activation function is used as the first input of the Leaky ReLU activation function, and the first output of the Leaky ReLU activation function is used as the second pooling layer R 1 The input of the second pooling layer R 1 The output of the second convolutional layer E 2 The input of the second convolutional layer E 2 The output of the Leaky ReLU activation function is used as the second input of the Leaky ReLU activation function, and the second output of the Leaky ReLU activation function is used as the second pooling layer R 2 The input of the second pooling layer R 2 The output of the second convolutional layer E 3 The input of the second convolutional layer E 3 The output of the Leaky ReLU activation function is used as the third input of the Leaky ReLU activation function, and the third output of the Leaky ReLU activation function is used as the second pooling layer R 3 The input of the second pooling layer R 3 The output is used as the input of the second fully connected layer.
[0177] Input each target logging data contained in the target conventional logging curve data corresponding to the target depth area into the second convolutional layer E 1 , exemplarily, when the target depth area is 106-108 meters, and there are 9 target logging curves, then the target conventional logging curve data corresponding to the target depth area 106-108 meters includes 9 target logging data, 0.144, 0.15, 0.73, 0.66, 0.137, 0.475, 0.48, 0.118, 0.504, respectively.
[0178] In the second convolutional layer E 1 , take the target logging data as the first logging data, and divide all the target logging data to obtain three third receptive field data, which are [0.144, 0.15, 0.73], [0.66, 0.137, 0.475] , [0.48, 0.118, 0.504].
[0179] For each third receptive field data, the dot product of the first logging data included in the third receptive field data and the second convolution kernel is calculated to obtain a fourth characteristic value corresponding to the third receptive field data. Specifically, the third receptive field data U is calculated 1 Dot product of [0.144, 0.15, 0.73] with the second convolution kernel to get a fourth feature value. Calculate the third receptive field data U 2 [0.66, 0.137, 0.475] and the dot product of the second convolution kernel to obtain the second fourth feature value. Calculate the third receptive field data U 3 [0.48, 0.118, 0.504] and the dot product of the second convolution kernel to obtain the third and fourth feature value.
[0180] The second logging data is constructed according to the fourth characteristic values, that is, the above-mentioned three fourth characteristic values are used as the second logging data. That is, the second convolutional layer E 1 The output is the second log data containing the values of the three fourth eigenvalues.
[0181] The second convolutional layer E 1 The outputted second logging data containing three fourth characteristic values is input into the Leaky ReLU (Rectified linear unit, ReLU) activation function as the third logging data. Specifically, the Leaky ReLU activation function is as follows:
[0182]
[0183] Among them, z is the third logging data input into the Leaky ReLU activation function, Leaky ReLU(z) is the fourth logging data output by the LeakyReLU activation function, and β is the preset parameter in the Leaky ReLU activation function, that is, the preset multiple. The output of the Leaky ReLU activation function is the fourth logging data. The value range of the fourth logging data is between 0 and 1, and the decimal is usually two digits after the decimal point.
[0184] The fourth logging data output by the Leaky ReLU activation function is input to the second pooling layer R as the fifth logging data 1 , exemplarily, in another specific embodiment, if the input to the second pooling layer R 1 When there are 6 fifth well logging data in the ).
[0185] The maximum value of 0.86 was extracted from the fourth receptive field number (0.86, 0.44). The maximum value of 0.62 was extracted from the fourth receptive field data (0.62, 0.46). The maximum value of 0.65 was extracted from the fourth receptive field data (0.51, 0.65). The sixth log data was constructed using the extracted 0.86, 0.62 and 0.65. That is, the second pooling layer R 1 The output is the sixth logging data.
[0186] The second pooling layer R 3 The output logging data is input to the second fully connected layer, and in the second fully connected layer, the second pooling layer R 3 The output logging data is processed by the second full connection, and the second reservoir classification result corresponding to the target conventional logging curve data is output.
[0187] In a possible embodiment, after step S105 is performed to determine the respective corresponding category of the target reservoir corresponding to each target depth region in the target well, the following steps may be specifically performed:
[0188] S1051: For each target reservoir, determine whether the category corresponding to the target reservoir is the same as the category corresponding to other target reservoirs adjacent to the target reservoir.
[0189] For the target reservoir corresponding to each target depth region, there are 1 or 2 other target reservoirs adjacent to the target reservoir. Exemplarily, there is one other target reservoir adjacent to the target reservoir corresponding to the target depth regions 100-102, specifically, the target reservoir corresponding to the target depth regions 102-104. The target reservoirs corresponding to the target depth regions 120-122 are adjacent to two other target reservoirs, which are the target reservoirs corresponding to the target depth regions 118-120 and the target reservoirs corresponding to the target depth regions 122-124.
[0190] S1052: If the category corresponding to the target reservoir is the same as the category corresponding to other target reservoirs adjacent to the target reservoir, combine the target reservoir with other target reservoirs adjacent to the target reservoir to obtain a composite reservoir.
[0191] In a specific embodiment, the class of the target reservoir corresponding to the target depth regions 120-122 is a first-class high-quality reservoir, and the class of the target reservoir corresponding to the target reservoir corresponding to the target depth regions 118-120 is a class of high-quality reservoir Reservoir, the type of the target reservoir corresponding to the target reservoir corresponding to the target depth area 122-124 is a non-high-quality reservoir, then the target reservoir corresponding to the target depth area 120-122 and the target corresponding to the target depth area 118-120. The target reservoirs corresponding to the reservoirs are merged to obtain a synthetic reservoir corresponding to the target depth region 118-122, and the type of the synthetic reservoir is a first-class high-quality reservoir.
[0192] Due to the limitation of reservoir thickness, the thickness of each type of high-quality reservoir or non-high-quality reservoir will not be too thin. The layer division results are further merged. First, the depth difference corresponding to each divided reservoir is detected globally. For the results of fine reservoir division, the two parts of the reservoir before and after the layer are compared and merged with the surrounding reservoir categories. By using this technology, the smaller , eliminate abnormal classification results, and re-establish reservoir boundaries.
[0193] In a possible embodiment, the first convolutional neural network classification model, the second convolutional neural network classification model and the target fully connected layer are trained in the following manner:
[0194]S1001: Construct training samples for training the first convolutional neural network classification model, the second convolutional neural network classification model and the target fully connected layer; the training samples include: sample imaging logging images corresponding to the sample depth region in the sample well and the sample conventional logging curve data, and the category label of the sample reservoir corresponding to the sample depth area; the sample conventional logging curve data contains the respective sample logging data corresponding to multiple sample logging curves in the sample depth area.
[0195] When constructing a sample imaging logging image, an initial sample imaging logging image corresponding to the sample well is obtained first, and the initial sample imaging logging image includes the sample logging image corresponding to each sample depth in the sample well.
[0196] Remove the labeled information in the initial sample imaging logging image, and segment the initial sample imaging logging image after the labeled information according to the preset depth interval to obtain multiple intermediate sample imaging logging images and each intermediate sample. The sample depth region corresponding to the imaging log image.
[0197] For each intermediate sample imaging logging image, grayscale processing is performed on the intermediate sample imaging logging image to obtain a sample imaging logging image corresponding to the intermediate sample imaging logging image.
[0198] In this application, since the pixels of the initial sample imaging logging image are too large and contain redundant information for labeling, if the initial sample imaging logging image is directly used to train the first initial classification model, it will lead to difficulty in model training. Too much redundant information will bring too much noise and affect the final accuracy of the first convolutional neural network classification model. In order to improve the efficiency and accuracy of model training, the present application adopts the image segmentation technology to perform segmentation processing on the initial sample imaging logging images, remove the labelled redundant information of the initial sample imaging logging images, and tailor them to be beneficial to the first sample. The small-size sample imaging logging images trained by the convolutional neural network classification model increase the amount of data and improve the training efficiency and accuracy of the first convolutional neural network classification model.
[0199] When constructing sample conventional logging curve data, the specific steps can be performed as follows:
[0200] Obtain the initial sample conventional logging curve data corresponding to the sample drilling; the initial sample conventional logging curve data contains the initial sample logging curve data corresponding to multiple initial sample logging curves; the initial sample logging curve data contains the sample logging curve data Initial sample curve values corresponding to each depth in the well;
[0201] For the initial sample logging curve corresponding to each initial sample logging curve data, perform smooth filtering processing on the initial sample logging curve to obtain a smoothed sample logging curve and a first sample log corresponding to the smoothed sample logging curve Well curve data; the first sample well log curve data includes first sample curve values corresponding to each depth in the sample well;
[0202] For each first sample log curve data, according to the maximum first sample curve value and the minimum first sample curve value in the first sample log curve data, the first sample log curve data in the Each first sample curve value is respectively normalized to obtain a second sample curve value corresponding to each first sample curve value, and the second sample log value is determined according to the second sample curve value corresponding to each depth curve data and the sample logging curve corresponding to the second sample curve data; the value range of the second sample curve value is 0-1;
[0203] For the second sample logging curve data corresponding to each sample logging curve, according to each sample depth included in the sample depth area, select a second sample corresponding to each sample depth from the second sample logging curve data curve value, and perform mean processing on the selected second sample curve value to obtain the sample curve value corresponding to the sample depth area, and use the sample curve value corresponding to the sample depth area as the sample logging curve corresponding to the sample depth area Sample log data.
[0204] Among them, in the sample well, each sample depth region corresponds to a sample imaging logging image and a sample conventional logging curve data.
[0205] S1002: Input the sample imaging logging image into the first initial classification model, and process the second image feature of the sample imaging logging image by using the first initial classification model to obtain a first prediction result of the sample reservoir.
[0206] The first initial classification model includes: the first initial convolution layer of the first preset number of times, the first initial pooling layer of the first preset number of times, the ELU activation function, and a first initial fully connected layer. The first sample convolution processing is performed in the convolutional layer, the first sample pooling processing is performed in the first initial pooling layer, the first initial nonlinear transformation is performed in the ELU activation function, and the first initial fully connected layer is performed. The first sample full connection processing is performed in .
[0207] The initial sample imaging logging image feature corresponding to the sample imaging logging image is used as the input sample image feature matrix, and the input sample image feature matrix is subjected to a first preset number of first sample convolution processing and each first sample convolution processing. Then, the first initial nonlinear transformation is performed, and the first sample pooling process is performed on the results obtained by the first initial nonlinear transformation each time;
[0208] Taking the sample image feature matrix obtained by each first sample pooling process as the input sample image feature matrix of the next first sample convolution process;
[0209] The first sample convolution processing includes: in the first initial convolution layer, calculating the dot product of each fifth receptive field data in the first sample image feature matrix and the first sample convolution kernel respectively, to obtain each the fifth feature value corresponding to the fifth receptive field data, and construct a second sample image feature matrix according to each fifth feature value; the matrix size corresponding to the fifth receptive field data and the matrix size corresponding to the first sample convolution kernel same;
[0210] The first initial nonlinear transformation includes: taking the second sample image feature matrix output by the first initial convolution layer as the third sample image feature matrix, and performing the first initial nonlinear transformation on the third sample image feature matrix; specifically, for For each third sample image feature matrix, each sixth feature value in the third sample image feature matrix is input into the ELU activation function, and each corresponding sixth feature value is output; in the ELU activation function, For each of the sixth characteristic values, when the sixth characteristic value is greater than 0, the sixth characteristic value is determined as the seventh characteristic value; when the sixth characteristic value is not greater than 0, the sixth characteristic value is determined as the seventh characteristic value. Transform to obtain the seventh characteristic value; use the seventh characteristic value to construct the fourth sample image characteristic matrix;
[0211] The first sample pooling process includes: in the first initial pooling layer, extracting the maximum value from each sixth receptive field data in the feature matrix of the fifth sample image, and extracting the maximum value according to each sixth receptive field data The extracted maximum value constructs the sixth sample image feature matrix;
[0212] In the first initial full connection layer, the first sample full connection process is performed on the output sample image feature matrix obtained by the last first sample pooling process, and the first prediction result corresponding to the sample imaging logging image is obtained. The first prediction result includes the probability of each category of the sample reservoir corresponding to the sample depth region predicted by the first initial classification model.
[0213] S1003: Input the sample conventional logging curve data into the second initial classification model, and process each sample logging data included in the sample conventional logging curve data through the second initial classification model to obtain a second prediction of the sample reservoir result.
[0214] The second initial classification model includes: a second initial convolution layer for a second preset number of times, a second initial pooling layer for a second preset number of times, a Leaky ReLU activation function, and a second initial fully connected layer. The second sample convolution processing is performed in the second initial convolutional layer, the second sample pooling processing is performed in the second initial pooling layer, the second initial nonlinear transformation is performed in the Leaky ReLU activation function, and the second initial The second sample fully connected processing is performed in the fully connected layer.
[0215] Each sample logging data contained in the sample conventional logging curve data is used as input sample logging data, and the input sample logging data is subjected to second sample convolution processing for a second preset number of times and each second sample convolution processing Then, the sample nonlinear transformation is performed, and the second sample pooling process is performed on the result obtained by each sample nonlinear transformation;
[0216] The sample feature data obtained by each second sample pooling process is used as the input sample logging data for the next second sample convolution process;
[0217] The second sample convolution processing includes: in the second initial convolution layer, dividing all the first sample logging data to obtain at least one seventh receptive field data; for each seventh receptive field data, calculating the The dot product of the first sample logging data included in the seventh receptive field data and the second convolution kernel is obtained to obtain the eighth characteristic value corresponding to the seventh receptive field data, and the second sample measurement value is constructed according to the eighth characteristic value. Well data; the second sample nonlinear transformation includes: in the Leaky ReLU activation function, for each third sample well log data, judging whether the third sample well log data is greater than 0; if the third sample well log data is greater than 0 , the third sample logging data is determined as the fourth sample logging data; if the third sample logging data is not greater than 0, the product of the third sample logging data and the preset multiple is determined as the fourth sample logging data;
[0218] The second sample pooling process includes: dividing all the fifth sample logging data to obtain at least one eighth receptive field data; for each eighth receptive field data, extracting the maximum value from the eighth receptive field data , and construct the sixth sample logging data according to the maximum value extracted from each eighth receptive field data;
[0219] In the second initial full connection layer, the second sample full connection processing is performed on the output sample logging data obtained by the last second pooling process, and the second prediction result corresponding to the sample conventional logging curve data is obtained. The second prediction result includes the probability of each category of the sample reservoir corresponding to the sample depth region predicted by the second initial classification model.
[0220] S1004: Input a third prediction result obtained by splicing the first prediction result of the sample reservoir and the second prediction result into the initial fully connected layer, and output the prediction classification result of the sample reservoir.
[0221] The prediction classification result includes the probability of each category of the sample reservoir corresponding to the sample depth region predicted after comprehensively considering the sample imaging logging image and the sample conventional logging curve data.
[0222] S1005: Calculate the loss value according to the predicted classification result and the class label of the sample reservoir.
[0223] According to the predicted classification result of the sample reservoir, the prediction category of the sample reservoir is determined; according to the predicted category and category label of the sample reservoir, the loss value is calculated by the cross-entropy loss function.
[0224] In a specific embodiment, in the case of binary classification, we assume that the predicted class probabilities are p (such as the probability of high-quality reservoirs) and 1-p (such as the probability of non-high-quality reservoirs), then the loss function expresses The formula is:
[0225]
[0226] Among them, U is the loss value, M is the number of training samples, U j is the loss result corresponding to the jth training sample, t j is the class label of the jth training sample, q j Probability of predicting a high-quality reservoir for the jth training sample.
[0227] In another specific embodiment, in the case of multiple classes, that is, when there are multiple reservoir classes, the loss function expression is:
[0228]
[0229] Among them, L is the loss value, N is the number of training samples, L iis the loss result corresponding to the ith training sample, G is the amount of classification, y ic is the class label of the ith training sample, P ic Probability of predicting class C for the ith training sample.
[0230] S1006: Use the loss value to update the parameters in the first initial classification model, the second initial classification model and the initial fully connected layer, and retrain the updated first initial classification model, the second initial classification model and the initial fully connected layer, The training is stopped until the training reaches the preset number of training times, and the first convolutional neural network classification model, the second convolutional neural network classification model and the target fully connected layer are obtained.
[0231] After the training, the first initial convolutional layer, the first initial pooling layer and the first initial fully connected layer in the first initial classification model are used as the first convolutional layer, The first pooling layer and the first fully connected layer. The second initial convolutional layer, the second initial pooling layer, the initial activation function and the second initial fully connected layer in the second initial classification model are used as the second convolutional layer in the second convolutional neural network classification model, Second pooling layer, activation function and second fully connected layer.
[0232] In a possible embodiment, after step S105 is performed to determine the category of the target reservoir according to the classification result of the target reservoir, the following steps may be performed specifically:
[0233] According to the category of the target reservoir, the storage amount of the target substance stored in the target reservoir is evaluated.
[0234] The types of target reservoirs are different, resulting in different storage amounts of target substances stored in the target reservoirs. Target substances include oil, natural gas, and the like. In a specific embodiment, the categories of the target reservoirs are classified into first-class high-quality reservoirs, second-class high-quality reservoirs, and non-high-quality reservoirs. Among them, a class of high-quality reservoirs has the largest amount of target substances, and non-high-quality reservoirs have the least amount of target substances.
[0235] In a possible embodiment, in step S1052, if the category corresponding to the target reservoir is the same as the category corresponding to other target reservoirs adjacent to the target reservoir, the target reservoir is adjacent to the target reservoir After merging other target reservoirs in the synthetic reservoir to obtain a synthetic reservoir, you can also perform the following steps:
[0236] Based on the number and type of target reservoirs contained in the synthetic reservoir, the storage amount of the target substance stored in the synthetic composition is estimated.
Example Embodiment
[0237] Embodiment 2:
[0238] Based on the same technical concept, the embodiments of the present application also provide a reservoir classification device, Figure 4 A schematic structural diagram of a reservoir classification device provided in an embodiment of the present application is shown, as Figure 4 As shown, the device includes:
[0239] The first acquisition module 401 is used to acquire the target imaging logging image and target conventional logging curve data corresponding to the target depth area in the target well; the target conventional logging curve data includes multiple target logging curves in the The corresponding target logging data at the target depth area;
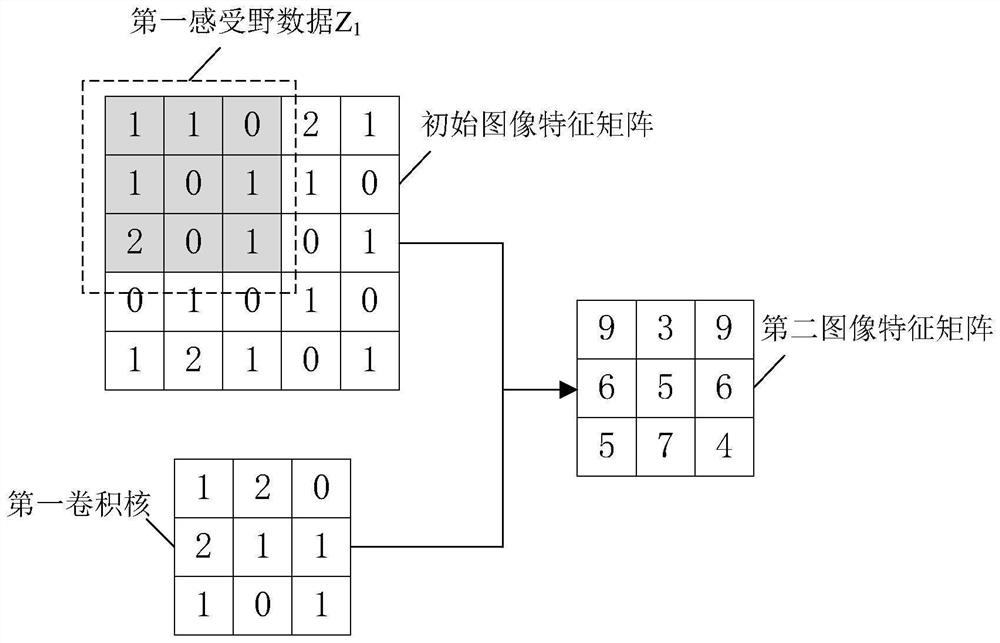
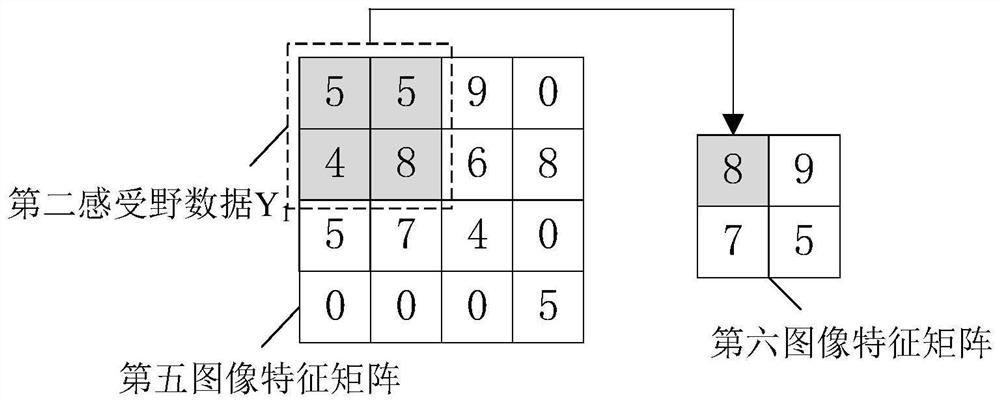
[0240] The first input module 402 is used to input the target imaging logging image into the pre-trained first convolutional neural network classification model, and the target imaging logging is performed by the first convolutional neural network classification model The first image feature of the image is processed to obtain the first reservoir classification result of the target reservoir corresponding to the target depth region in the target well;
[0241] The second input module 403 is configured to input the target conventional logging curve data into the pre-trained second convolutional neural network classification model, and use the second convolutional neural network classification model to measure the target conventional logging curve data. processing each of the target logging data included in the well curve data to obtain a second reservoir classification result of the target reservoir corresponding to the target depth region in the target well;
[0242] The third input module 404 is configured to input the splicing result obtained by splicing the first reservoir classification result and the second reservoir classification result into the pre-trained target fully connected layer to obtain the target reservoir target reservoir classification results;
[0243] The first determination module 405 is configured to determine the category of the target reservoir according to the classification result of the target reservoir.
[0244] Optionally, the second acquiring module is configured to acquire the initial imaging logging image corresponding to the target well before the first acquiring module 401 acquires the target imaging logging image corresponding to the target depth region in the target well; the The initial imaging logging image contains imaging logging information corresponding to each depth in the target well;
[0245] a segmentation module, configured to segment the initial imaging logging image according to a preset depth interval to obtain a plurality of imaging logging images and the target depth region corresponding to each imaging logging image;
[0246] The grayscale processing module is configured to perform grayscale processing on each imaging logging image to obtain the target imaging logging image corresponding to the imaging logging image.
[0247] Optionally, the third acquisition module is configured to acquire initial conventional well logging curve data corresponding to the target well before the first acquisition module 401 acquires the target conventional logging curve data corresponding to the target depth region position in the target well. ; The initial conventional logging curve data includes initial logging curve data corresponding to a plurality of initial logging curves; the initial logging curve data includes initial curve values corresponding to each depth in the target well;
[0248] a filtering module, configured to perform smooth filtering processing on each of the initial logging curve data to obtain first logging curve data; the first logging curve data includes the target The first curve value corresponding to each depth in the well;
[0249] The normalization module is used for, for each of the first logging curve data, according to the maximum first curve value and the minimum first curve value in the first well logging curve data, in the first logging curve data Each of the first curve values of the well curve data and the target well log curve corresponding to the second well log curve data; the value range of the second curve value is 0-1;
[0250] The mean value processing module is used for selecting the second logging curve data corresponding to each target logging curve according to each target depth included in the target depth area from the second logging curve data The second curve value corresponding to each of the target depths is obtained, and the average value processing is performed on the selected second curve values to obtain the target curve value corresponding to the target depth area, and the target depth area is The corresponding target curve value is used as the target logging data corresponding to the target logging curve at the target depth region.
[0251] Optionally, the first input module 402 is used to process the first image feature of the target imaging logging image through the first convolutional neural network classification model to obtain the target in the target well. When the first reservoir classification result of the target reservoir corresponding to the depth region is used, it is specifically used for:
[0252] The initial image feature matrix corresponding to the target imaging logging image is used as the input image feature matrix, and the input image feature matrix is subjected to the first convolution processing for a first preset number of times, and the first convolution processing is performed after each first convolution processing. a nonlinear transformation, performing first pooling processing on the result obtained by each first nonlinear transformation;
[0253] The image feature matrix obtained by each first pooling process is used as the input image feature matrix of the next first convolution process;
[0254] The first convolution processing includes: calculating the dot product of each first receptive field data in the first image feature matrix and the first convolution kernel respectively, to obtain a first feature corresponding to each of the first receptive field data value, and construct a second image feature matrix according to each of the first feature values; the matrix size corresponding to the first receptive field data is the same as the matrix size corresponding to the first convolution kernel;
[0255] The first nonlinear transformation includes: for each third image feature matrix, inputting each second feature value in the third image feature matrix into a preset activation function, to obtain each second feature value in the third image feature matrix. a third characteristic value corresponding to the second characteristic value; in the preset activation function, for each second characteristic value, when the second characteristic value is greater than 0, the second characteristic value is determined is the third feature value; when the second feature value is not greater than 0, the second feature value is changed to obtain a third feature value; the third feature value is used to construct a fourth image feature matrix;
[0256] The first pooling process includes: extracting the maximum value from each second receptive field data in the fifth image feature matrix, and constructing a sixth value according to the maximum value extracted from each second receptive field data. image feature matrix;
[0257] The first full connection process is performed on the output image feature matrix obtained by the last first pooling process to obtain the first reservoir classification result corresponding to the target imaging logging image.
[0258] Optionally, the second input module 403 is configured to process each of the target logging data included in the target conventional logging curve data by using the second convolutional neural network classification model to obtain the When the second reservoir classification result of the target reservoir corresponding to the target depth area in the target well is used, it is specifically used for:
[0259] Each of the target logging data contained in the target conventional logging curve data is used as input logging data, and the input logging data is subjected to a second pre-set number of second convolution processing and a second volume each time. After product processing, nonlinear transformation is performed, and the second pooling process is performed on the results obtained by each nonlinear transformation;
[0260] The feature data obtained by each second pooling process is used as the input logging data for the next second convolution process;
[0261] The second convolution processing includes: dividing all the first logging data to obtain at least one third receptive field data; for each of the third receptive field data, calculating a The dot product of the first logging data and the second convolution kernel obtains the fourth characteristic value corresponding to the third receptive field data, and the second logging data is constructed according to the fourth characteristic value; the third The size of the matrix corresponding to the receptive field data is the same as the size of the matrix corresponding to the second convolution kernel; the second nonlinear transformation includes: for each third logging data, judging whether the third logging data is greater than 0; If the third logging data is greater than 0, the third logging data is determined as the fourth logging data; if the third logging data is not greater than 0, the product of the third logging data and a preset multiple is determined Determined as the fourth logging data;
[0262] The second pooling process includes: dividing all the fifth logging data to obtain at least one fourth receptive field data; for each of the fourth receptive field data, extracting from the fourth receptive field data; maximum value, and construct sixth logging data according to the maximum value extracted from each of the fourth receptive field data; perform second full connection processing on the output logging data obtained by the last second pooling process to obtain the and the classification result of the second reservoir corresponding to the target conventional logging curve data.
[0263] Optionally, also include:
[0264] a judging module, configured to judge the corresponding category of the target reservoir for each of the target reservoirs after determining the category corresponding to the target reservoir corresponding to each of the target depth regions in the target well Whether the categories corresponding to other target reservoirs adjacent to the target reservoir are the same;
[0265] a merging module, configured to merge the target reservoir with other target reservoirs adjacent to the target reservoir if the category corresponding to the target reservoir is the same as the category corresponding to other target reservoirs adjacent to the target reservoir , to obtain a synthetic reservoir.
[0266] Optionally, also include:
[0267] A building module for constructing training samples for training the first convolutional neural network classification model, the second convolutional neural network classification model and the target fully connected layer; the training samples include: sample drilling The sample imaging logging image and sample conventional logging curve data corresponding to the inner sample depth region, and the category label of the sample reservoir corresponding to the sample depth region; the sample conventional logging curve data includes multiple sample logging curves the respective sample logging data corresponding to the curves at the sample depth region;
[0268] The fourth input module is used for inputting the sample imaging logging image into a first initial classification model, and calculating the second image feature of the sample imaging logging image through the first initial classification model to obtain the the first prediction result of the sample reservoir;
[0269] A fifth input module is used to input the sample conventional logging curve data into a second initial classification model, and use the second initial classification model to log each of the samples included in the sample conventional logging curve data. Perform weighted calculation on the well data to obtain the second prediction result of the sample reservoir;
[0270] The sixth input module is used to input the third prediction result obtained by splicing the first prediction result and the second prediction result of the sample reservoir into the initial fully connected layer, and output the sample reservoir. Predict classification results;
[0271] a calculation module, configured to calculate a loss value according to the predicted classification result and the category label of the sample reservoir;
[0272] The updating module is used for updating the parameters in the first initial classification model, the second initial classification model and the initial fully connected layer by using the loss value, and for the updated first initial classification model, the The second initial classification model and the initial fully connected layer are retrained, and the training is stopped until the training reaches a preset number of training times, and the first convolutional neural network classification model, the second convolutional neural network classification model and the The target fully connected layer.
[0273] Optionally, also include:
[0274] The second determination module is used for the first determination module to determine the category of the target reservoir according to the classification result of the target reservoir, and then to evaluate the target reservoir according to the category of the target reservoir. Stored amount of target substance stored.
[0275] Refer to the description of Embodiment 1 for the specific execution method steps and principles, which will not be described in detail here.
Example Embodiment
[0276] Embodiment three:
[0277] Based on the same technical concept, the embodiments of the present application also provide an electronic device, Figure 5 A schematic structural diagram of an electronic device provided by an embodiment of the present application is shown, such as Figure 5 As shown, the electronic device 500 includes: a processor 501, a memory 502 and a bus 503, the memory stores machine-readable instructions executable by the processor, and when the electronic device is running, the processor 501 and the memory 502 communicate through the bus 503 , the processor 501 executes machine-readable instructions to perform the method steps described in the first embodiment. Refer to the description of Embodiment 1 for the specific execution method steps and principles, which will not be described in detail here.
PUM


Description & Claims & Application Information
We can also present the details of the Description, Claims and Application information to help users get a comprehensive understanding of the technical details of the patent, such as background art, summary of invention, brief description of drawings, description of embodiments, and other original content. On the other hand, users can also determine the specific scope of protection of the technology through the list of claims; as well as understand the changes in the life cycle of the technology with the presentation of the patent timeline. Login to view more.
Similar technology patents
Report data generating method and system
Owner:BEIJING JOIN CHEER SOFTWARE
Automatic assembling device and method for lamp strips of LED lamp tubes
Owner:SHANGHAI RADIO EQUIP RES INST
Cloud computing based password service system
Owner:LANGCHAO ELECTRONIC INFORMATION IND CO LTD
Caking fertilizer crushing device for agriculture big data
Owner:安徽众力农业装备科技有限公司
A water-cooling apparatus for casting hub mold
Owner:CITIC DICASTAL +1
Classification and recommendation of technical efficacy words
- improve accuracy
- Improve work efficiency
Golf club head with adjustable vibration-absorbing capacity
Owner:FUSHENG IND CO LTD
Direct fabrication of aligners for arch expansion
Owner:ALIGN TECH
Stent delivery system with securement and deployment accuracy
Owner:BOSTON SCI SCIMED INC
Method for improving an HS-DSCH transport format allocation
Owner:NOKIA SOLUTIONS & NETWORKS OY
Catheter systems
Owner:ST JUDE MEDICAL ATRIAL FIBRILLATION DIV
Cooperation service platform facing different source data
Owner:NANJING UNIV OF FINANCE & ECONOMICS
Screw drilling tool, vertical drilling tool testing method and well inclination simulation testing equipment
Owner:DEZHOU UNITED GASOLINEEUM MACHINERY
Method for intelligent automatic identification of transmission circuit parts
Owner:INFORMATION COMM COMPANY STATE GRID SHANDONG ELECTRIC POWER +2
Keyboard spill-proofing mechanism
Owner:LITE ON SINGAPORE PTE LTD