Computer-related method, system, and program product for controlling data visualization in external dimension(s)

a data visualization and external dimension technology, applied in the field of computer graphics display, can solve the problems of ineffective sliding instruments, user blindness to any variation in data over external dimensions, and achieve the effect of better querying and navigation of data

Inactive Publication Date: 2003-02-13
RPX CORP +1
View PDF0 Cites 76 Cited by
  • Summary
  • Abstract
  • Description
  • Claims
  • Application Information

AI Technical Summary

Benefits of technology

[0008] The present invention provides a method, system, and program product for controlling data visualization in at least one external dimension, which allows better querying and navigation of data in external dimension space. Summary information about how data in the data visualization varies across one or more external dimensions is provided in a summary window to guide a user when querying and navigating the data. Through inputs to the summary window, a user can query and navigate a data visualization across one, two, or more external dimensions in a simultaneous and independent manner. External controller(s) are provided for the summary window to further control data queries and navigation across external dimension space. An external controller can be a slider, dial, or other type of Graphical-User Interface (GUI), keyboard, or peripheral input.
[0009] The user makes a query for a data visualization covering a data point in external dimension space by selecting a corresponding point in the summary window. The data visualization will then be displayed in a first display window covering actual and / or interpolated data at the selected point. In a snap-on-grid mode, a data visualization will be displayed based on one or more actual data points closest to the selected point input by the user. Grid points can be optionally displayed in the summary window during the snap-on-grid mode to visually aid a user in identifying actual data points across the external dimension space.
[0012] An animation control panel controls an animated display of the data visualization along a navigation path. The animation control panel includes tape-drive-type controls, such as forward, reverse, and stop controls, for controlling data visualization during animation. The animation control panel further includes a path slider and a speed slider. The path slider allows a user to reset the position of the animation along the navigation path. The speed slider allows a user to adjust the speed of the animation along the path.
[0013] Any single data visualization or animation can be based on actual data points and / or interpolated data points. Known interpolation techniques can be used to obtain interpolated data points based on the actual data points. In this way, for example, an animation can proceed along a navigation path that includes actual and interpolated data points. This enables a user to observe changes in the data visualization more easily and smoothly. An automatic smooth stopping feature allows a user to observe an animation over interpolated data points, but when the animation is stopped or paused, the data visualization continues or reverses to the nearest actual data point. This allows the user to navigate easily to areas of interest and to detect trends in the data using interpolated values, but to perform closer study only upon data visualizations representing actual data points.
[0014] Likewise, summary window information can be drawn based on actual and / or interpolated data. By providing a summary window, the present invention allows the user to preview data in external dimension space before a data visualization is mapped to new external dimension values or ranges. In this way, a user is better equipped to target data queries and navigation across external dimension space. After an input is made to the summary window, the user is free to focus on changes in a still or animated data visualization.

Problems solved by technology

Such sliders, however, are ineffective navigation instruments.
Using sliders alone leaves the user blind to any variations in the data over the external dimensions.

Method used


Image

  • Computer-related method, system, and program product for controlling data visualization in external dimension(s)
  • Computer-related method, system, and program product for controlling data visualization in external dimension(s)
  • Computer-related method, system, and program product for controlling data visualization in external dimension(s)

Examples


Embodiment Construction

[0032] 1. Overview of the Invention

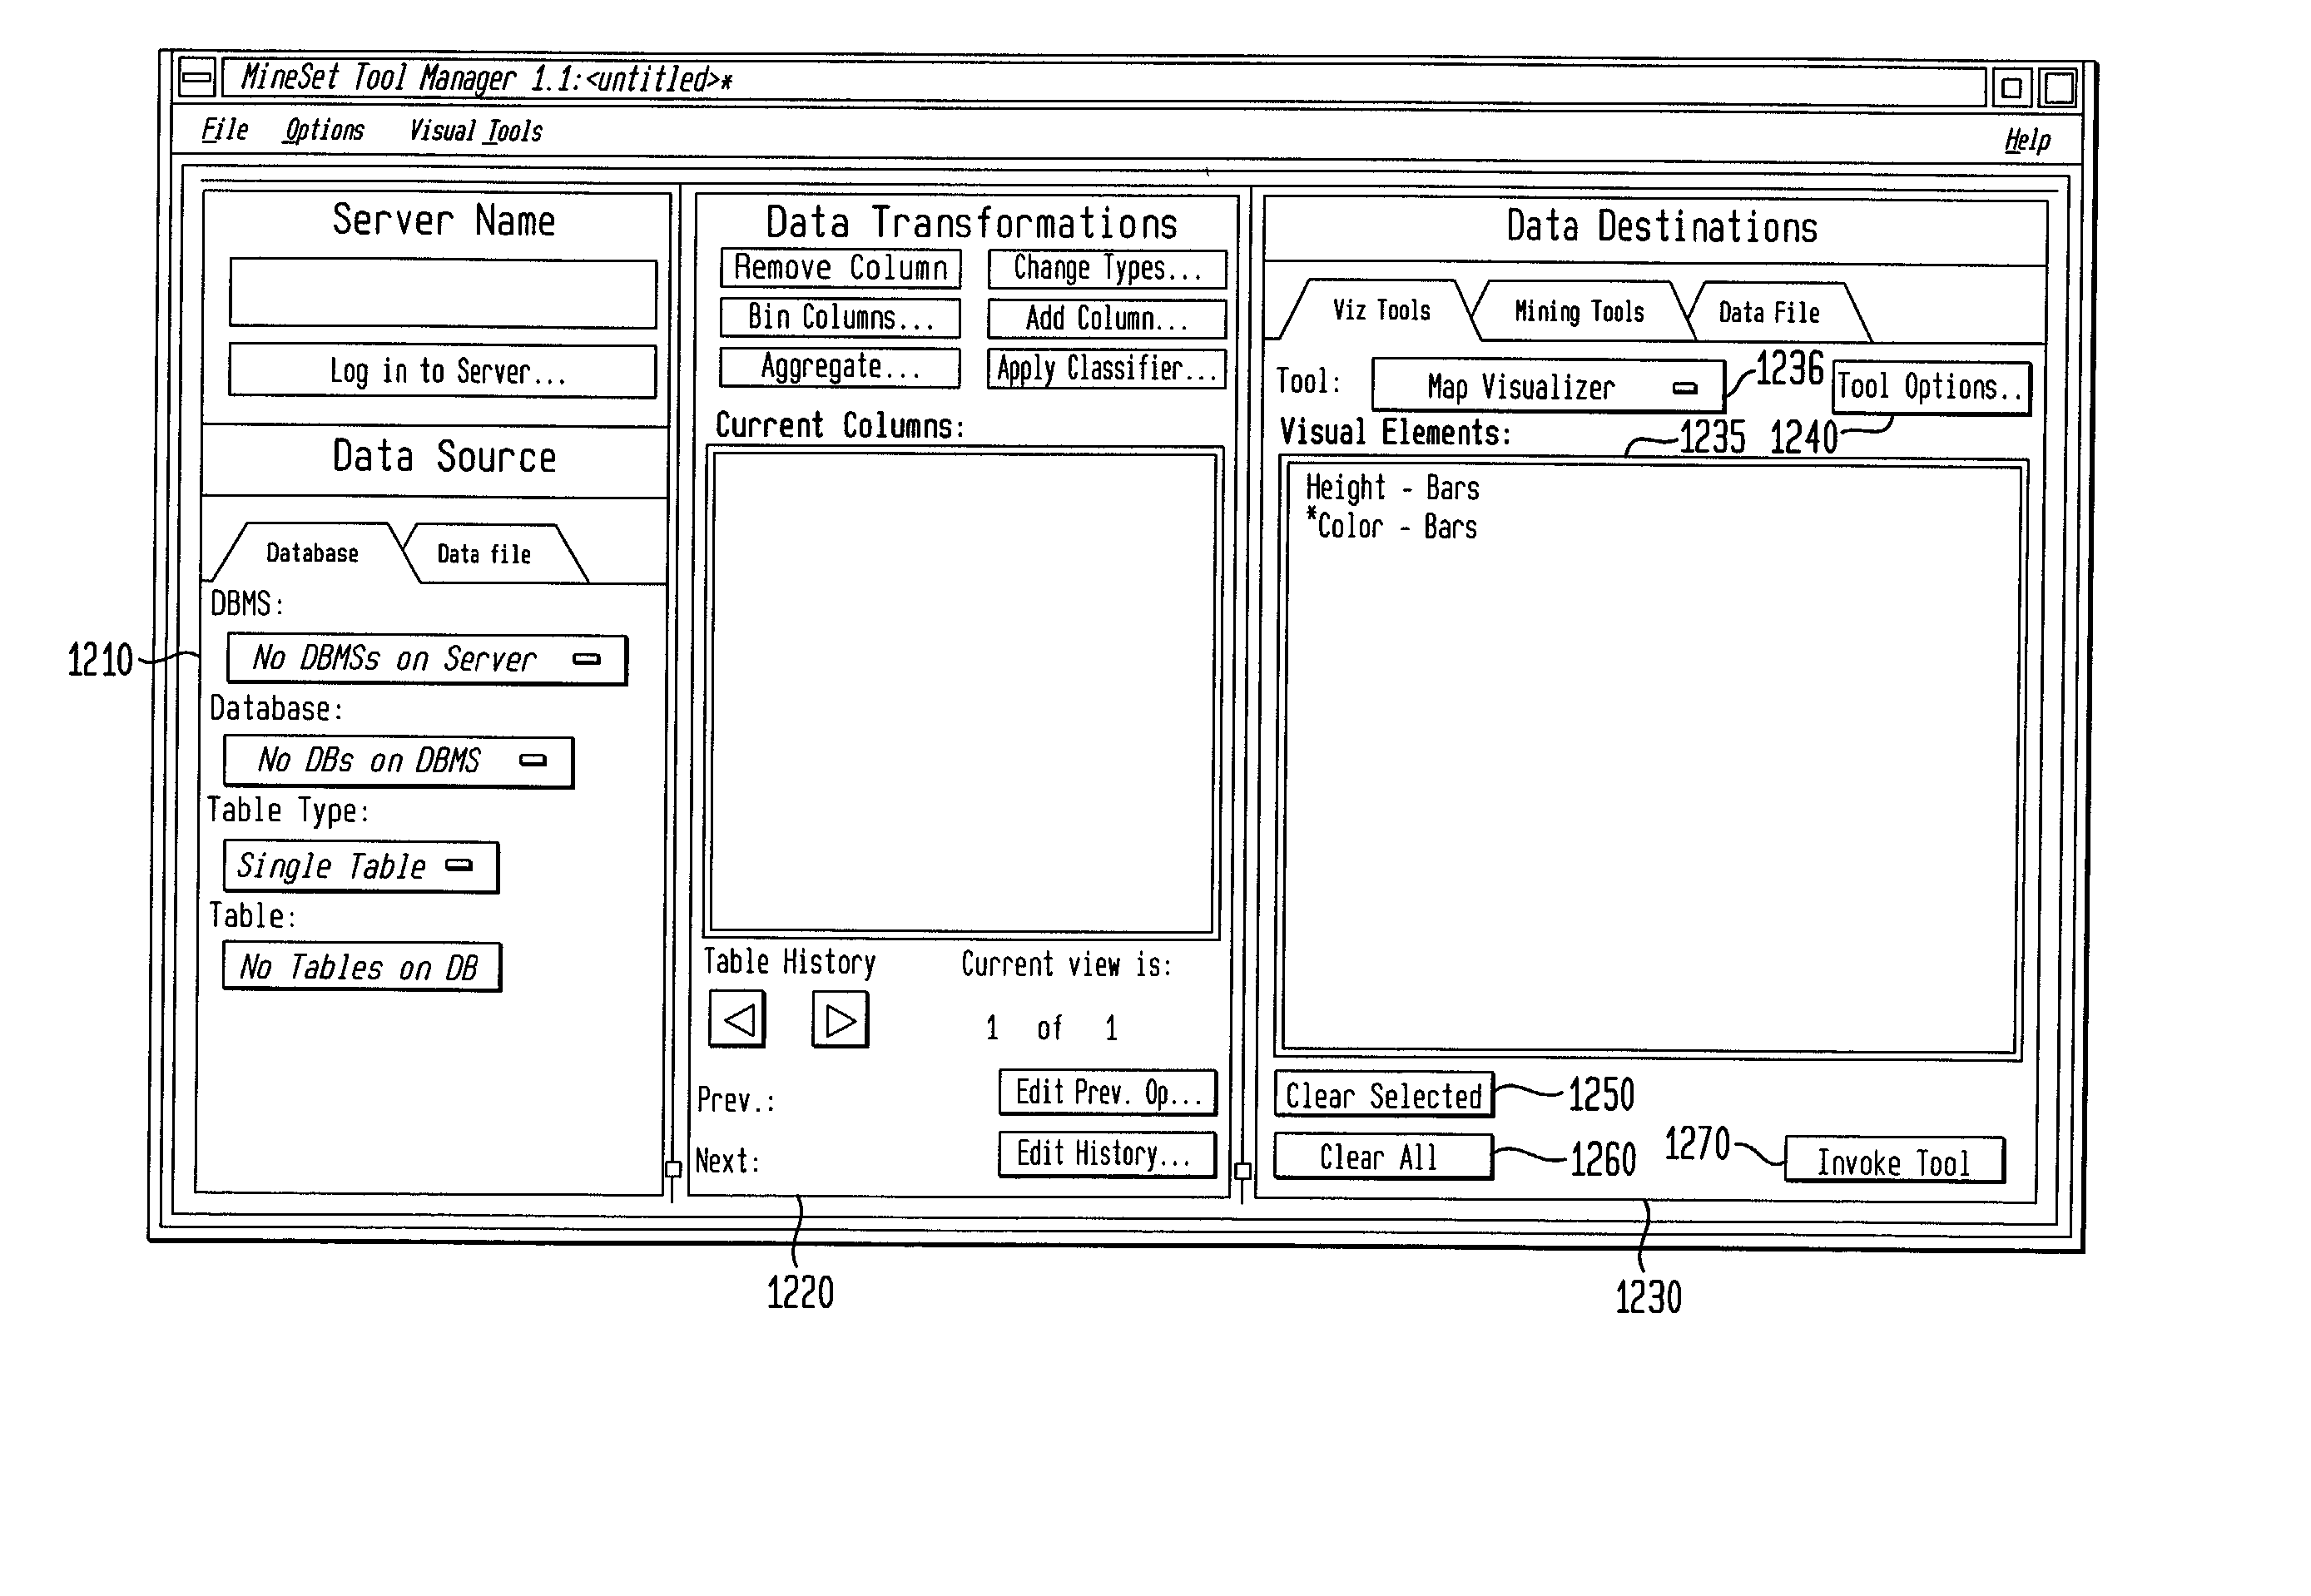
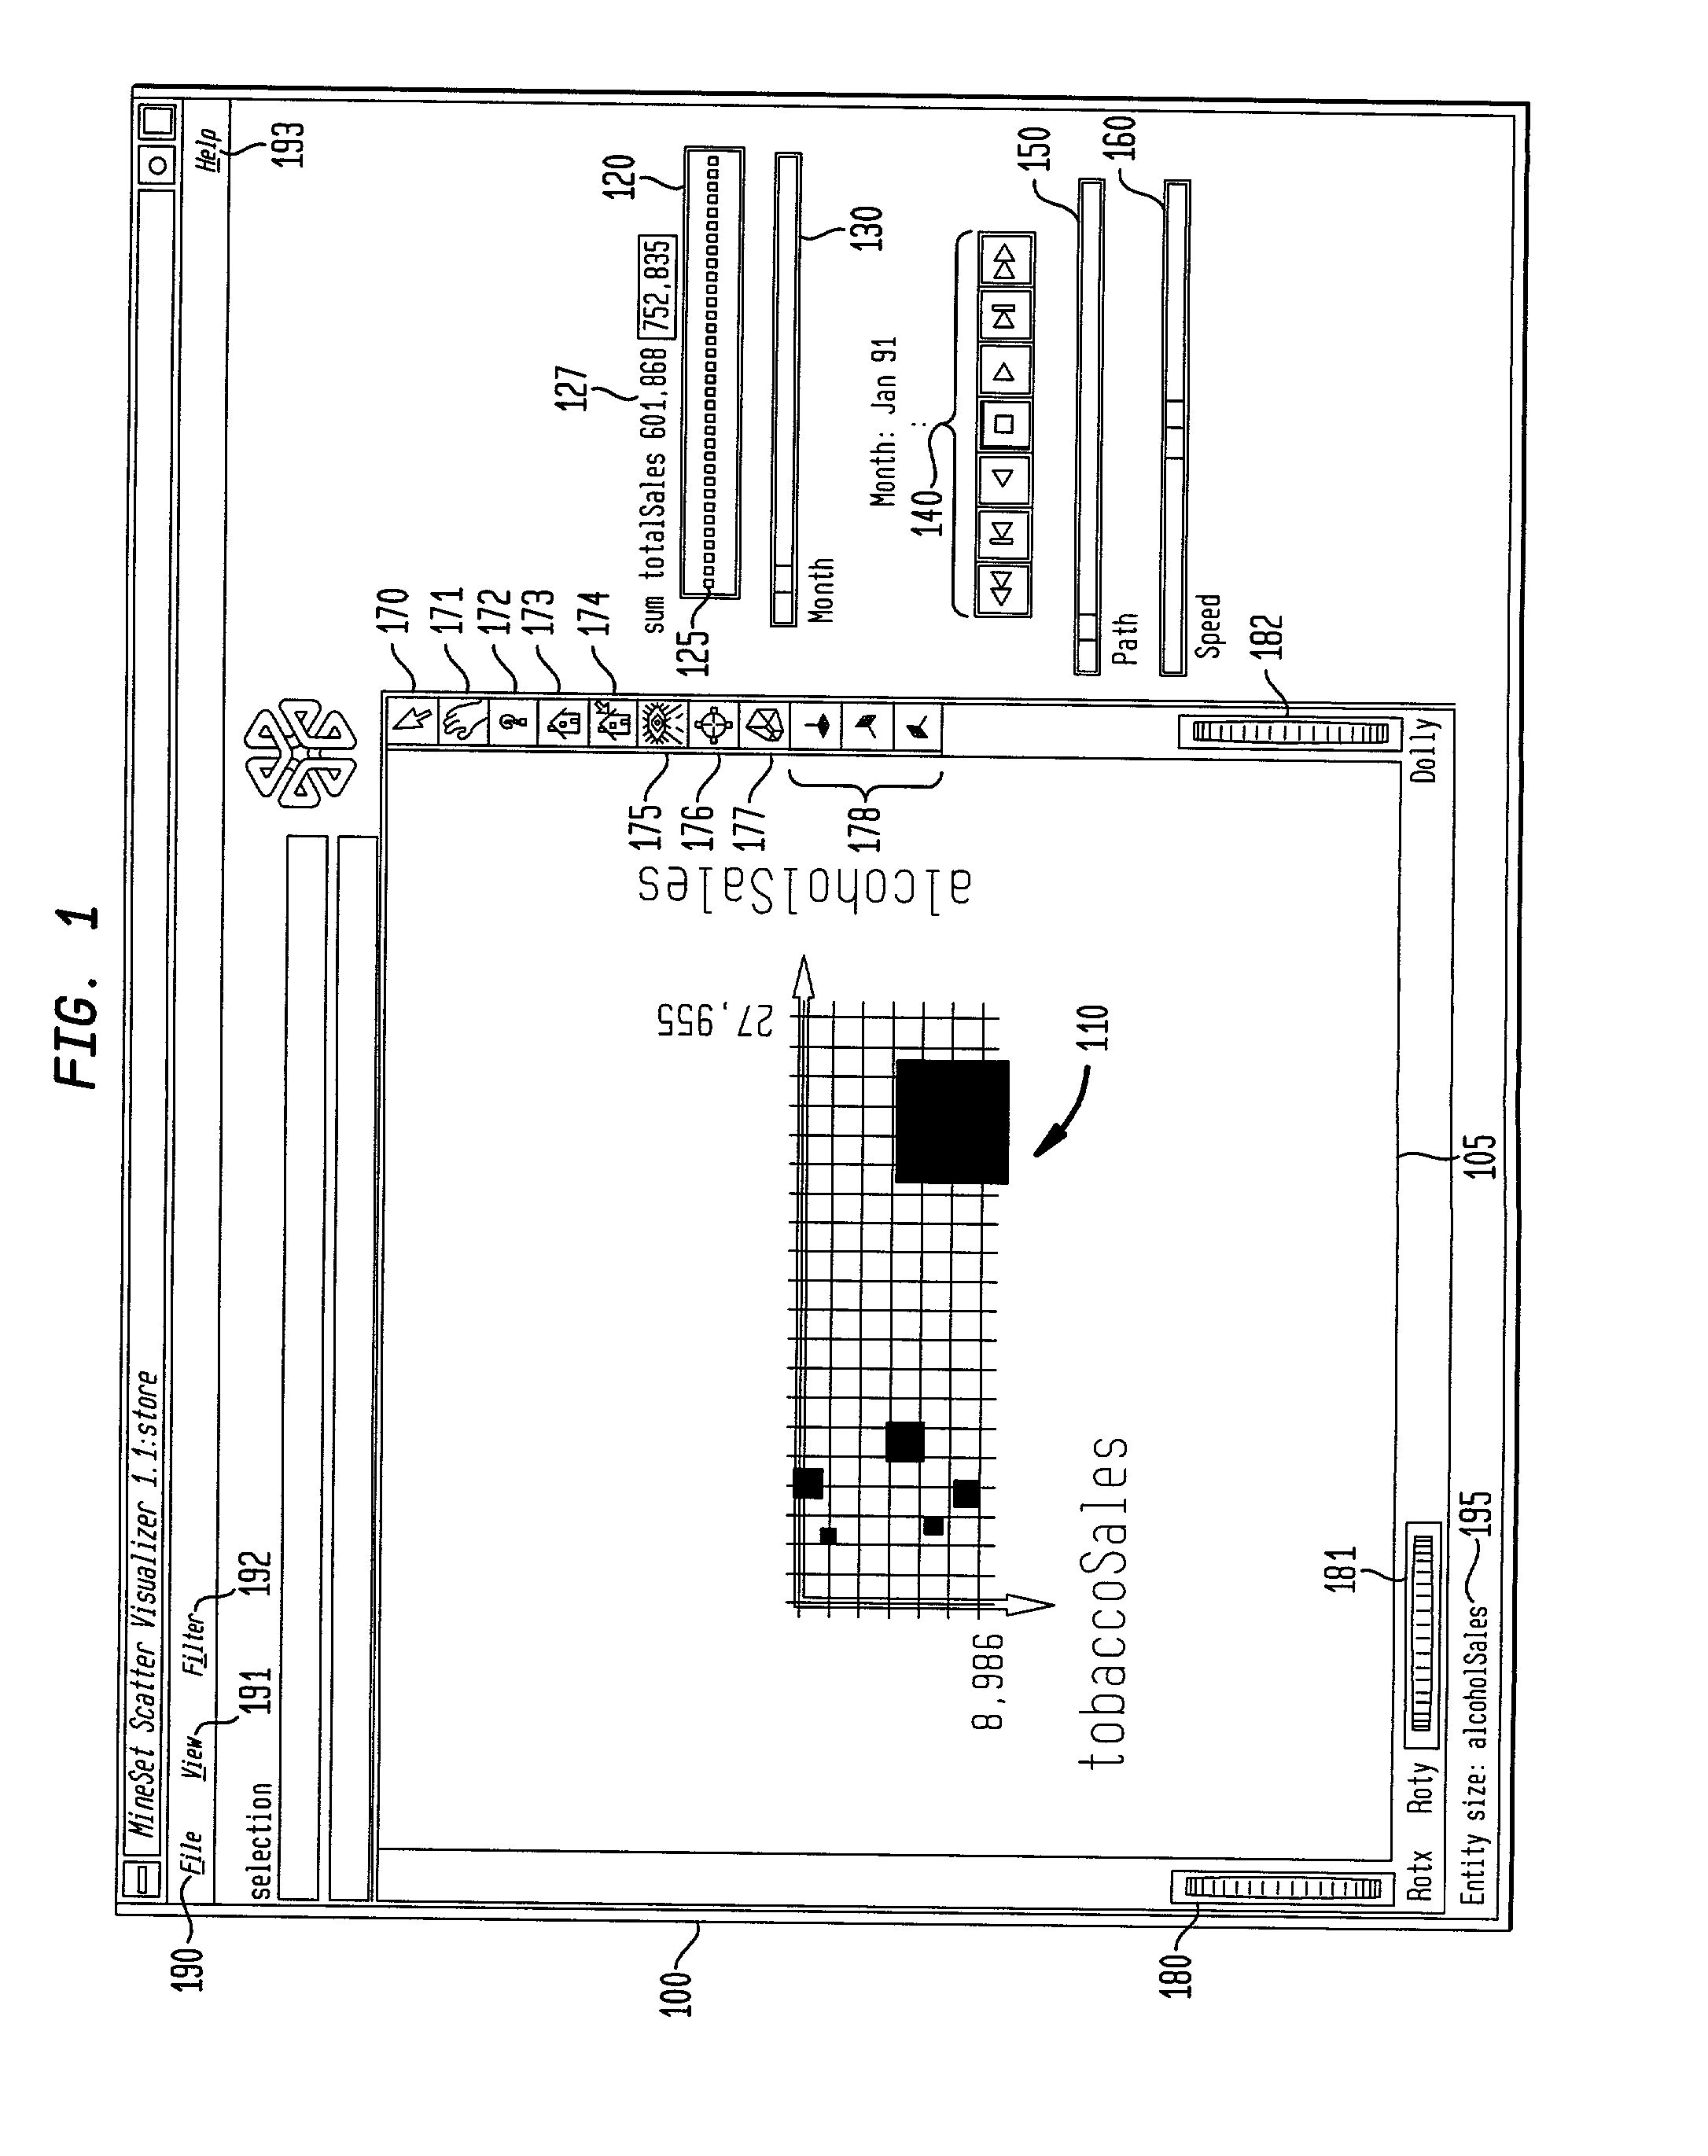
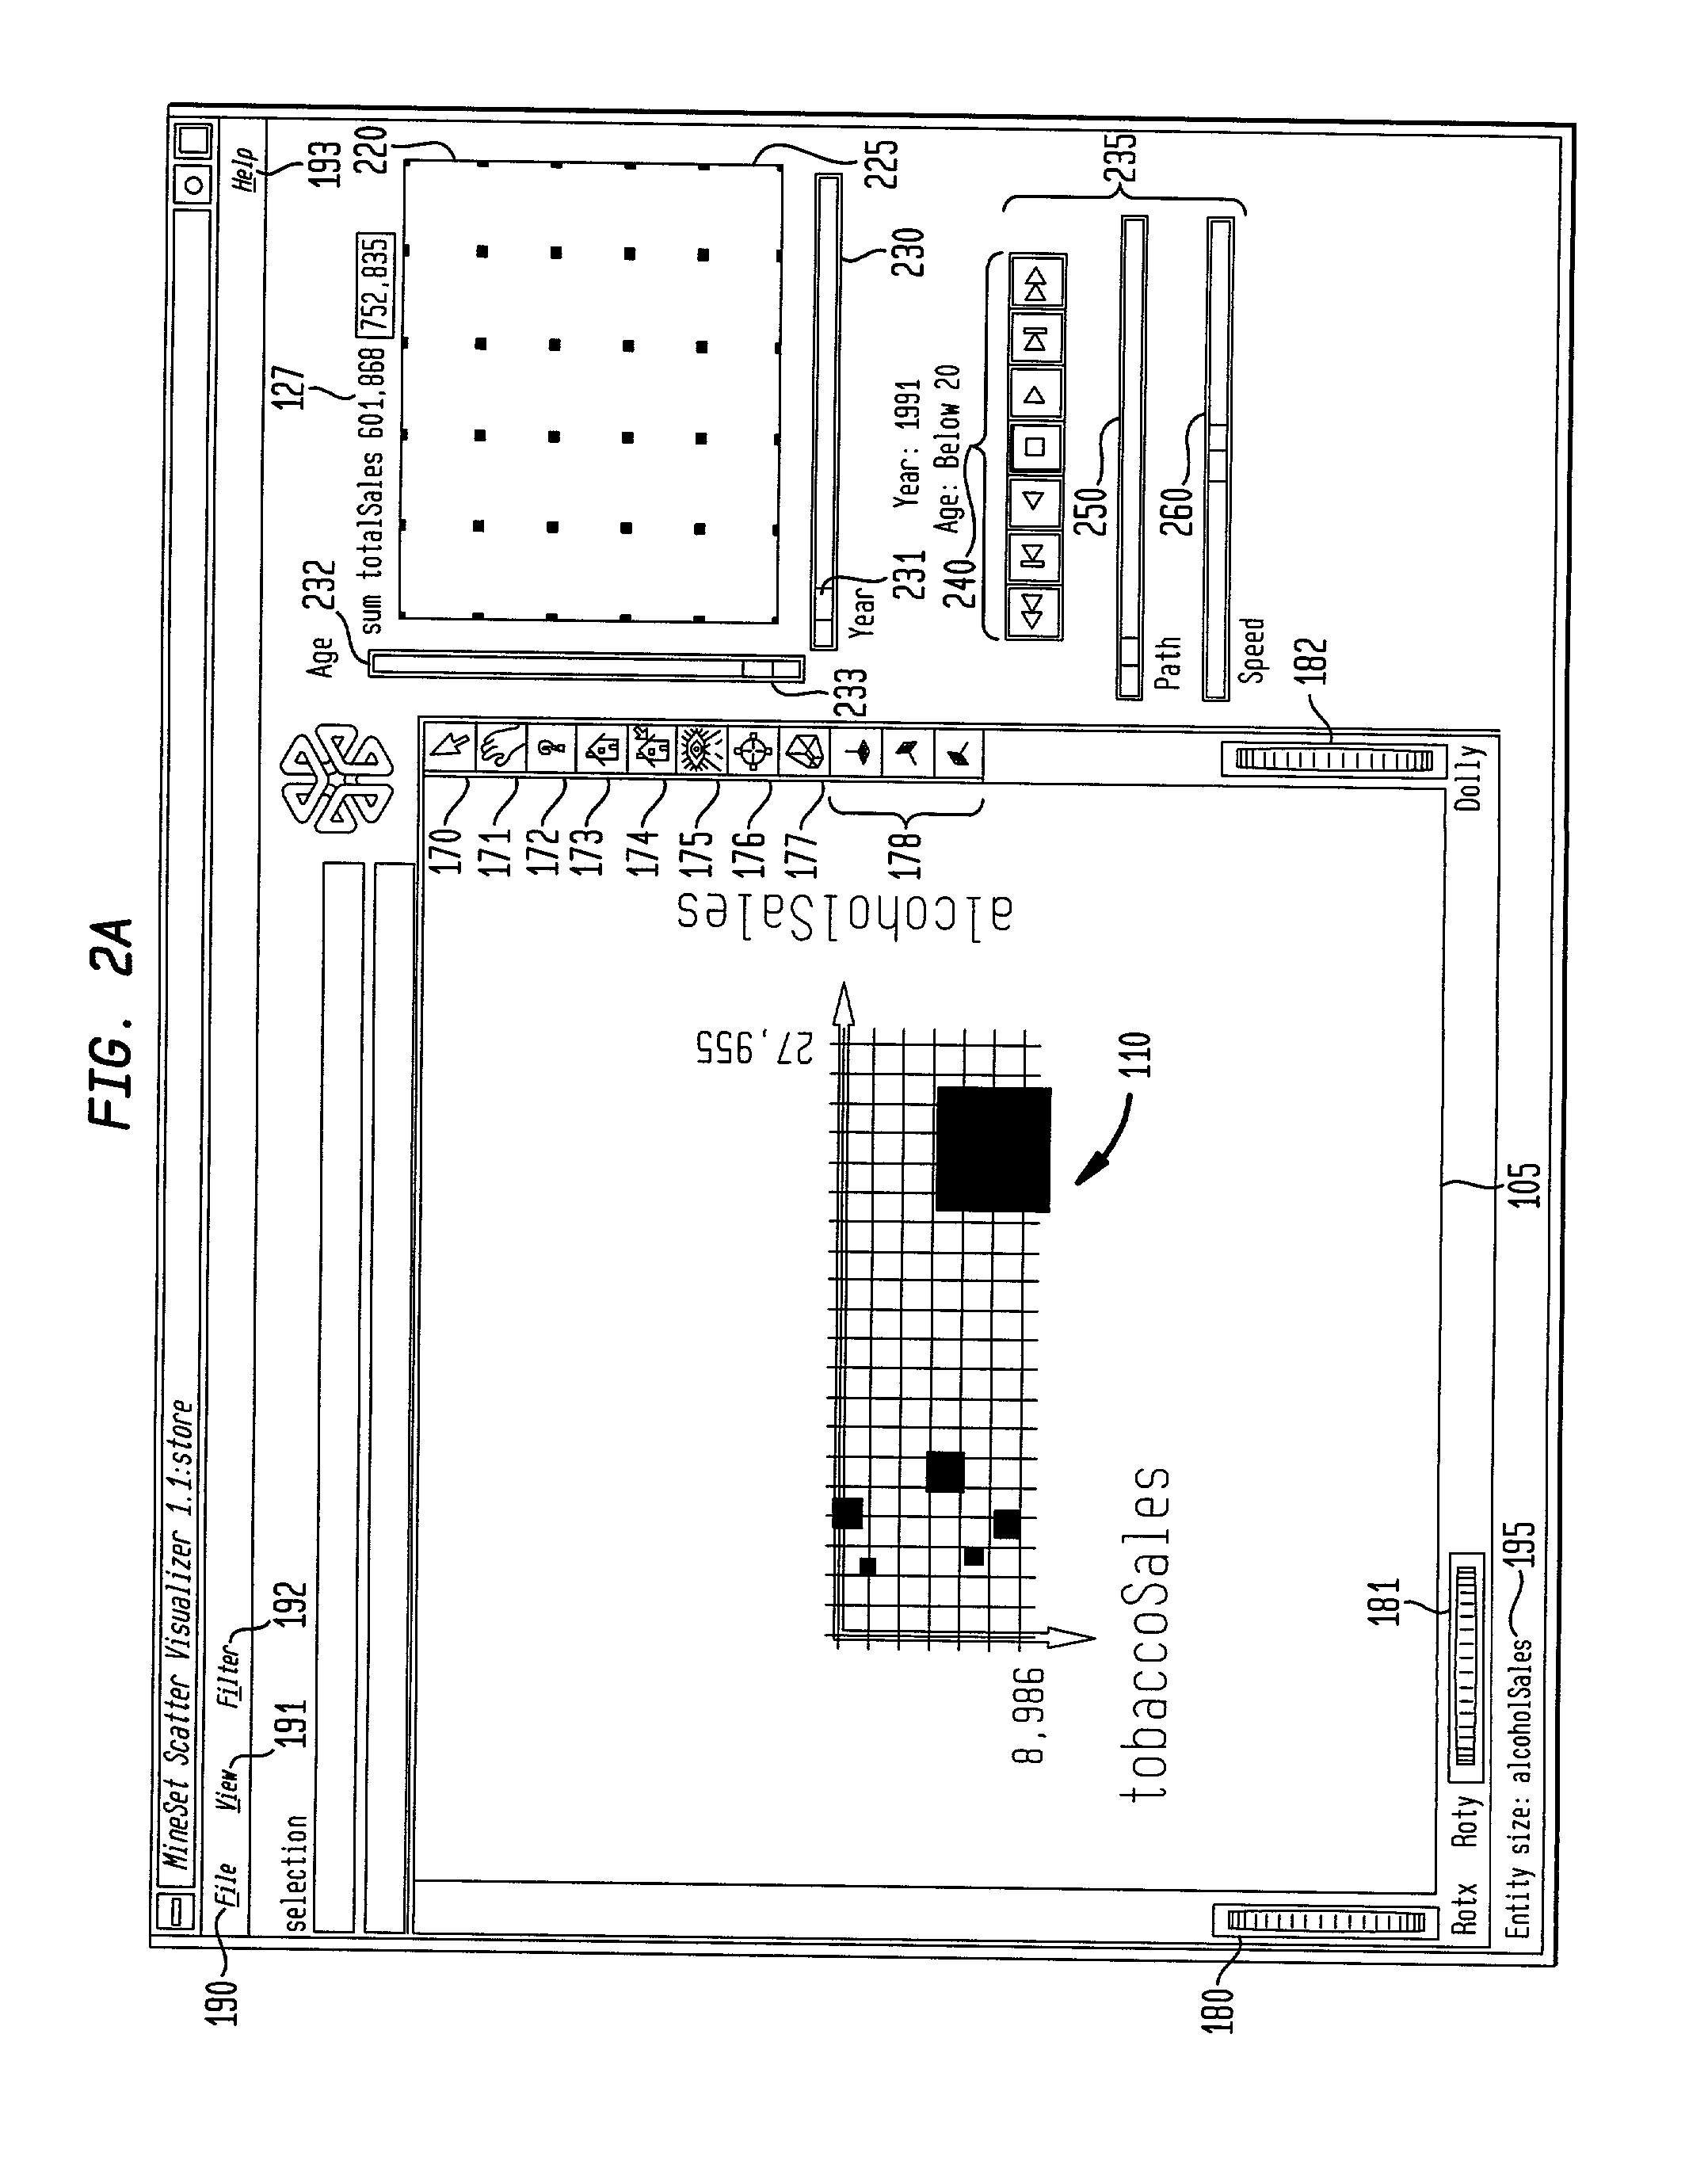
[0033] The present invention is directed to a data visualization tool for controlling or varying data visualization in at least one external dimension that allows better querying and navigation of data in external dimension space. Summary information highlighting how data varies with respect to one or more external dimensions is provided in a summary window to guide data queries and navigation. An ability to query and navigate data across one or more external dimensions in a simultaneous and independent manner is achieved. With this summary window, a user can preview data highlights in external dimension space prior to and before a data visualization is formed. A user can better target data queries and navigation paths through the summary window. During animation the user is free to focus on changes in the data visualization across external dimension space. An animation control panel provides flexible control of animation along a navigation path.

[0...


PUM


Abstract

A computer graphics display method and system for controlling data visualization in at least one external dimension is provided which allows better querying and navigation of data in external dimension space. A data visualization is displayed in a first display window. A summary window provides summary information on data for the data visualization across one or more external dimensions. First and second controllers are displayed for controlling the variation of the data visualization in respective first and second external dimensions. A user queries the data visualization in the first and second external dimensions by selecting a point in the summary window. A user navigates through the data visualization in the first and second external dimensions by defining a path in the summary window. Grid points are also displayed in the summary window to facilitate data queries and navigation based on actual data points. The first and second controllers can be first and second sliders, such as, slide buttons, dials, or any other type of input. An animation control panel, including tape-drive controls, a path control, and a speed control, controls an animation of the data visualization over a selected navigation path through external dimension space.

Description

[0001] 1. Field of the Invention[0002] The present invention relates generally to computer graphics display, and more specifically to a graphics display tool for controlling data visualization.[0003] 2. Related Art[0004] Computer graphics display systems have long been used to visualize data. Depending upon the type of data involved, a data visualization is displayed to identify data content, characteristics, properties, relationships, trends, and any other aspect of the data. For example, business and scientific data is often visualized through charts, graphs, histograms, and figures. Virtual reality (VR) data visualizations represent data using display models, such as, information landscapes, hierarchies, cones, walls, and trees.[0005] A data visualization, however, represents a snapshot of data that is fixed with respect to external dimension(s) not represented in the data visualization itself. For example, consider a company's annual sales data reported in a simple bar chart. A ...

Claims


Application Information

Patent Timeline
Patent Type & Authority Applications(United States)
IPC IPC(8): G06F3/033G06F3/048G06F17/30
CPCG06F3/0481G06F3/04845G06F17/30973G06F2203/04806G06F16/90328
Inventor SANG'UDI, GERALD P.BOTT, ROSS A.TESLER, JOEL D.HAWKES, JOHN R.XIONG, REBECCA W.SCHKOLNICK, MARIO
Owner RPX CORP
Why Eureka
Try Eureka