1. Equation 1.0 needs to be correctly specified. If the Equation is not correctly specified, then errors and distortions occur can occur. An incorrect specification contributes to
curve fitting problem 2, discussed next.
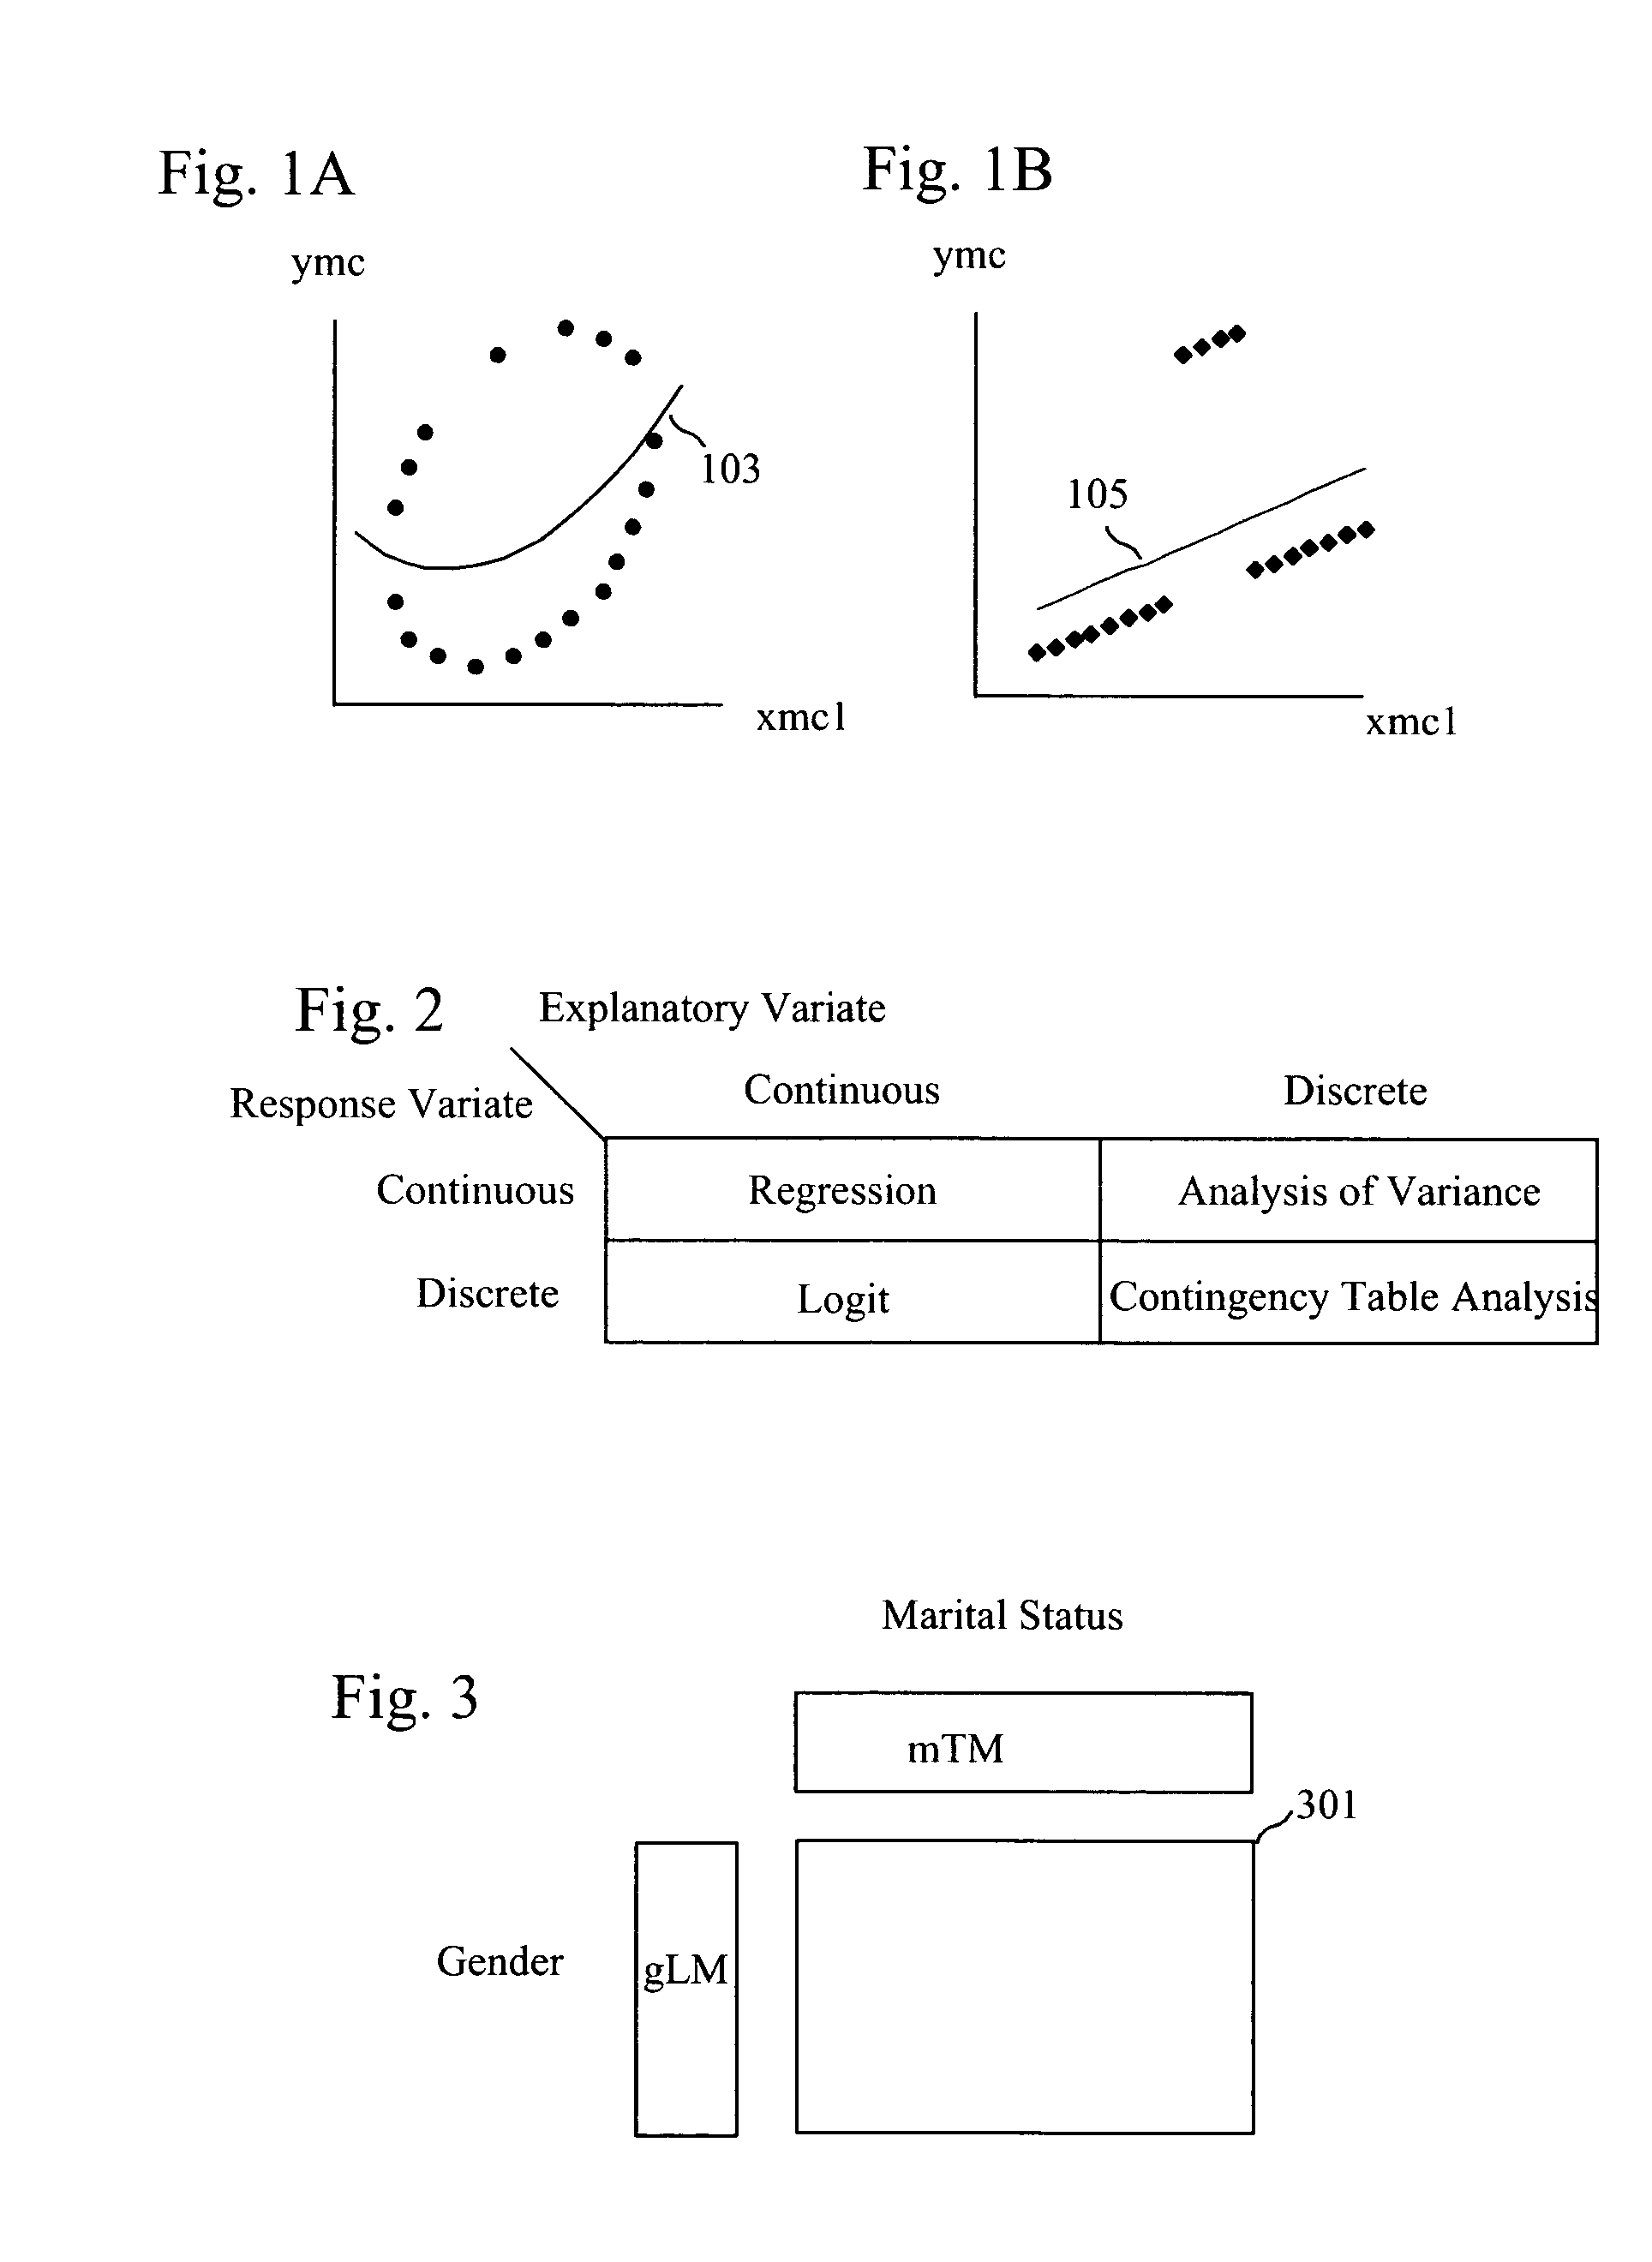
2. There is an assumption that for each combination of specific xmc.sub.1, xmc.sub.2, xmc.sub.3, . . . values, there is a unique ymc value and that non-unique ymc values occur only because of errors. Consequently, for example, applying quadric
curve fitting to the nineteen points that clearly form an
ellipse-like pattern in FIG. 1A yields a curve like Curve 103, which straddles both high and low ymc values. The fitting ignores that for all xmc.sub.1 values, multiple ymc values occur.
3. There is a loss of information. This is the converse of MCFP #2 and is shown in FIG. 1B. Though Curve (Line) 105 approximates the data reasonably well, some of the character of the data is lost by focusing on the Curve rather than the
raw data points.
4. There is the well-known
Curse of Dimensionality. As the number of explanatory variates increases, the number of possible functional forms for Equation 1.0 increases exponentially, ever-larger
empirical data sets are needed, and accurately determining coefficients can become impossible. As a result, one is frequently forced to use only first-order linearfmc functional forms, but at a cost of ignoring possibly important non-linear relationships.
5. There is the assumption that fitting Equation 1.0 and minimizing deviations represents what is important. Stated in reverse, Equation 1.0 and minimizing deviations can be overly abstracted from a practical problem. Though prima facie minimizing deviations makes sense, the deviations in themselves are not necessarily correlated nor linked with the costs and benefits of using a properly or improperly fitted curve.
As a consequence, most statistical techniques, to some degree, are plagued by the above five MCFPs.
1. The difference between statistical and practical significance. A result that is statistically significant can be practically insignificant. And conversely, a result that is statistically insignificant can be practically significant.
2. The normal distribution assumption. In
spite of the Central Limit Theorem,
empirical data is frequently not normally distributed, as is particularly the case with financial transactions data regarding publicly-traded securities. Further, for the normal distribution assumption to be applicable, frequently large--and thus costly--sample sizes are required.
3. The intervening structure between data and people. Arguably, a purpose of
statistical analysis is to refine disparate data into forms that can be more easily comprehended and used. But such refinement has a cost: loss of information.
One problem that becomes immediately apparent by a consideration of FIG. 2 is the lack of unification.
A particular problem, moreover, with
regression analysis is the assumption that explanatory variates are known with certainty.
Another problem with
Regression Analysis is deciding between different formulations of Equation 1.0: accuracy in both estimated coefficients and significance tests requires that Equation 1.0 be correct.
An integral-calculus version of the G2 Formula (explained below) is sometimes used to select the
best fitting formulation of Equation 1.0 (a.k.a. the
model selection problem), but does so at a cost of undermining the legitimacy of the significance tests.
However, such techniques fail to represent all the lost information.
However, the resulting statistical significances are of questionable validity.
Further,
Logit requires a questionable variate transform, which can result in inaccurate estimates when probabilities are particularly extreme.
Analysis-of-Variance (and variates such as Analysis-of-
Covariance) is plagued by many of the problems mentioned above.
The first issue is significance testing.
The main problem with using both Chi Square and G2 for significance testing is that both require sizeable
cell counts.
As the space and
time complexity of this procedure [IPFP] is exponential, it is no wonder that existing programs cannot be applied to problems of more than 8 or 9 dimensions.
However, their techniques become increasingly cumbersome and less worthwhile as the number of dimensions increases.
These strategies, however, are predicated upon finding redundant, isolated, and independent dimensions.
As the number of dimensions increases, this becomes increasingly difficult and unlikely.
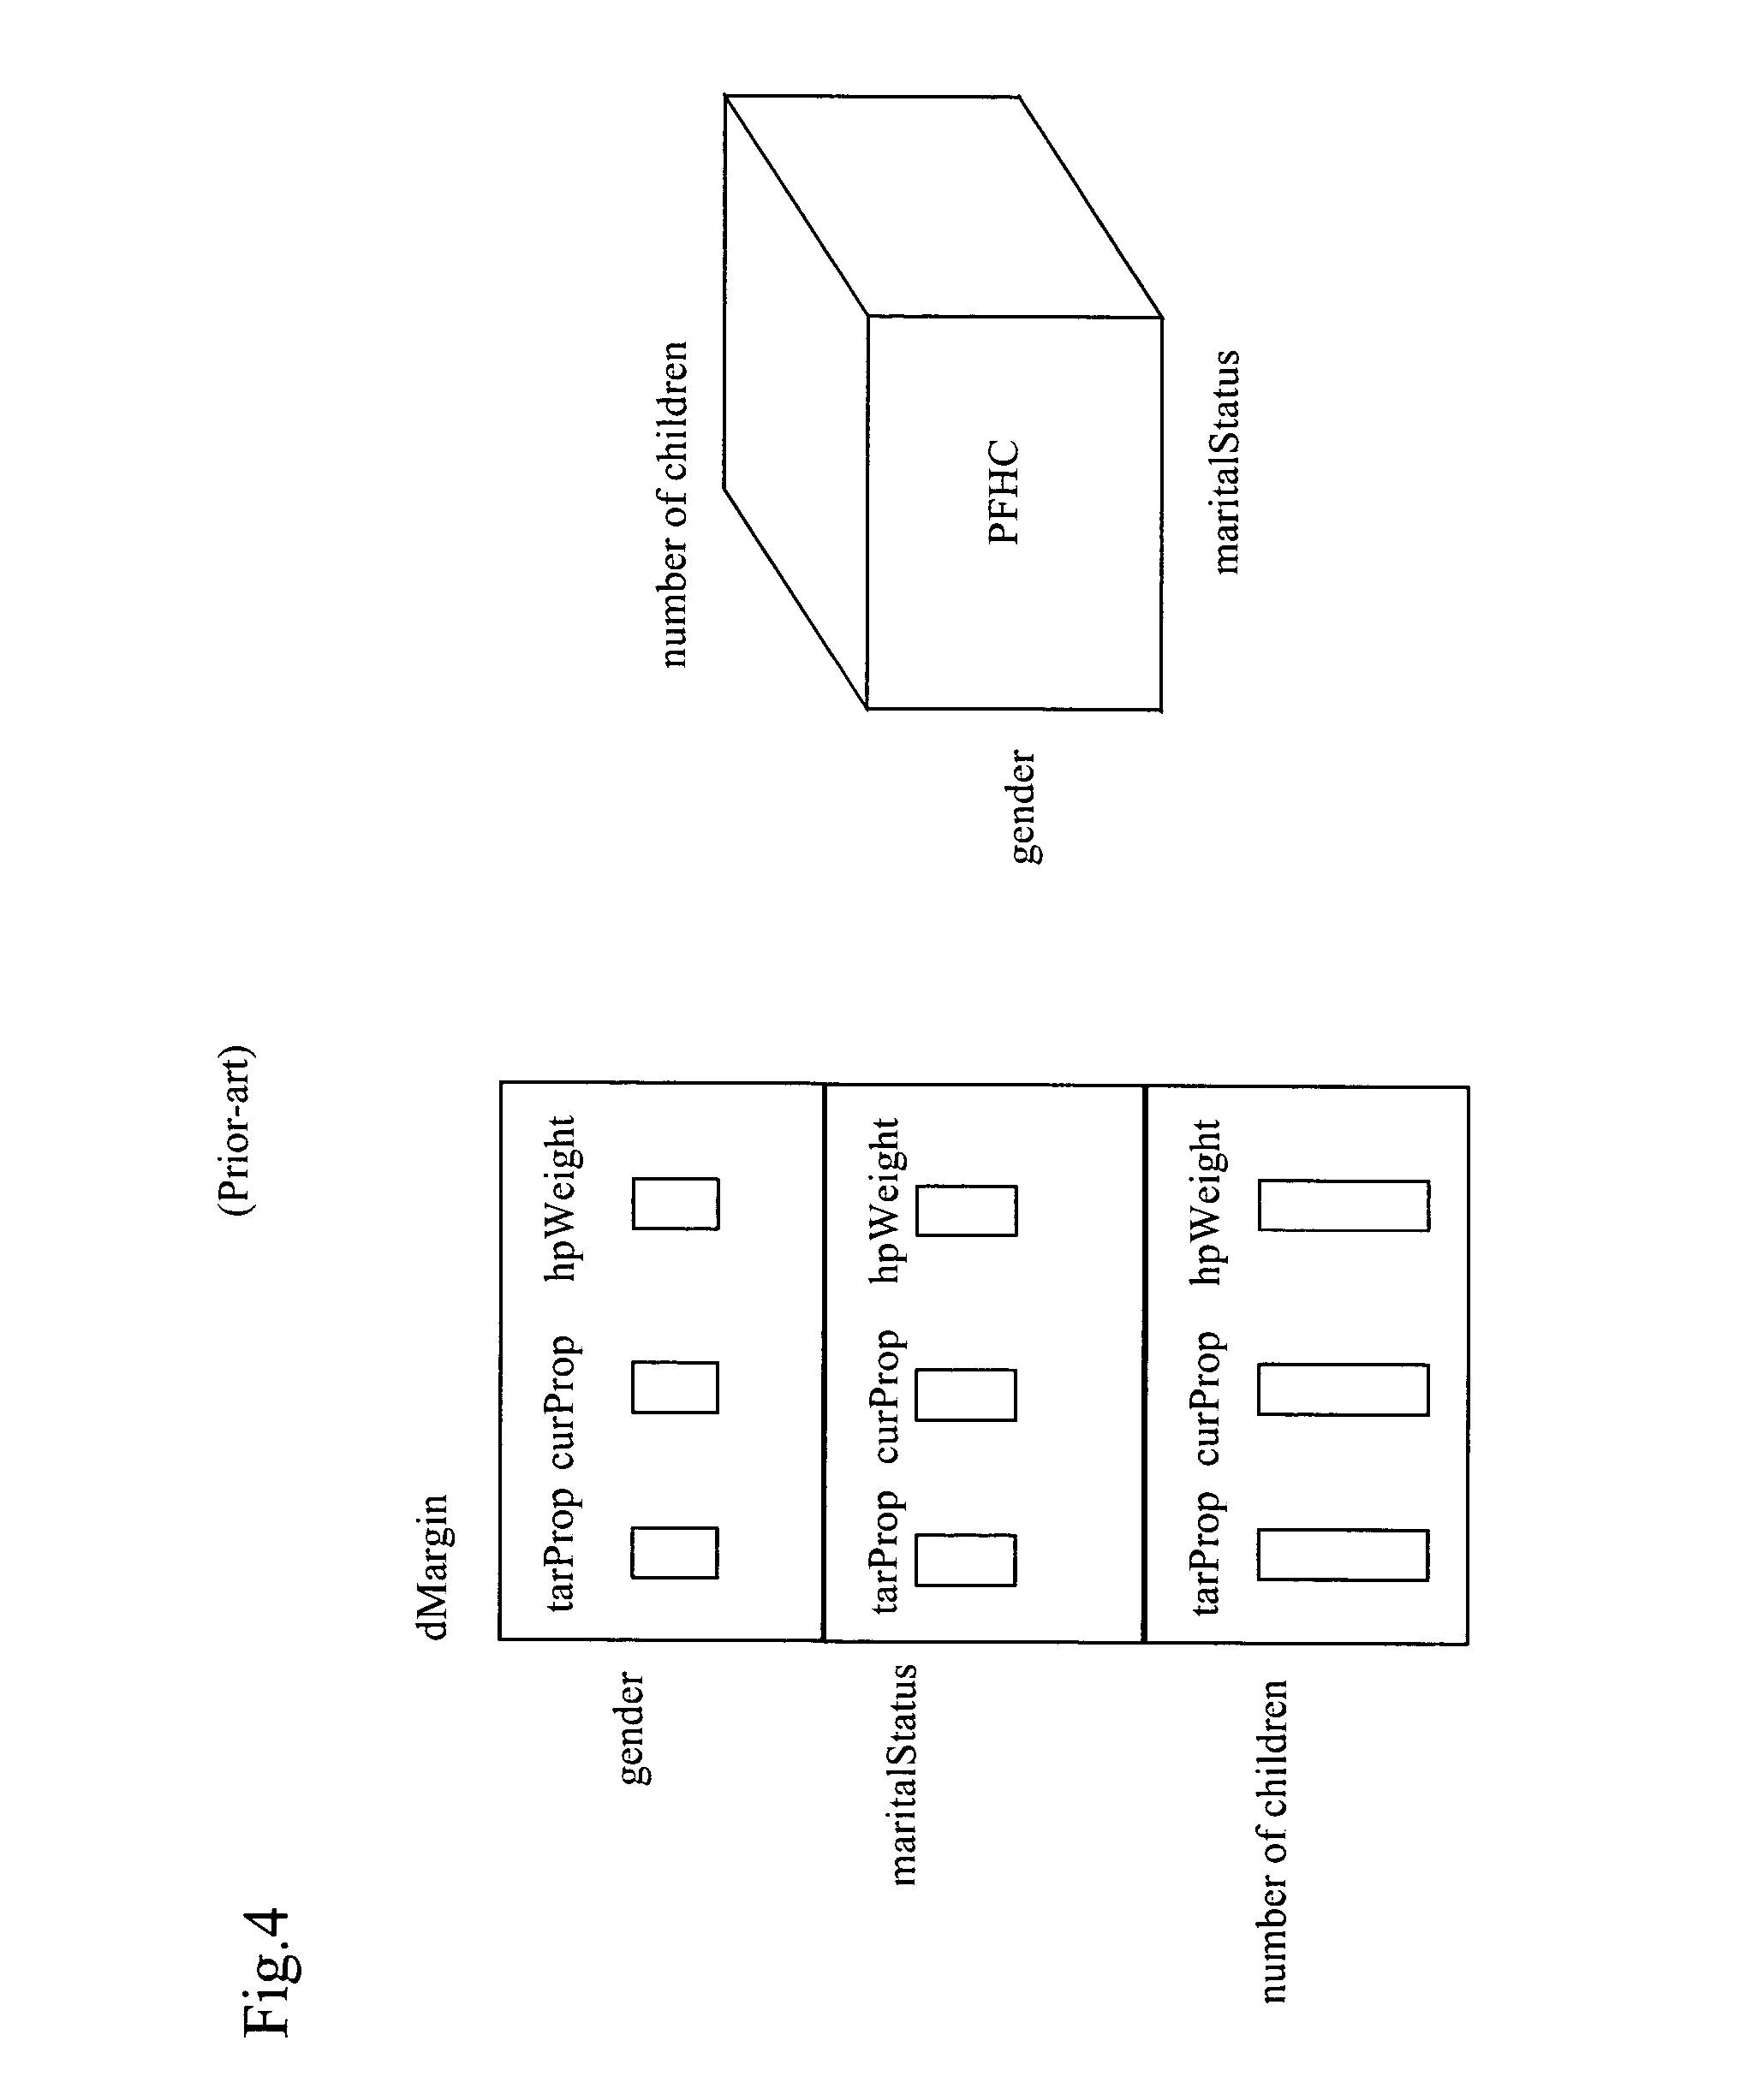
Besides memory and CPU requirements, another major problem with the IPFP is that specified target marginals (tarProp) and
cell counts must be jointly consistent, because otherwise, the IPFP will fail to converge.
The final problem with the IPFP is that it does not suggest which variates or dimensions to use for weighting.
In conclusion, though some strategies have been developed to improve the IPFP, requirements for
computer memory,
CPU time, and internal consistency are major limitations.
1. To posit a prior distribution requires extensive and intimate knowledge of many applicable probabilities and conditional probabilities that accurately characterize the case at hand.
2. Computation of posterior distributions based upon prior distributions and new data can quickly become mathematically and computationally intractable, if not impossible.
There are two problems with this approach.
First it is very sensitive to training data.
Second, once a network has been trained, its logic is incomprehensible.
1. Unable to
handle incomplete xCS data when performing a classification.
2. Requires a varying sequence of data that is dependent upon xCS particulars.
3. Easily overwhelmed by sharpness-of-split, whereby a tiny change in xCS can result is a drastically different yCS.
4. Yields single certain classifications, as opposed to multiple probabilistic classifications.
5. Lack of a statistical test.
6. Lack of an aggregate valuation of explaintory variates.
1. The identified points (xCSData) are each considered equally likely to be the nearest neighbor. (One could weight the points depending on the distance from xCS, but such
a weighting is somewhat arbitrary.)
2. The identified points (xCSData) may be from an outdated
database. Massive updating of the
database is likely very expensive--but so are inaccurate estimates of yCS.
1. Because they may impose structure and relationships between linked variates, the relationship between two distantly linked variates may be distorted by errors that accumulate over the distance. In other words, using two fitted curves in succession: one curve that models the relationship between xCS and qCS, and another that models the relationship between qCS and yCS, is far less accurate than using a fitted-curve that models the relationship between xCS and yCS directly.
2. Because of the physical 3-D limitations of the world, Graphic models have severe limitations on how much they can show: Frequently, each node / variate is allowed only two states, and there are serious limitations on showing all possible
nodal connections.
3. Because they employ the above statistical and mathematical
curve fitting techniques, they suffer from the deficiencies of those techniques.
Because expert systems employ the above techniques, they too suffer from the deficiencies of those techniques.
More importantly, however, is the high cost and extensive professional effort required to build and update an
expert system.
However, much of the time, using such data is not done because of conceptual and practical difficulties.
One could use the above techniques to create sample /
scenario data, but the resulting data can be inaccurate, primarily from loss of information, MCFP #3.
Such a loss of information undermines the very purpose of both computer simulations and computerized-
scenario optimizations: addressing the multitude of possibilities that could occur.
1. Insurance is perhaps the oldest and most common means for trading risk. An insurance company assumes individual policy-holder risks, covers risks by
pooling, and makes money in the process. To do so, insurance companies offer policies only if a market is sufficiently large, only if there is a reasonable basis for estimating probabilities, and only if concrete damages or losses are objectively quantifiable.
2. Owners of publicly-traded financial instruments trade with one another in order to diversify and share risks. However, each financial instrument is a bundle of risks that cannot be traded. So, for example, the shareholder of a
conglomerate holds the joint risk of all the
conglomerate's subsidiaries. Owners of closely-held corporations and owners (including corporations) of non-publicly-traded assets usually cannot trade risks, other than by insurance as described above. Arguably, the risks associated with most assets in the world cannot be traded.
3. Long-term contracts between entities are made in order to reduce mutual uncertainty and risk. However, long-term contracts require negotiation between, and agreement of, at least two entities. Such negotiations and agreements can be difficult. (Public futures and forward markets, along with some private markets, attempt to facilitate such agreements, but can address only an infinitesimal portion of the need.) An example of long-term contracts negotiation would be artichoke farming. Focusing on a
small town with several artichoke farmers, some farmers might think that the market for artichokes will shrink, while others might think that it will grow. Each farmer will make and execute their own decisions but be forced to live the by the complete consequences of these decisions since, given present-day technology, they lack a means of
risk sharing.
4. Derivatives can be bought and sold to trade risk regarding an underlying financial asset. Derivatives, however, are generally applicable only if there is an underlying asset. (The Black-Scholes formula for option pricing, which is arguably the basis for all derivative pricing, requires the existence of an underlying asset.) They further have problems with
granularity, necessitating complex multiple trades. Their use in a financial
engineering context requires specialized expertise.
5. The Iowa
Electronic Markets and U.S. Pat. No. 6,321,212, issued to Jeffrey Lange and assigned to
Longitude Inc., offer means of risk trading that entail contingent payoffs based upon which bin of a statistical distribution manifests. These means of trading risk entail a "winner-take-all" orientation, with the result that traders are unable to fully maximize their individual utilities.
All-in-all, trading risk is a complex endeavor, in itself has risk, and can be done only on a limited basis.
As a result of this, coupled with people's natural risk-aversion, the economy does not function as well as it might.
1. Financial portfolio managers and traders of financial instruments seldom use mathematical optimization. Perhaps this is the result of a gap between humans and mathematical optimization: the insights of humans cannot be readily communicated as input to a mathematical optimization process. Clearly, however, it would be desirable to somehow combine both approaches to obtain the best of both.
2. Within investment banks in particular, and many other places in general, employees need to make forecasts. Such forecasts need to be evaluated, and accurate Forecasters rewarded. How to structure an optimal evaluation and
reward system is not known. The one problem, of course, is the Agency Theory problem as defined by economic theory: Forecasters are apt to make forecasts that are in their private interest and not necessarily in the interests of those who rely on the forecast.
3. Within
medicine, treatment approval by the FDA is a long and arduous process, and even so, sometimes once a treatment is approved and widely used, previously unknown side-effects appear. But on the other hand, people wish to experiment with treatments.
Medicine, itself, is becoming ever more complex and a shift towards individually tailored
drug programs is beginning. The net result is ever more uncertainty and
confusion regarding treatments. Hence, a need for custom guidance regarding treatments.
In conclusion, though innumerable methods have been developed to quantitatively identify correlative relationships and trade risk, they all have deficiencies.

