Compositions and methods for diagnosing and treating cancers
- Summary
- Abstract
- Description
- Claims
- Application Information
AI Technical Summary
Benefits of technology
Problems solved by technology
Method used
Image
Examples
example 1
Microarray and Statistical Analysis of Gene Expression Data
[0279] A combination of research tools, including oligonucleotide microarrays available from Affymetrix Inc. (Santa Clara, Calif.) and databases of biological information available from Gene Logic Inc. (Gaithersburg, Md.), were used for the statistical analysis of gene expression data.
[0280] Affymetrix oligonucleotide microarrays (commercially labeled GeneChips®) are widely used to measure the abundance of mRNA molecules in biological samples. Microarrays provide a method for the simultaneous monitoring of the expression levels of many genes in parallel. Because the oligonucleotide probes for each gene are selected and synthesized at specific locations on the array, the hybridization patterns and intensities provide direct indications of the gene identity and relative amount without the need for additional experimentation.
[0281] Matrices and algorithms are used to generate meaningful information from the intensity data ob...
example 2
E-Northern and Global Analysis
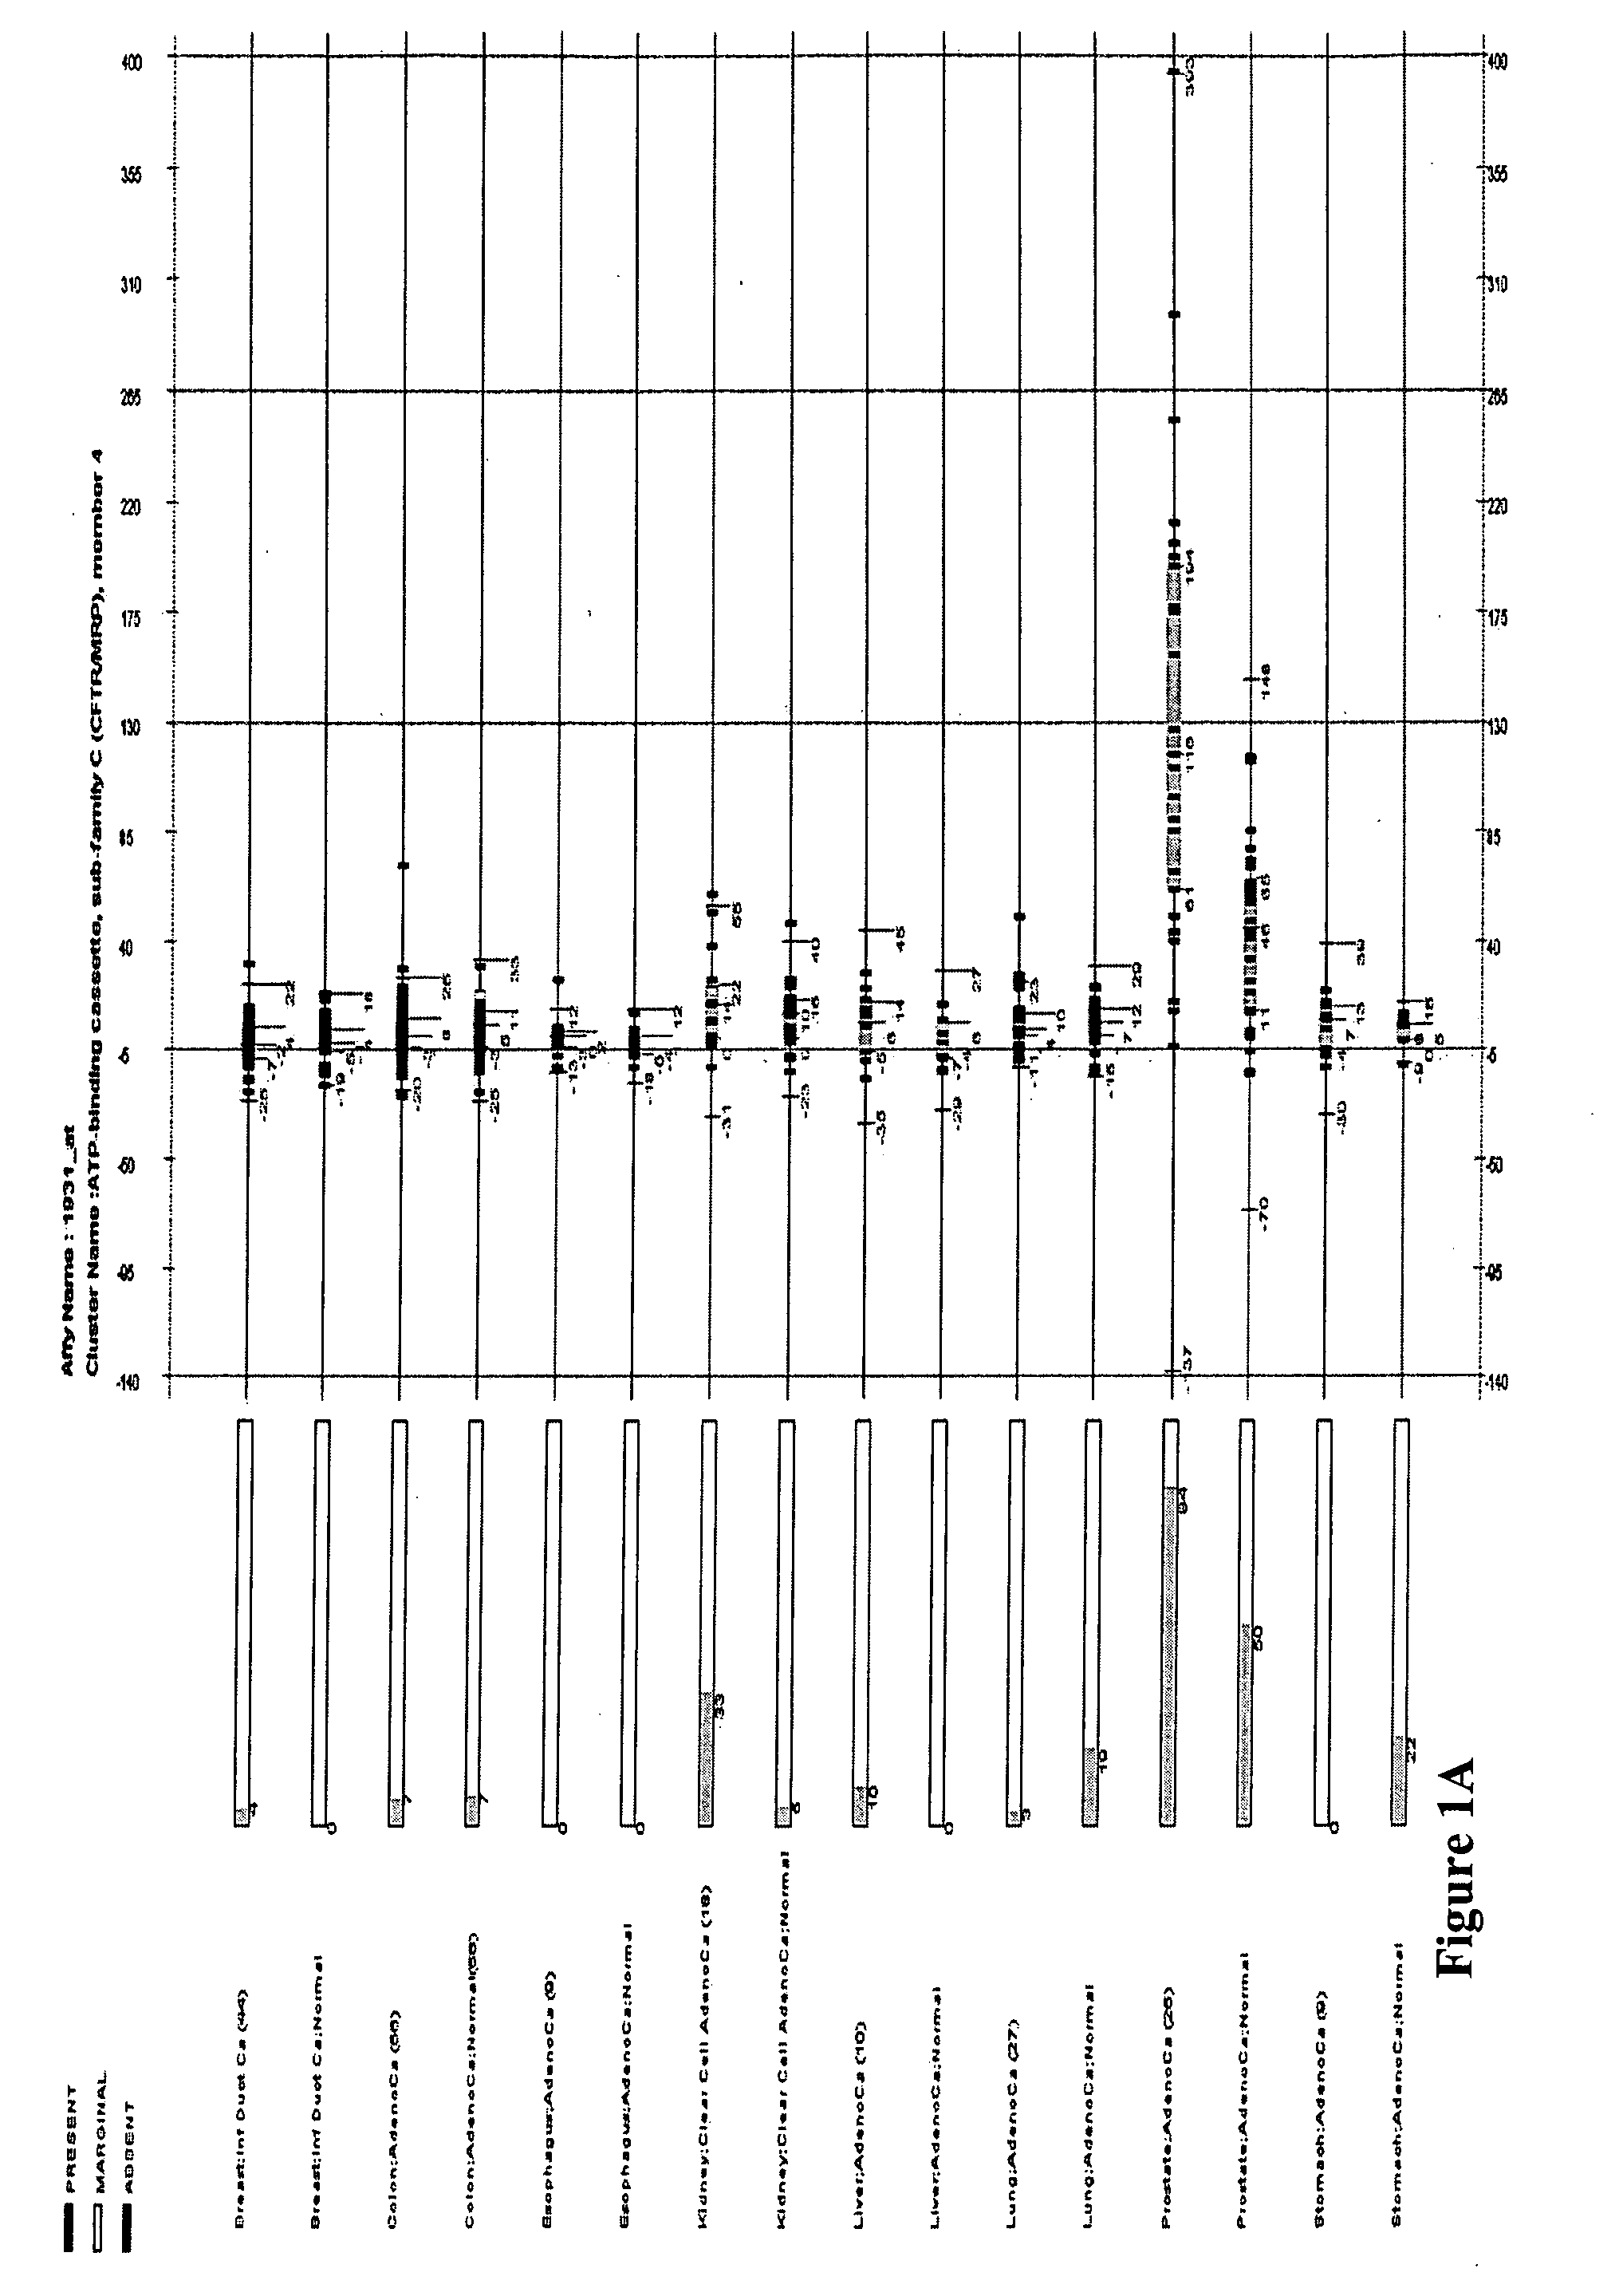
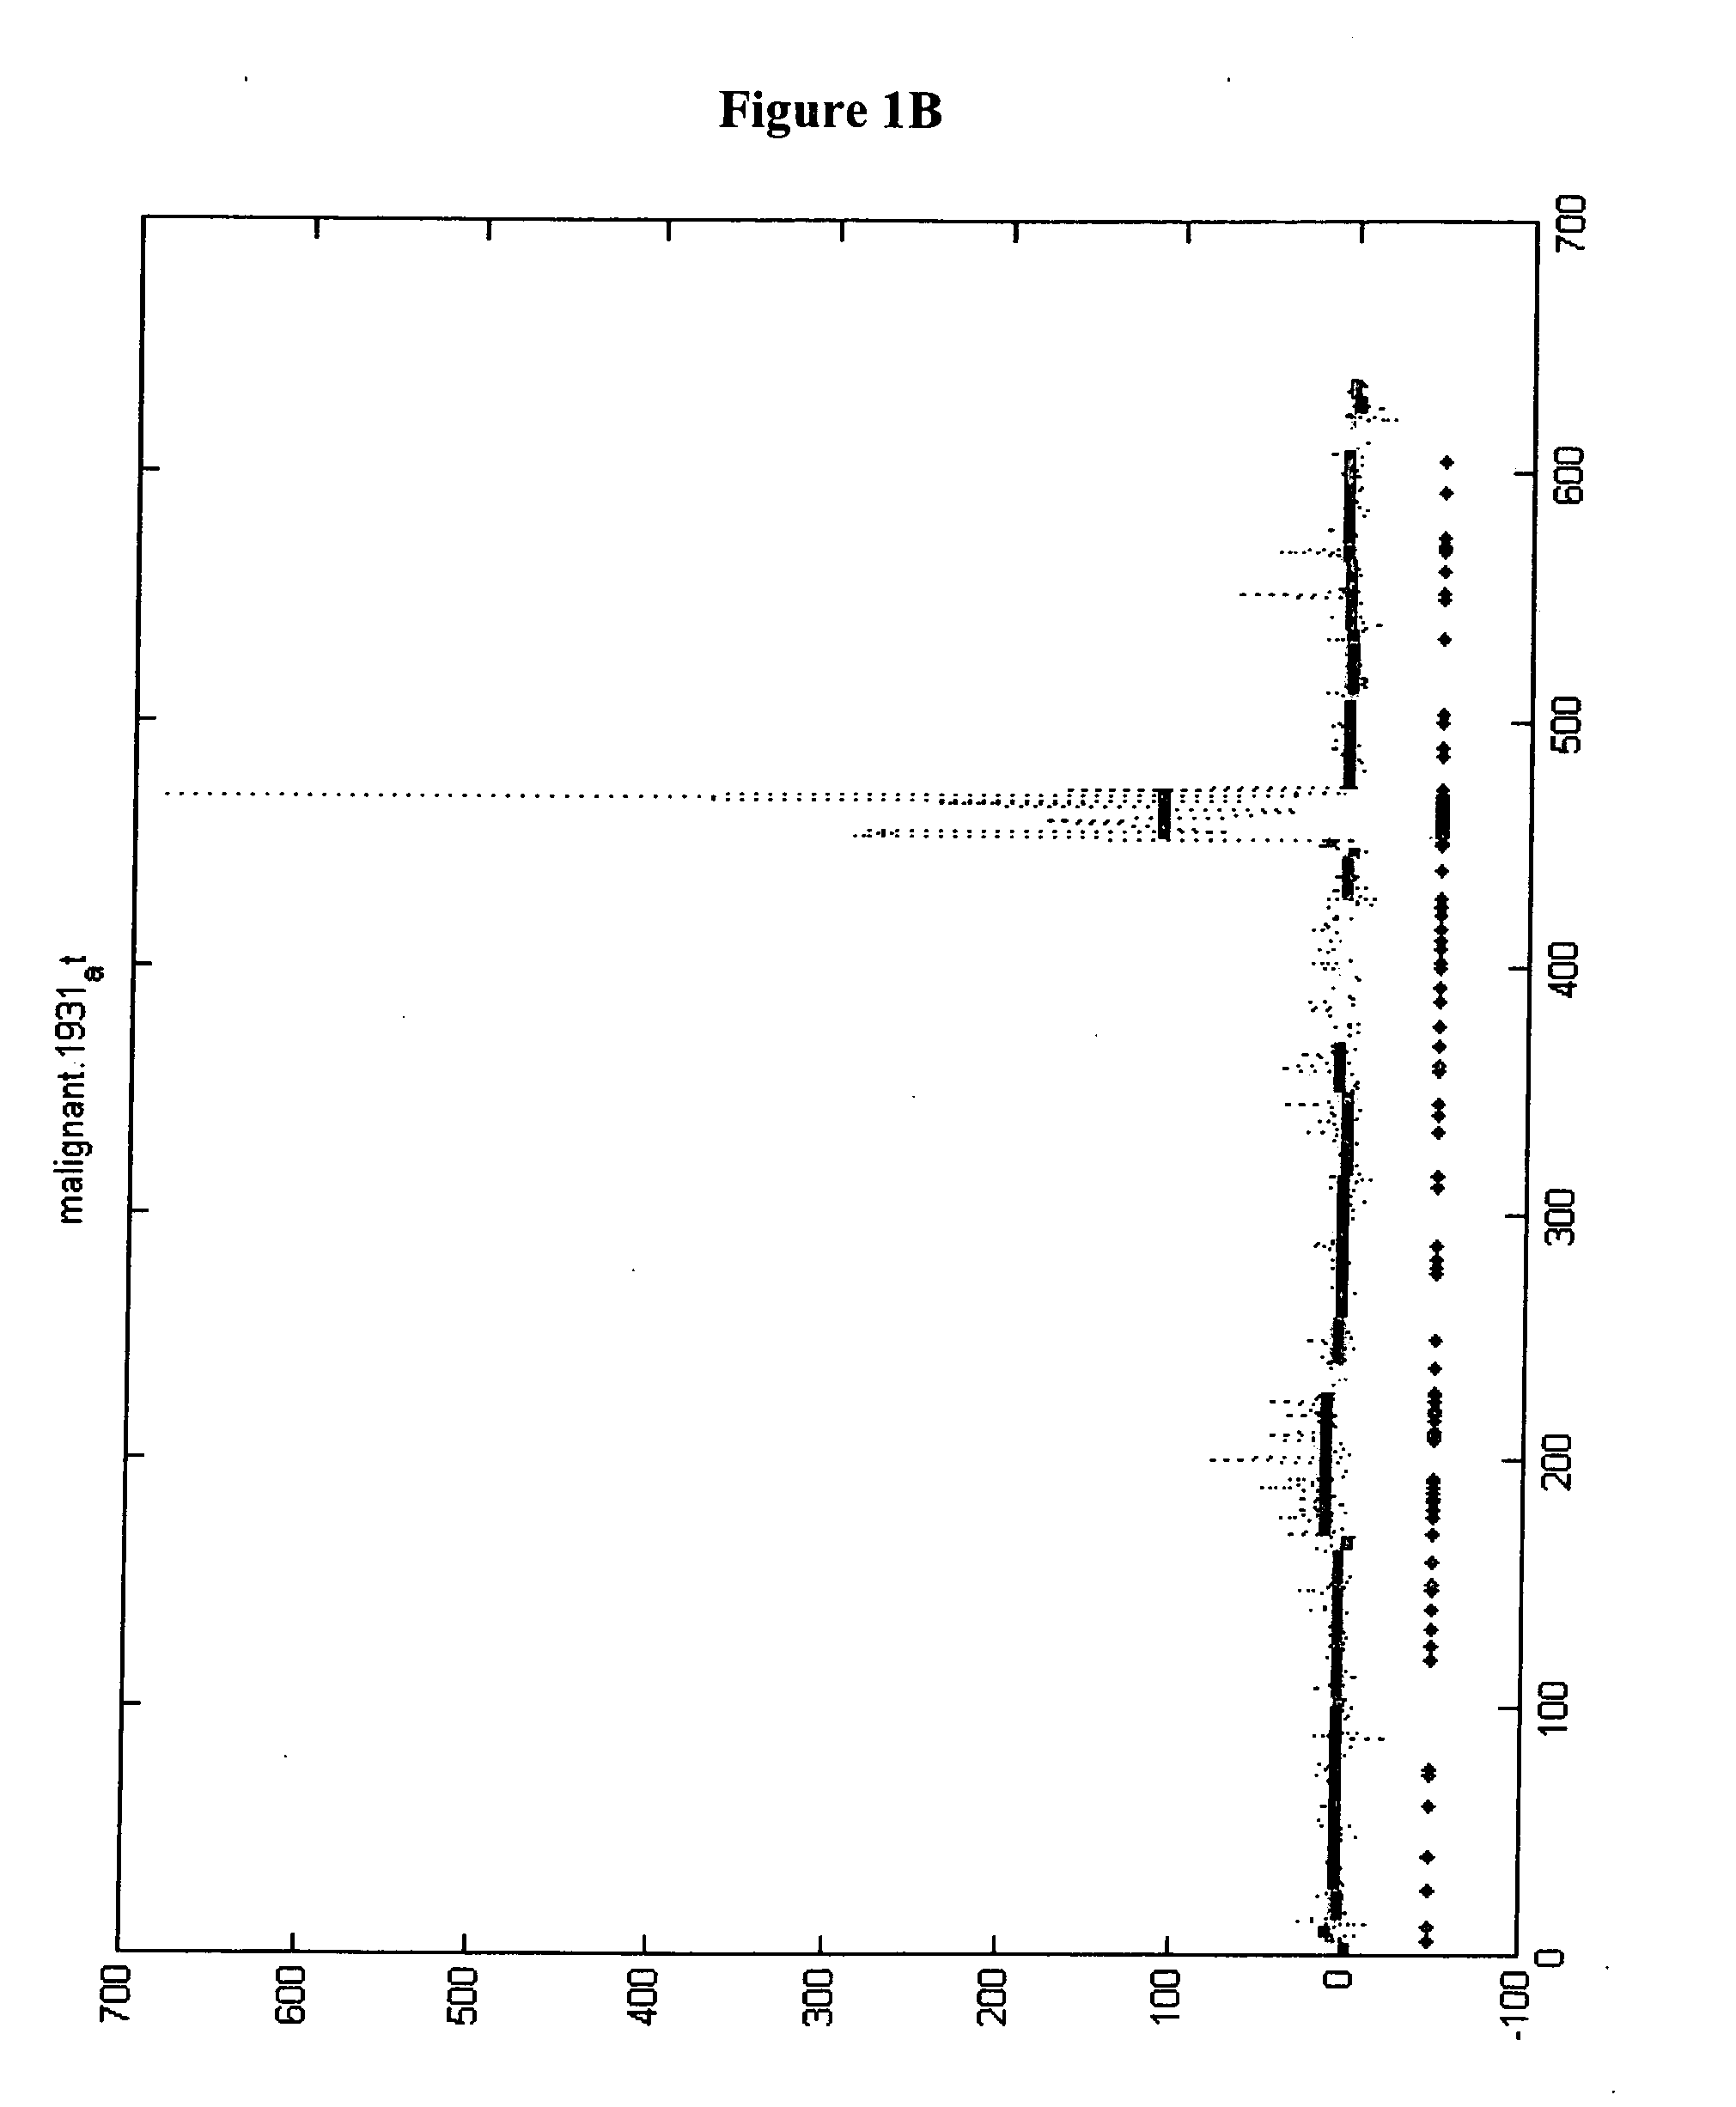
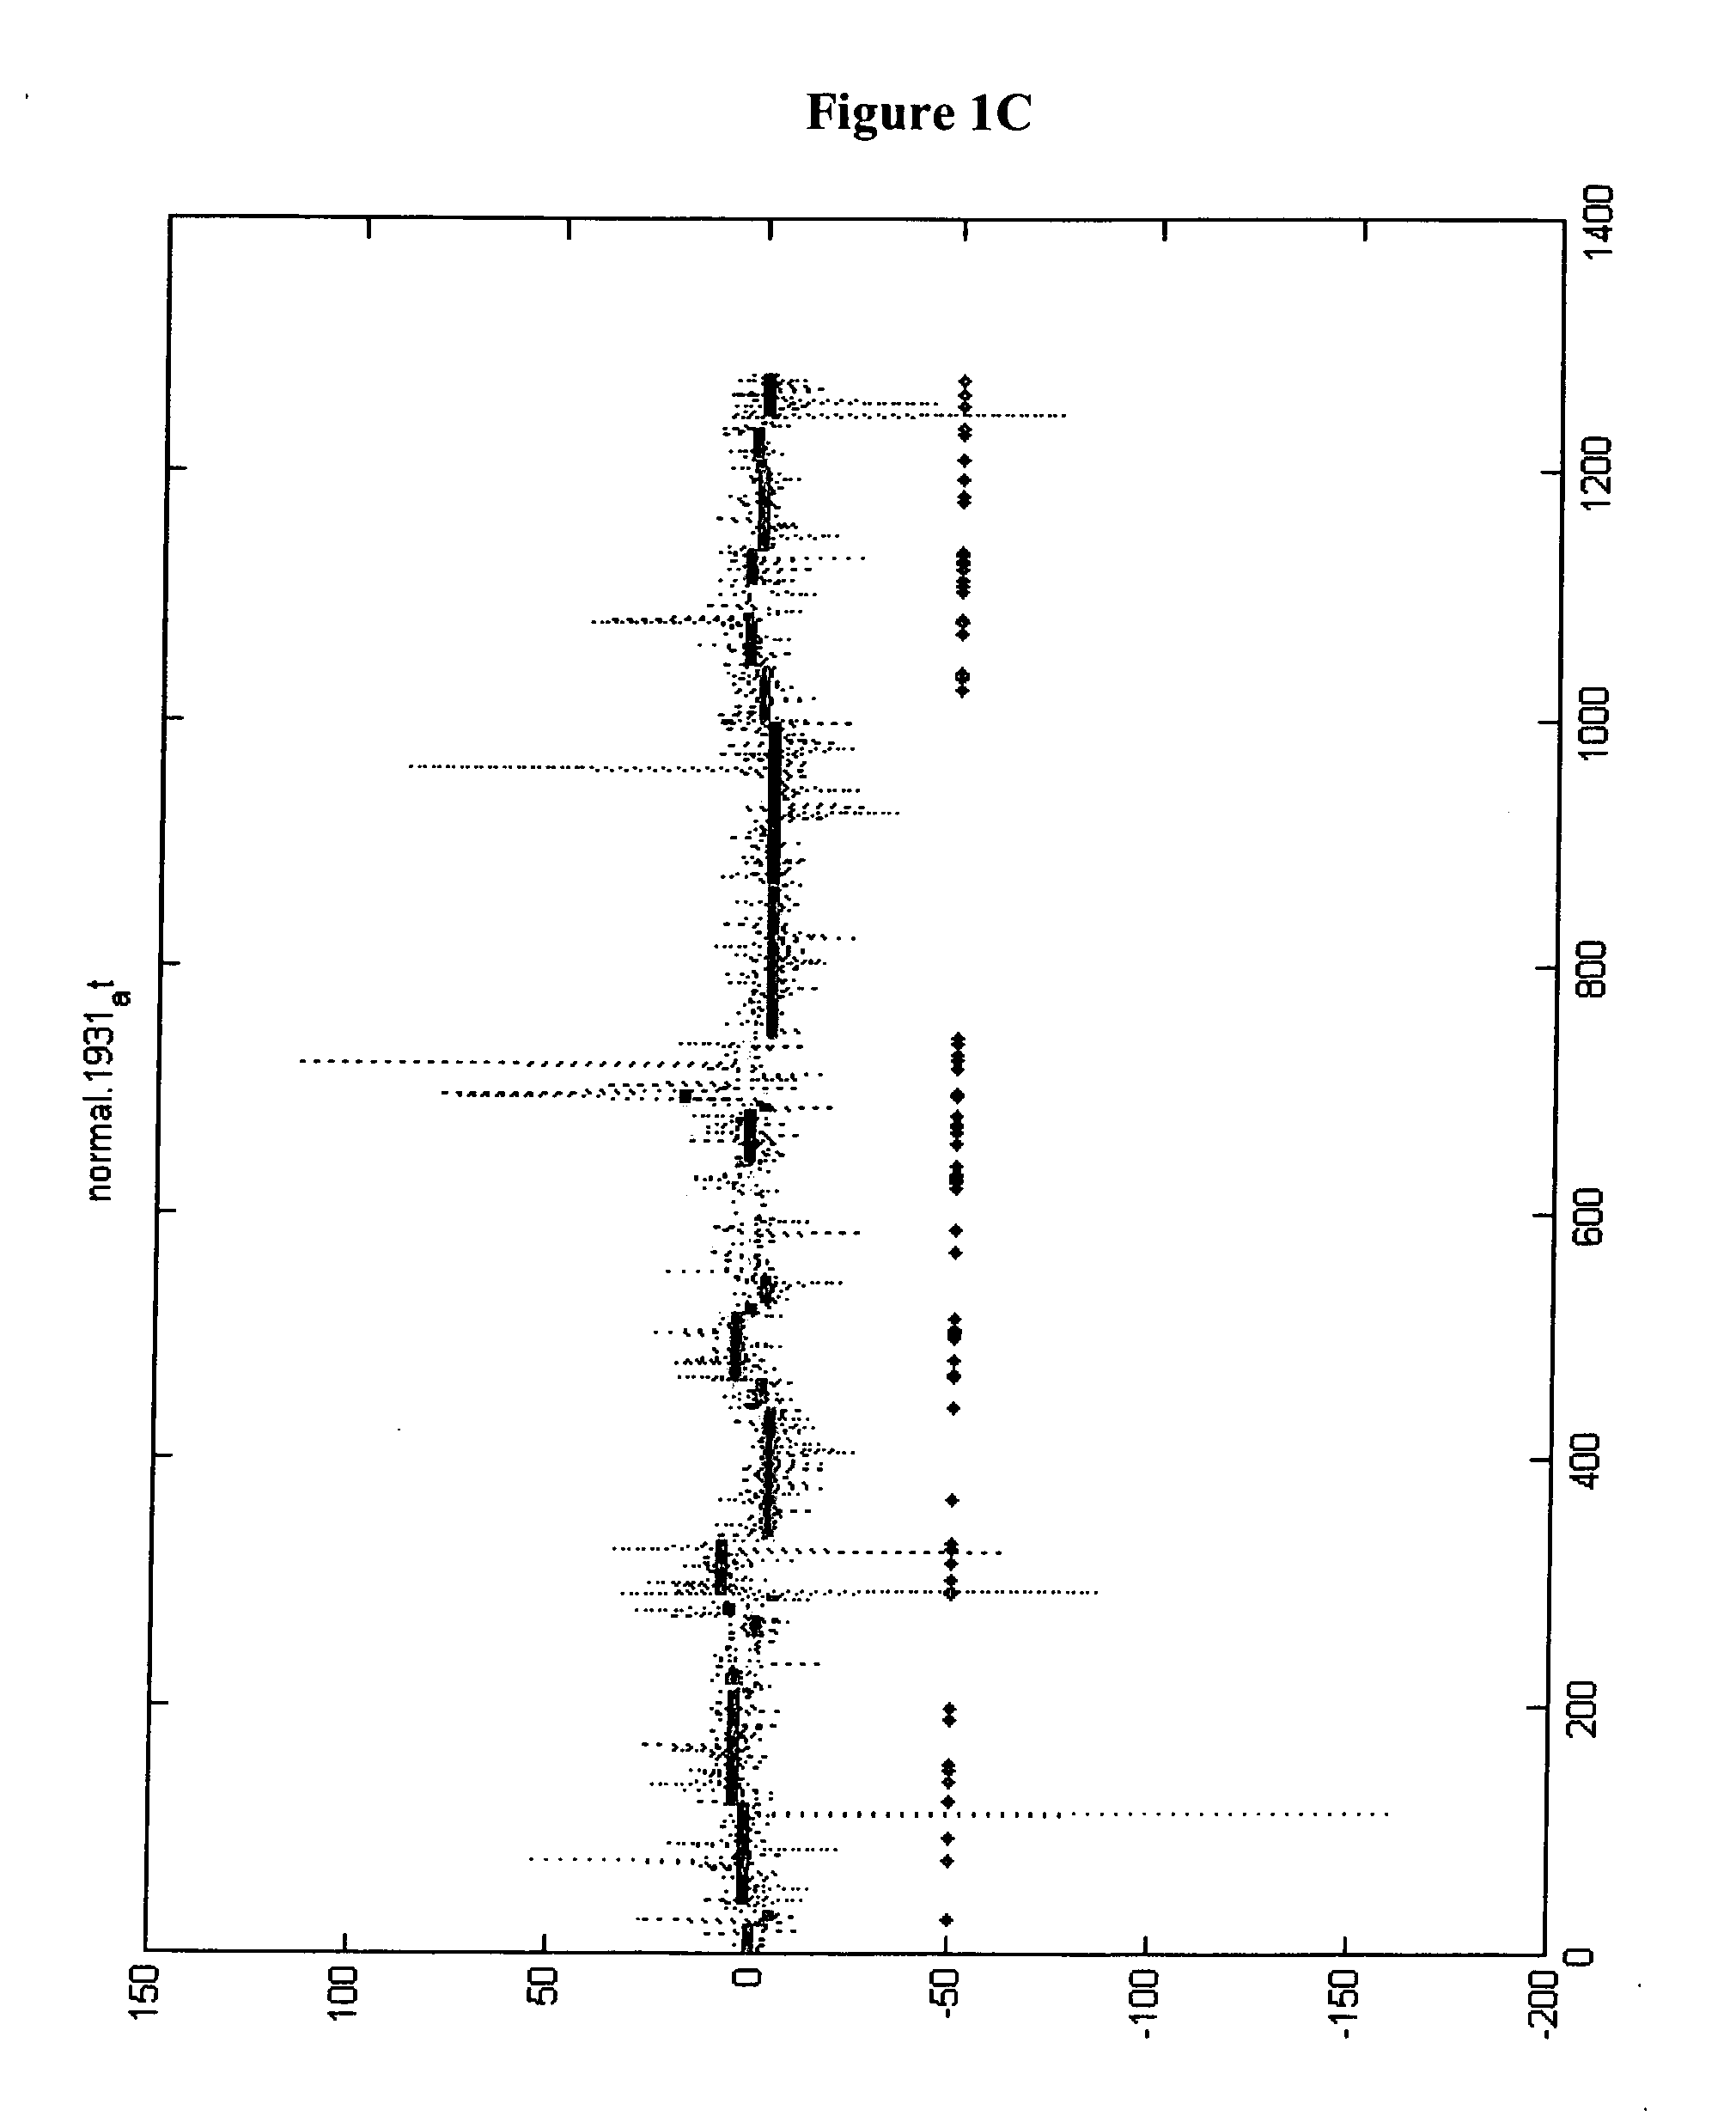
[0289] In the e-northern analysis step, the scatter box plot of each gene was displayed for the sixteen samples. Each of the scatter box plot was studied, and only genes whose median expression value satisfy the following criteria were kept. The gene should have more than 2-fold increased expression in at least one malignant sample as compared to its normal counterpart, and the expression in the malignant sample was greater than all of the eight normal samples.
[0290] A typical e-northern figure (e.g., FIG. 1A) is composed of three parts: left, middle, and right. The left part lists the sample sets used to obtain the plot. It includes the sample set name and number of samples (in parenthesis) in the sample set. The middle part uses bars to describe the “present” percentage of individual samples in the sample set. The present percentage is proportional to the filled length of the bar, which is also labeled by the number below the bar. The right part is ...
example 3
Transmembrane Hidden Markov Model (TMHMM) Analysis
[0292] The TMHMM profiles of the polypeptides encoded by the CRTPGs were generated using the TMHMM algorithm described by Krogh et al., J Mol. Biol., 305:567-580 (2001).
[0293] The first part of a TMHMM profile gives statistics and locations of the predicted transmembrane helices and intervening loop regions. If the whole sequence is labeled as inside or outside, the prediction is that it contains no membrane helices. The prediction gives the most probable location and orientation of the transmembrane helice(s) in the sequence. An algorithm called N-best (or 1-best in this case) that sums over all paths through the model with the same location and direction of the helices.
[0294] The statistics include: [0295] Length: the length of the protein sequence; [0296] Number of predicted TMHs: The number of predicted transmembrane helices; [0297] Exp number of AAs in TMHs: The expected number of amino acids in transmembrane helices. If this...
PUM
| Property | Measurement | Unit |
|---|---|---|
| Composition | aaaaa | aaaaa |
| Protein activity | aaaaa | aaaaa |
| Immunogenicity | aaaaa | aaaaa |
Abstract
Description
Claims
Application Information
 - R&D
- Intellectual Property
- Life Sciences
- Materials
- Tech Scout
- Unparalleled Data Quality
- Higher Quality Content
- 60% Fewer Hallucinations
Browse by: Latest US Patents, China's latest patents, Technical Efficacy Thesaurus, Application Domain, Technology Topic, Popular Technical Reports.
© 2025 PatSnap. All rights reserved.Legal|Privacy policy|Modern Slavery Act Transparency Statement|Sitemap|About US| Contact US: help@patsnap.com


