
Biotype diets system: predicting food allergies by blood type

Inactive Publication Date: 2006-01-19
POWER LAURA W
View PDF9 Cites 29 Cited by
  • Summary
  • Abstract
  • Description
  • Claims
  • Application Information

AI Technical Summary

Benefits of technology

[0032] 14. In summary it is a significant

Problems solved by technology

The problem with most diets is that not all people can eat the same foods due to digestive differences, and food intolerances, allergies and hypersensitivities.
Allergy or hypersensitivity testing for individuals can be time-consuming, expensive, unreliable, dangerous, or difficult to obtain.
Commercial and published diet systems are abundant, but confusing, and often inaccurate or inappropriate.
However, their system does not employ blood subtypes A1, A2, A1B, A2B, Rh-positive, or Rh-negative, which limits their specificity.
Their methods for determining diets are based on observation of patients, and not on objective criteria such as food allergies or food hypersensitivities, which limits their accuracy.
However, his list of lectins contradicts the known scientific literature.
However, these consist of scattered references; no one list is complete, nor do any of these describe a diet-typing system.
But no other studies exist which correlate blood types with food allergies.
U.S. Pat. No. 6,291,533 B1, Sep. 18, 2001, was granted to Fleischner, entitled “Dietary Supplements For Each Specific Blood type.” U.S. Pat. No. 6,503,529 B1, Jan. 7, 2003, was also granted to Fleischner, entitled “Blood type Methods and Dietary Supplements.” These relate blood types with nutrients, but do not address foods, diets, allergies, or hypersensitivities.
It had inadequate numbers of subjects in each blood-type category.

Method used


Image

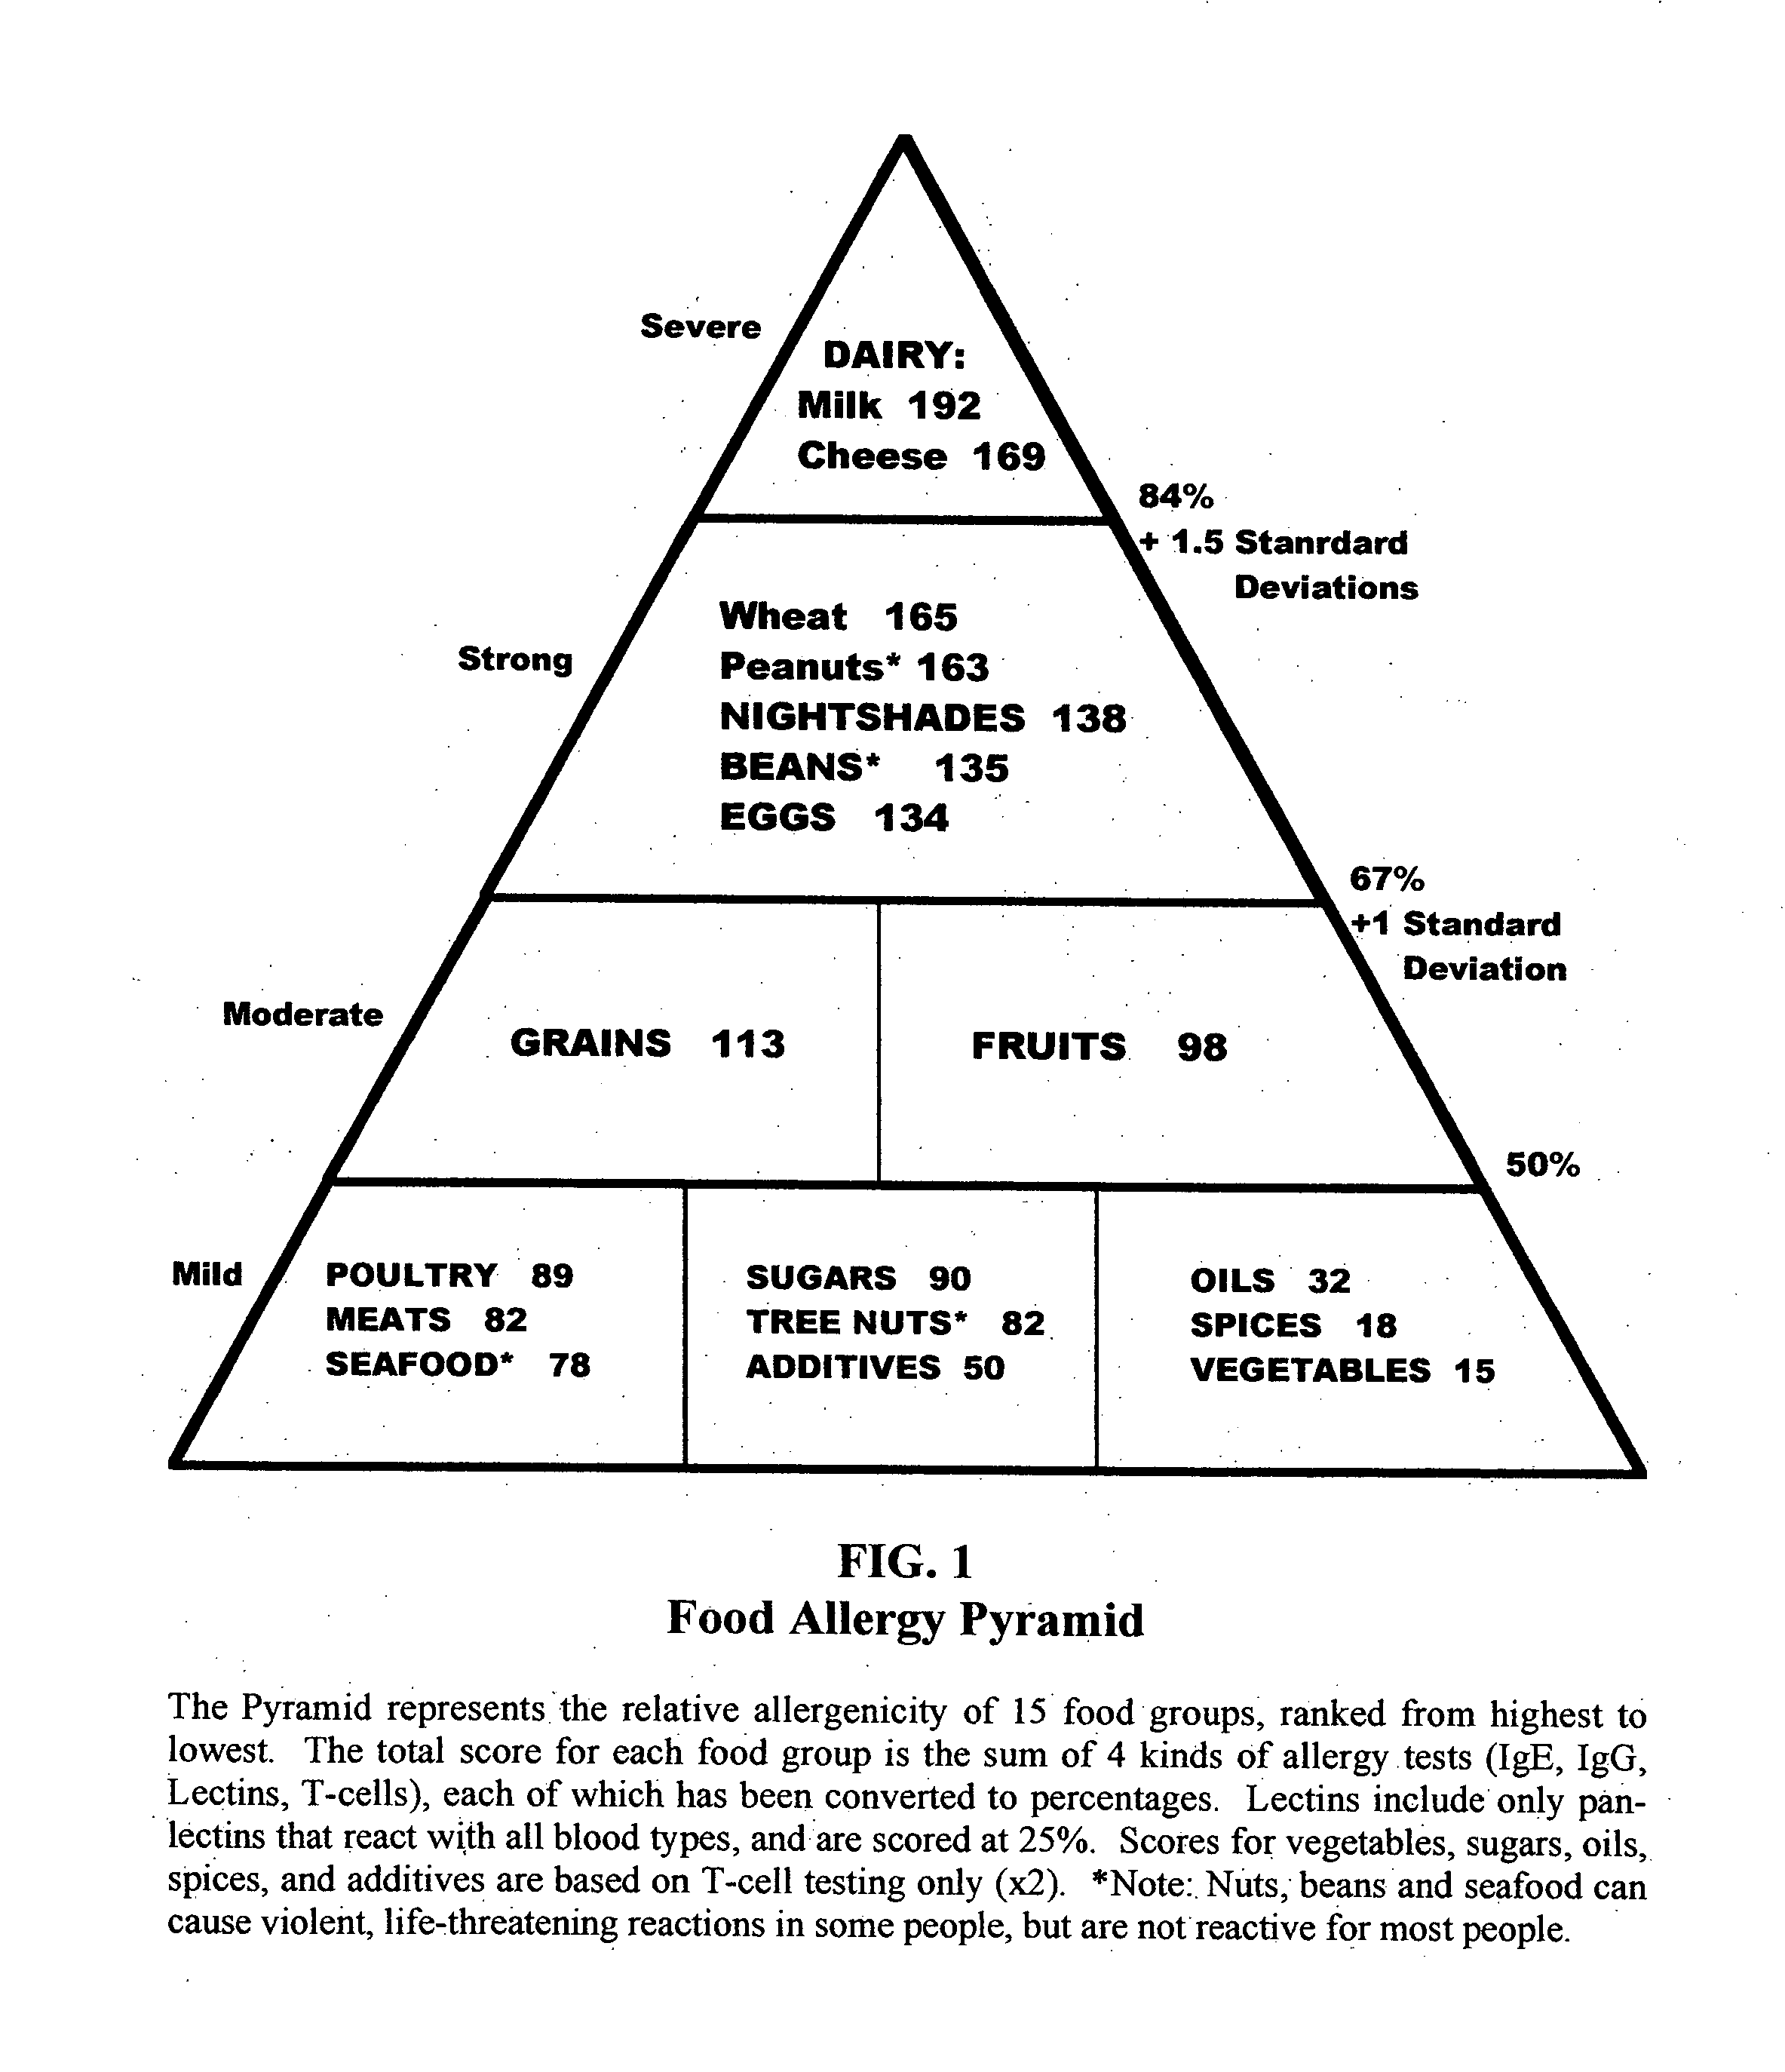
  • Biotype diets system: predicting food allergies by blood type
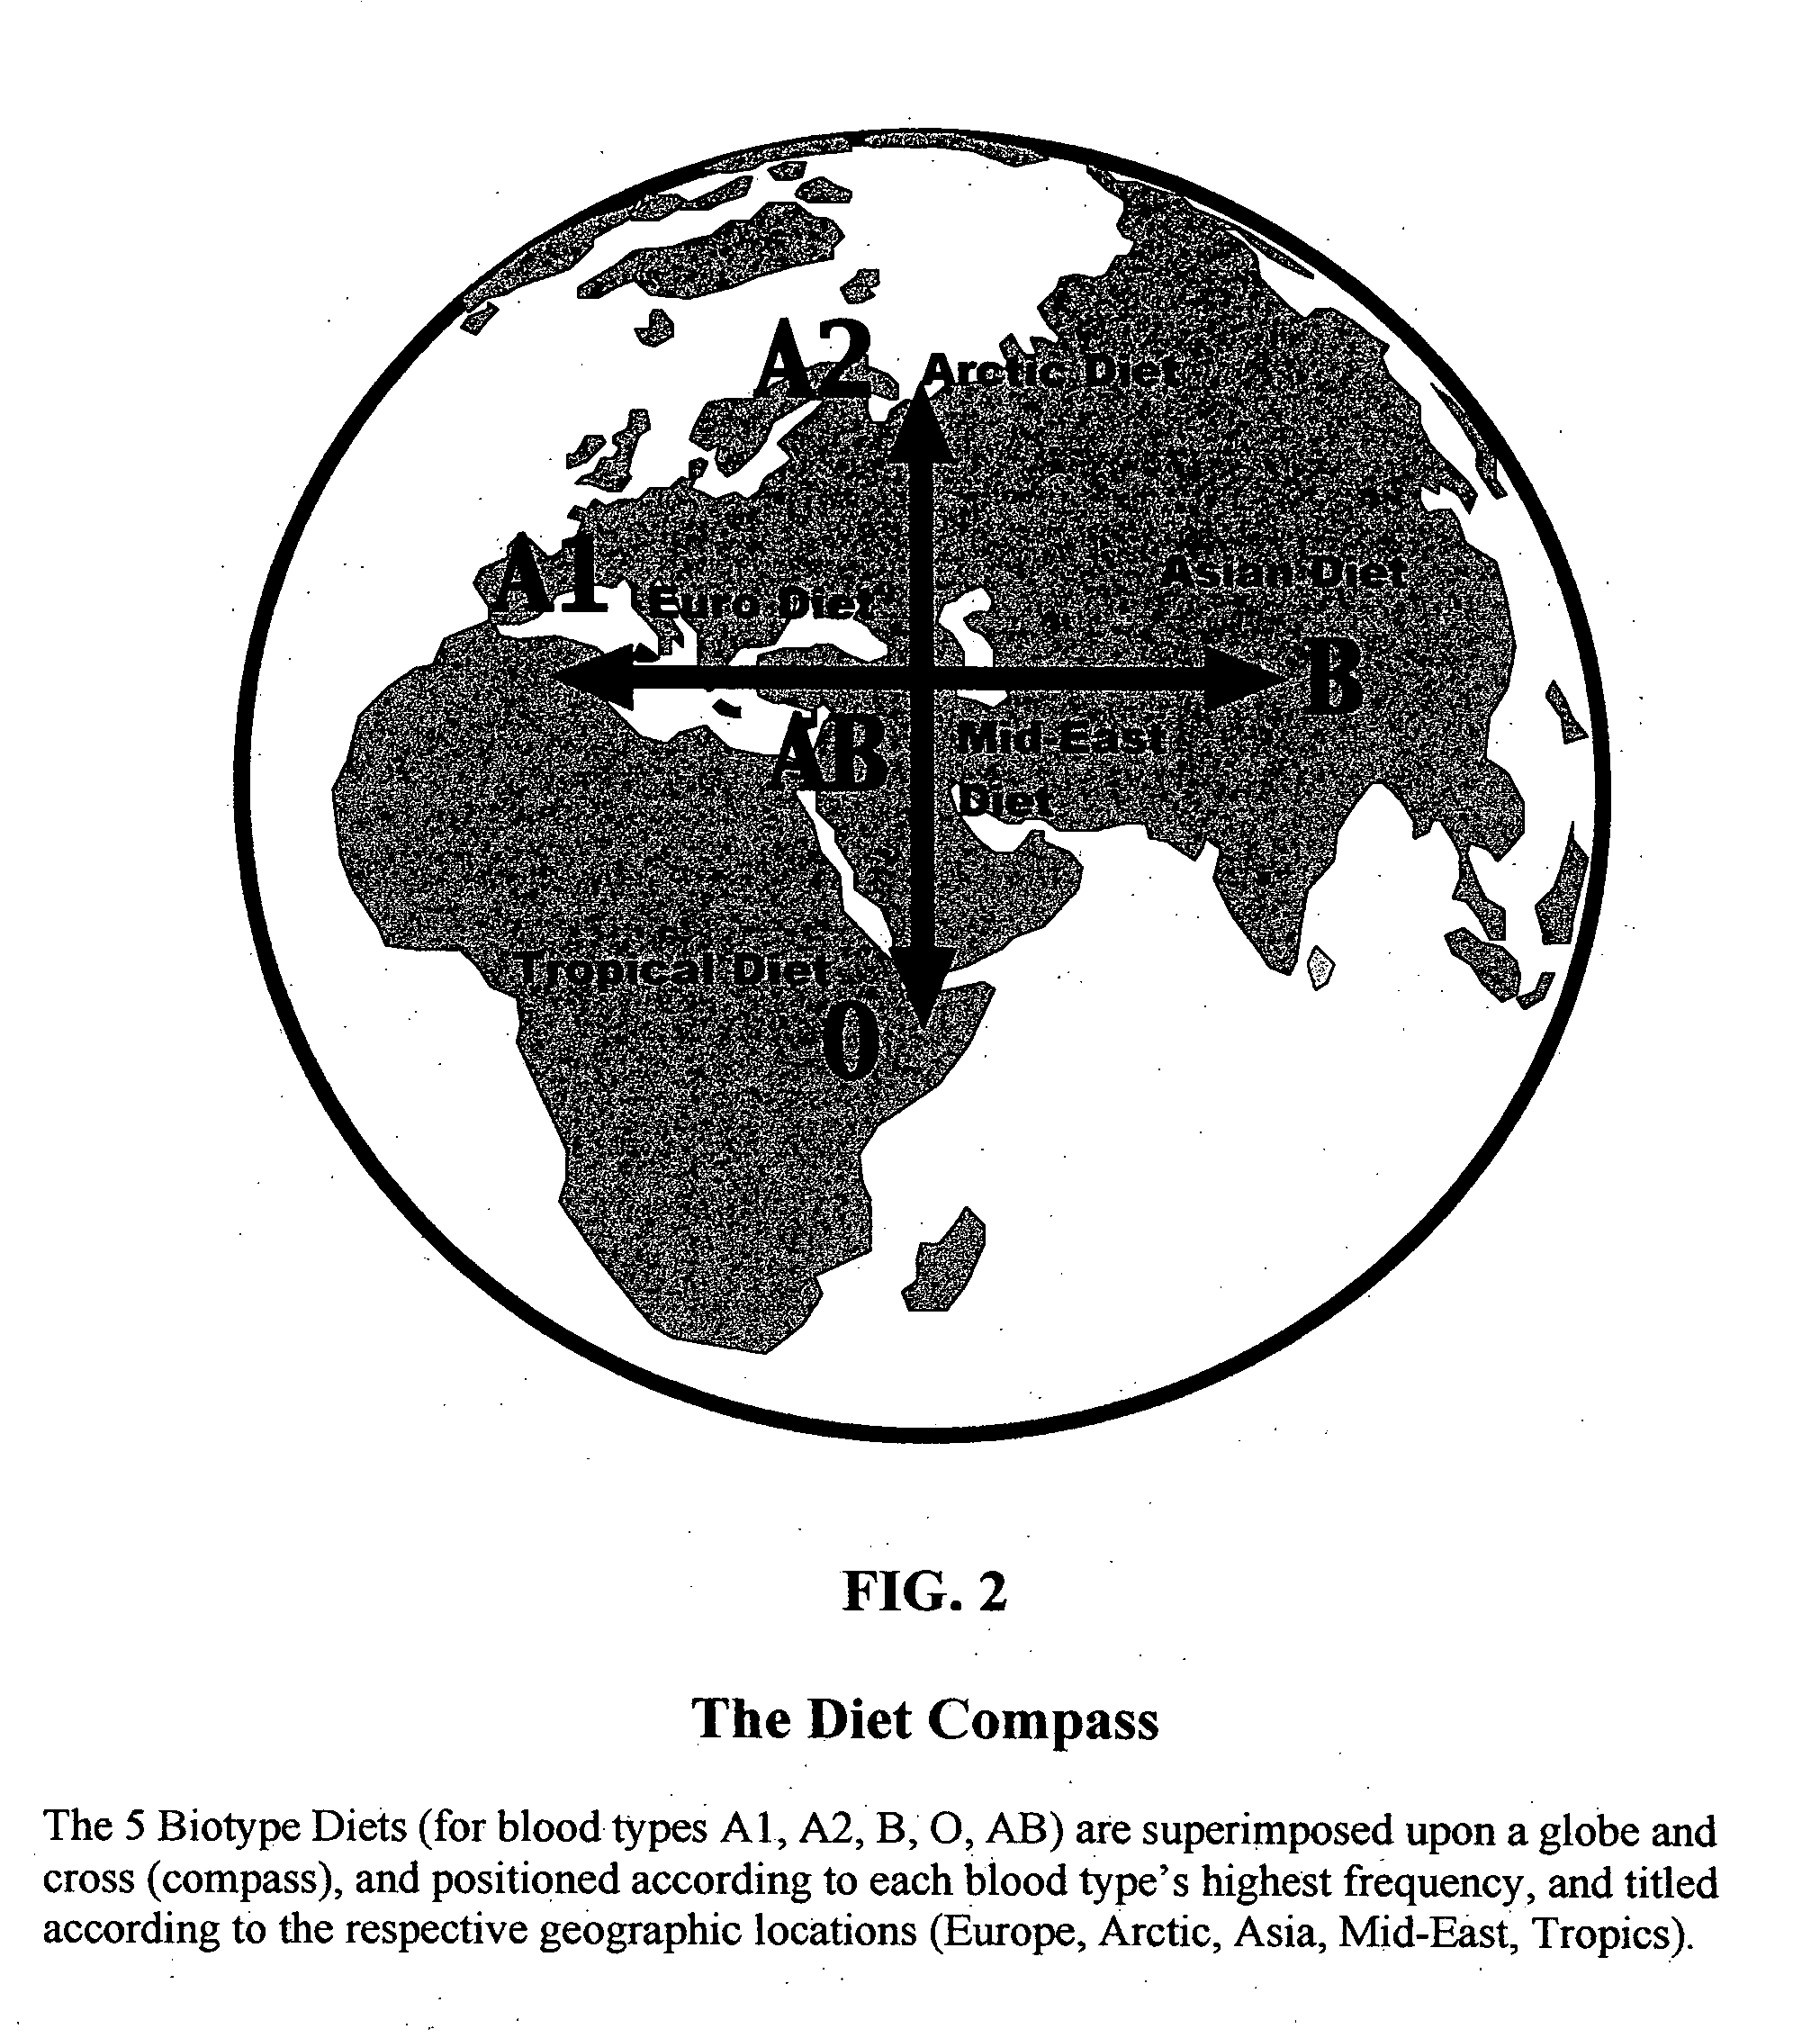
  • Biotype diets system: predicting food allergies by blood type
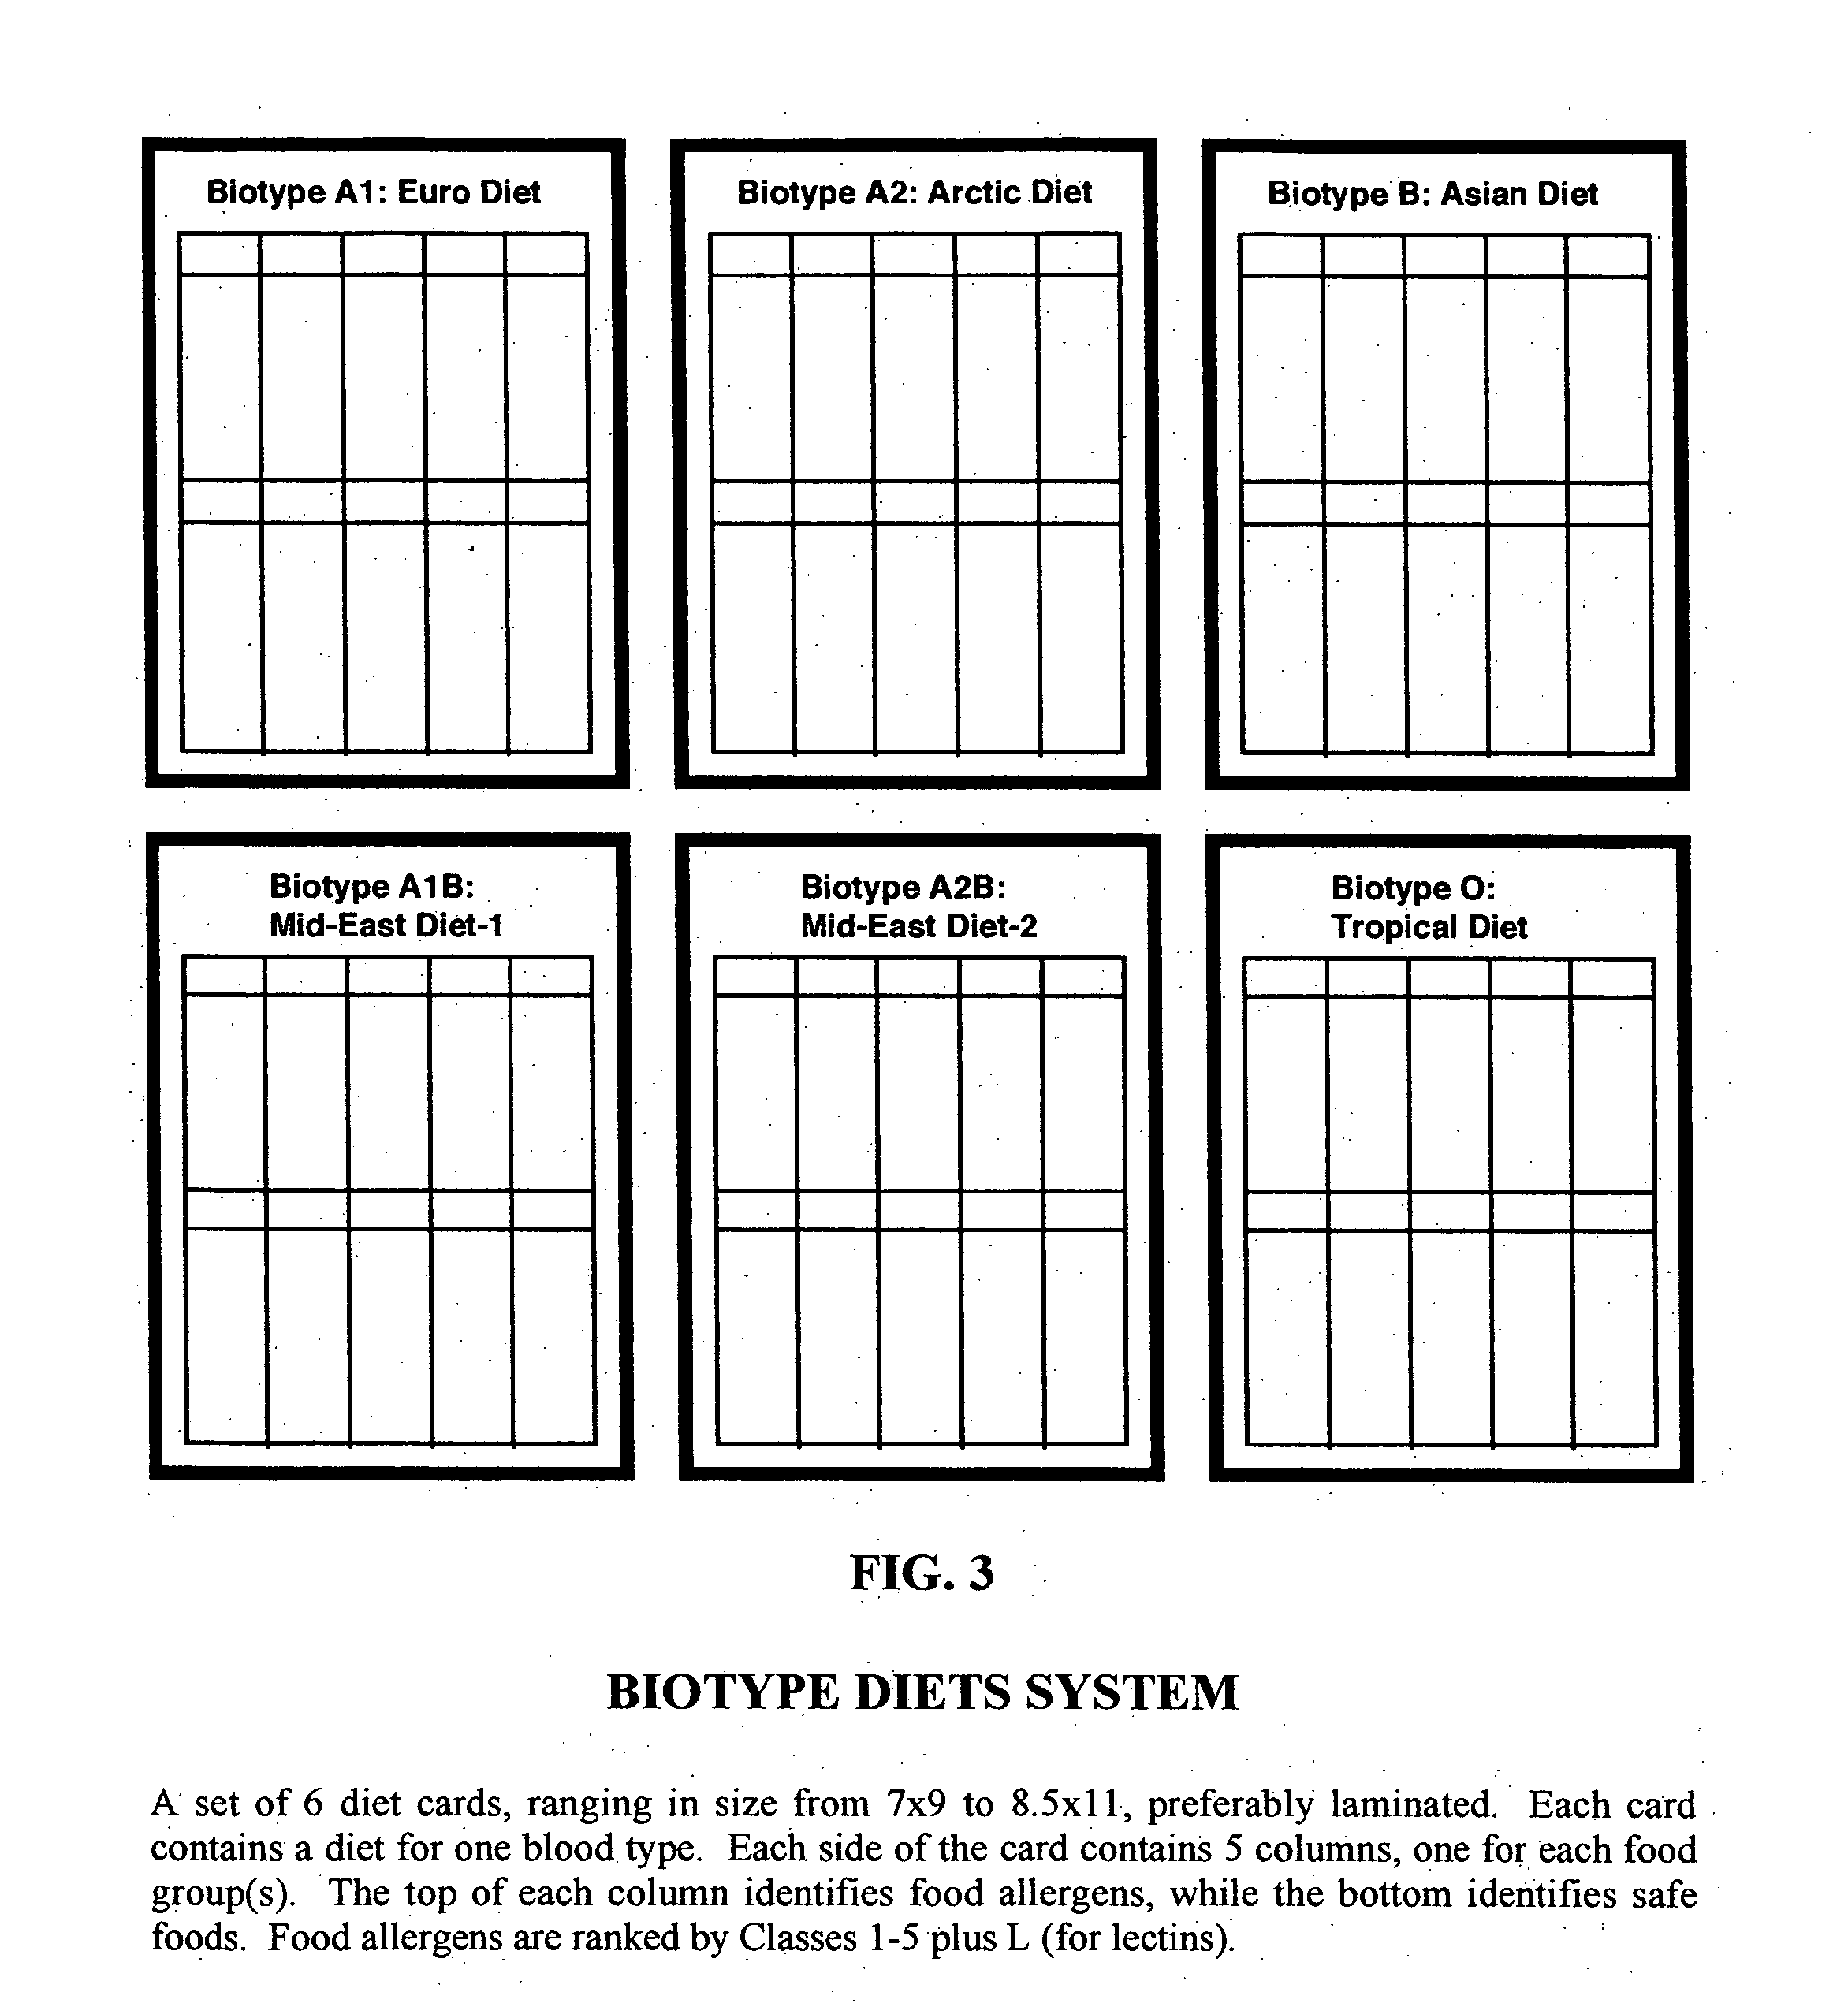
  • Biotype diets system: predicting food allergies by blood type

Examples


example 1

Experimental Methods

[0136] The study design was a descriptive study, of the cross-sectional survey and correlational types. This means that it analyzed the prevalence of a disease (several kinds of food allergies), and correlated them statistically to variables that are unaltered over time (blood types).

[0137] The results were arrived at by novel methods. From 1985 to 2000 four studies were conducted for four kinds of food allergies and hypersensitivities, representing the four Gell-Coombs Immune Responses [J. Breneman. Basics of Food Allergy. Thomas, Springfield, Ill., 1984.] Records were obtained from The Nutrition Clinic in Bethesda, Md. and from The Allergy & Nutrition Clinic in Falls Church, Va. Otherwise healthy patients were self-referred for nutrition or food allergy counseling. Of these the first 500 were selected who had not been avoiding suspected food allergens.

[0138] Six blood types were selected as independent variables: A1, A2, B, O, A1B, A2B. Four subtypes were al...

example 2a

Statistical Analysis

[0143] Statistical analysis for health and demographic data was compiled in the following manner: Blood types, gender and ethnic background distributions were compared to U.S.A. distributions by chi-square analysis. Age, pulse, blood pressure,.and body mass index were compared to U.S.A. population means by student's t-test. Distribution of factors between blood types were analyzed by contingency table analysis. (Data was analyzed by Stateview on Macintosh.) Results showed some statistically-significant deviations from the national norms: more rare blood types (i.e. A2, AB, B, Rh−), more females than males, an older population, normal pulse, lower blood pressure, and higher body massindex.

TABLE 2DEMOGRAPHIC DATA FOR 3 STUDIESIgEIgGT-CELLFACTORSSTUDYSTUDYSTUDYTOTALU.S.A.All Subjects175175150500Blood Type A140404412433.6%Blood Type A230301777 8.4%Blood Type B30302080  10%Blood Type O606056176  44%Blood Type AB15151343  4%Blood Type Rh+144144113401  85%Blood Type ...

example2b

Interpretation of the Data

[0147] Identifying patterns in food allergies relative to blood types or gender was determined by the strength of the reactions (mean test scores) and by statistical significance (p values).

[0148] Establishing classes for the degree of human clinical immune reactivity to foods is problematic in three ways: (1) assigning classes to frequency distributions (ranges) of continuous variables is arbitrary, (2) groups have less extreme ranges than individuals, and (3) the frequency distribution represents a range of healthy to unhealthy food reactions, rather than bivariate normal distribution. Therefore, the preferred method of classification was to apply standard deviations to the distribution of test scores in each study. Hence the lower ⅓ of food scores was designated as non-reactive (0-33%, −3 to −1 standard deviations). The middle ⅓ was designated as equivocal (34% -67%). And the upper ⅓ was designated as reactive (67% -100%, +1 to +3 standard deviations)....


PUM

PropertyMeasurementUnit
Fractionaaaaaaaaaa
Lengthaaaaaaaaaa
Lengthaaaaaaaaaa

Abstract

The invention is a diet-typing system for humans, including novel methods for diagnosis and treatment of food allergies and hypersensitivities. The diagnostic method correlates blood types (immunologically reactive antigens on RBC, skin and membranes) to four kinds of food allergies / hypersensitivities (IgE antibodies, IgG antibodies, T-cells, and Lectins). The results are used to identify and predict food allergies and hypersensitivities for six biological types (blood types A1, A2, B, O, A1B, and A2B), plus diet modifications for three subtypes (blood type Rh-negative, males and females). The treatment method uses the results to make food recommendations (to eat, limit, or avoid), based on the strength or classification of allergy scores, to mitigate the risk of food allergies and hypersensitivities in future persons. The diet-typing system presents the results on six diet cards, one for each blood type. The methods and resulting diets are unique, and differ substantially from prior inventions.

Description

CROSS-REFERENCE TO RELATED APPLICATIONS: [0001] This application claims priority to the Provisional Patent Application No. 60 / 587,827, filed Jul. 15, 2004.BACKGROUND OF TIE INVENTION [0002] 1. Field of Invention [0003] This invention proposes a food-allergy-typing system for diagnosis and treatment; specifically these correlate blood types to food allergies and food hypersensitivities. [0004] 2. Prior Art [0005] The problem with most diets is that not all people can eat the same foods due to digestive differences, and food intolerances, allergies and hypersensitivities. Allergy or hypersensitivity testing for individuals can be time-consuming, expensive, unreliable, dangerous, or difficult to obtain. Commercial and published diet systems are abundant, but confusing, and often inaccurate or inappropriate. A solution lies in the fact that humans exhibit biological individuality, patterns and types with regard to both physiology and diet. Therefore, a scientifically based diet-typing s...

Claims


Application Information

Patent Timeline
IPC IPC(8): A61K39/00
CPCG01N33/80G01N33/6854
Inventor POWER, LAURA W.
Owner POWER LAURA W
Learn More