System for data analysis

a data analysis and data technology, applied in the field of methods and apparatus for analyzing data, can solve the problems of slow reaction within hospitals when the performance of hospitals is significantly below the mean, and the integrated mechanism for quick and efficient statistical analysis of the data contained within these databases cannot be achieved, so as to achieve the effect of easy and quick identification

Inactive Publication Date: 2006-01-19
DR FOSTER
View PDF3 Cites 12 Cited by
  • Summary
  • Abstract
  • Description
  • Claims
  • Application Information

AI Technical Summary

Benefits of technology

[0005] Further, data may be retrieved from another dataset known as the national NHS-Wide Clearing Service (NWCS) dataset which is updated monthly. Data for this dataset is linked using the same fuzzy logic as is used with the annual HES dataset. However, currently there is no integrated mechanism for quick and efficient statistical analysis of the data contained within these databases. The data is currently only collated and analyzed for reports and performance tables resulting in slow reactions within hospitals when their performance falls significantly below the mean. The current invention provides a mechanism allowing data to be analyzed within a minimal amount of time, thereby allowing hospitals and their staff to react quickly to redress any fall in performance, helping to minimize any danger to patient safety.
[0006] According to a first aspect of the invention there is provided a method for and apparatus adapted for analyzing data comprising the steps of: receiving patient data; receiving criteria representative of the patient data to be analyzed; filtering the patient data according to the criteria; and calculating a representation of the filtered data. This provides the advantage that data is quickly analyzed and presented to users of the system, allowing them to easily pinpoint any problems identified within the data.
[0008] Preferably, the method also sets a threshold value above which the graph has diverged significantly from a benchmark value. This allows a user to easily and quickly identify when performance has become poor enough to require measures to be taken to bring it back towards the benchmark value.
[0009] Preferably, the method includes receiving an option according to which the patient data is to be grouped; and grouping the patient data according to the analysis option. This allows easy comparisons between equivalent patient groups in different hospitals or trusts, or different patient groups within the same trust. This allows bodies, such as government, to know where and what are causing different negative outcomes within the hospitals, helping them tackle any causes of poor outcome rates.

Problems solved by technology

However, currently there is no integrated mechanism for quick and efficient statistical analysis of the data contained within these databases.
The data is currently only collated and analyzed for reports and performance tables resulting in slow reactions within hospitals when their performance falls significantly below the mean.

Method used


Image

  • System for data analysis
  • System for data analysis
  • System for data analysis

Examples


Embodiment Construction

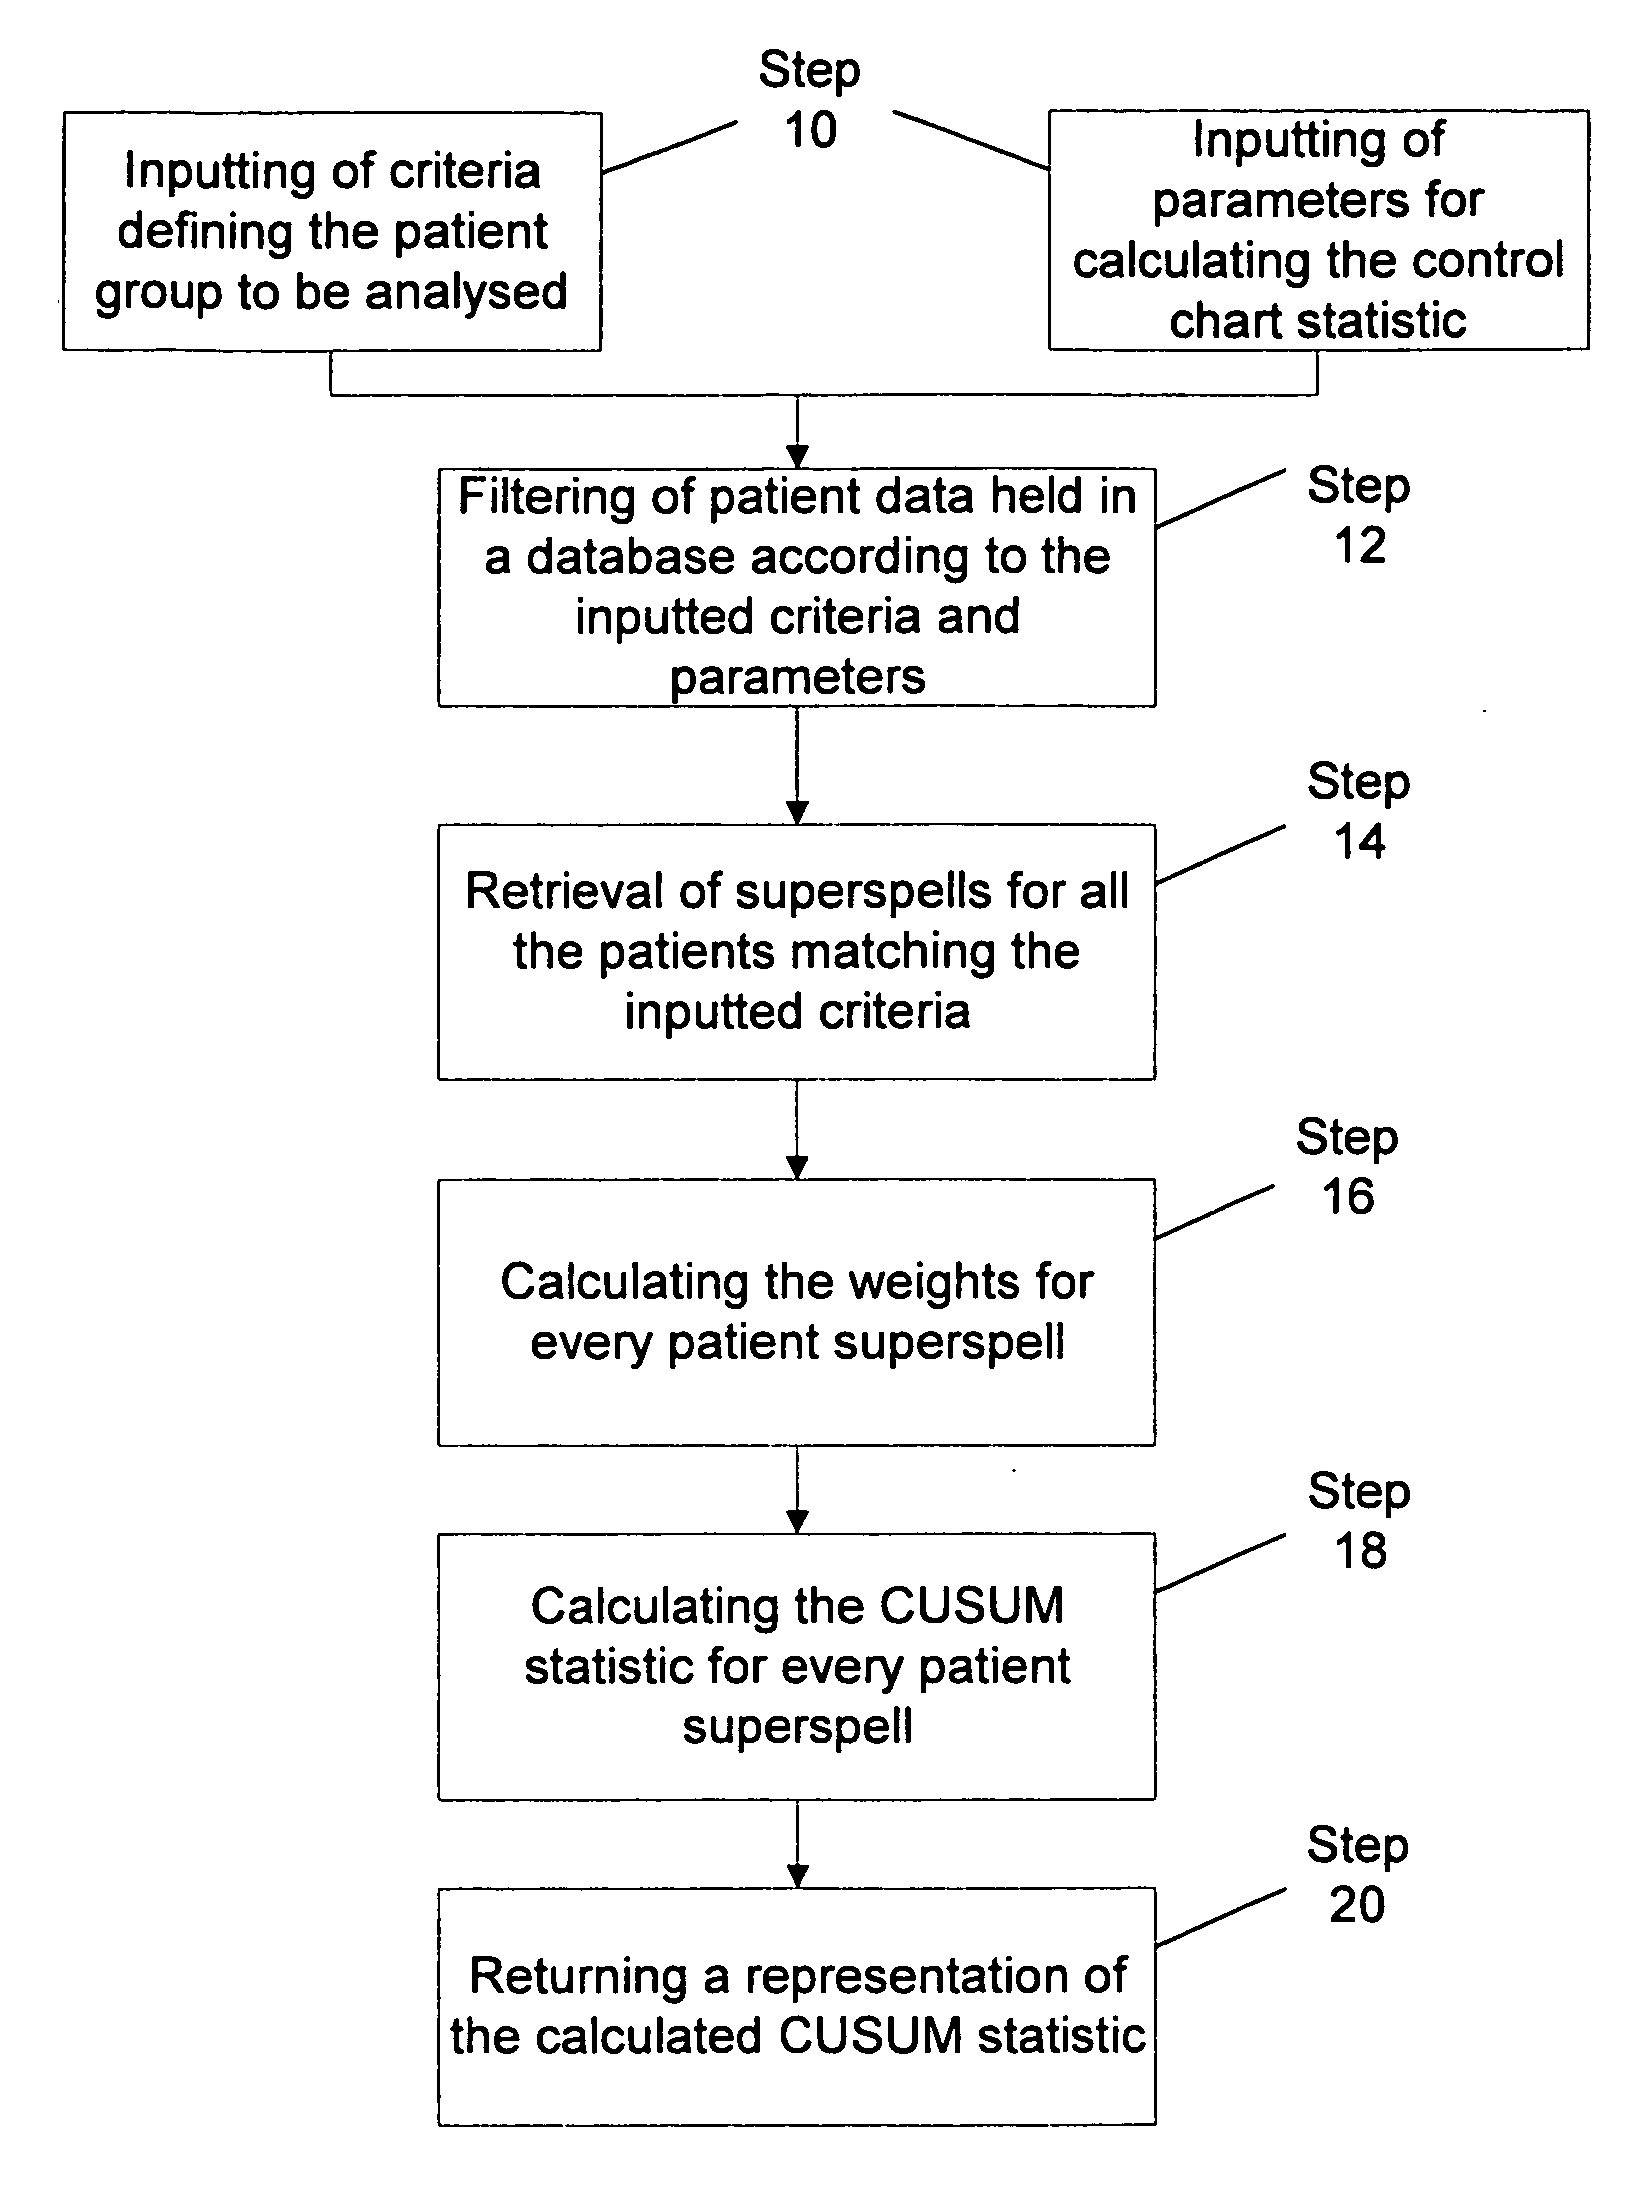
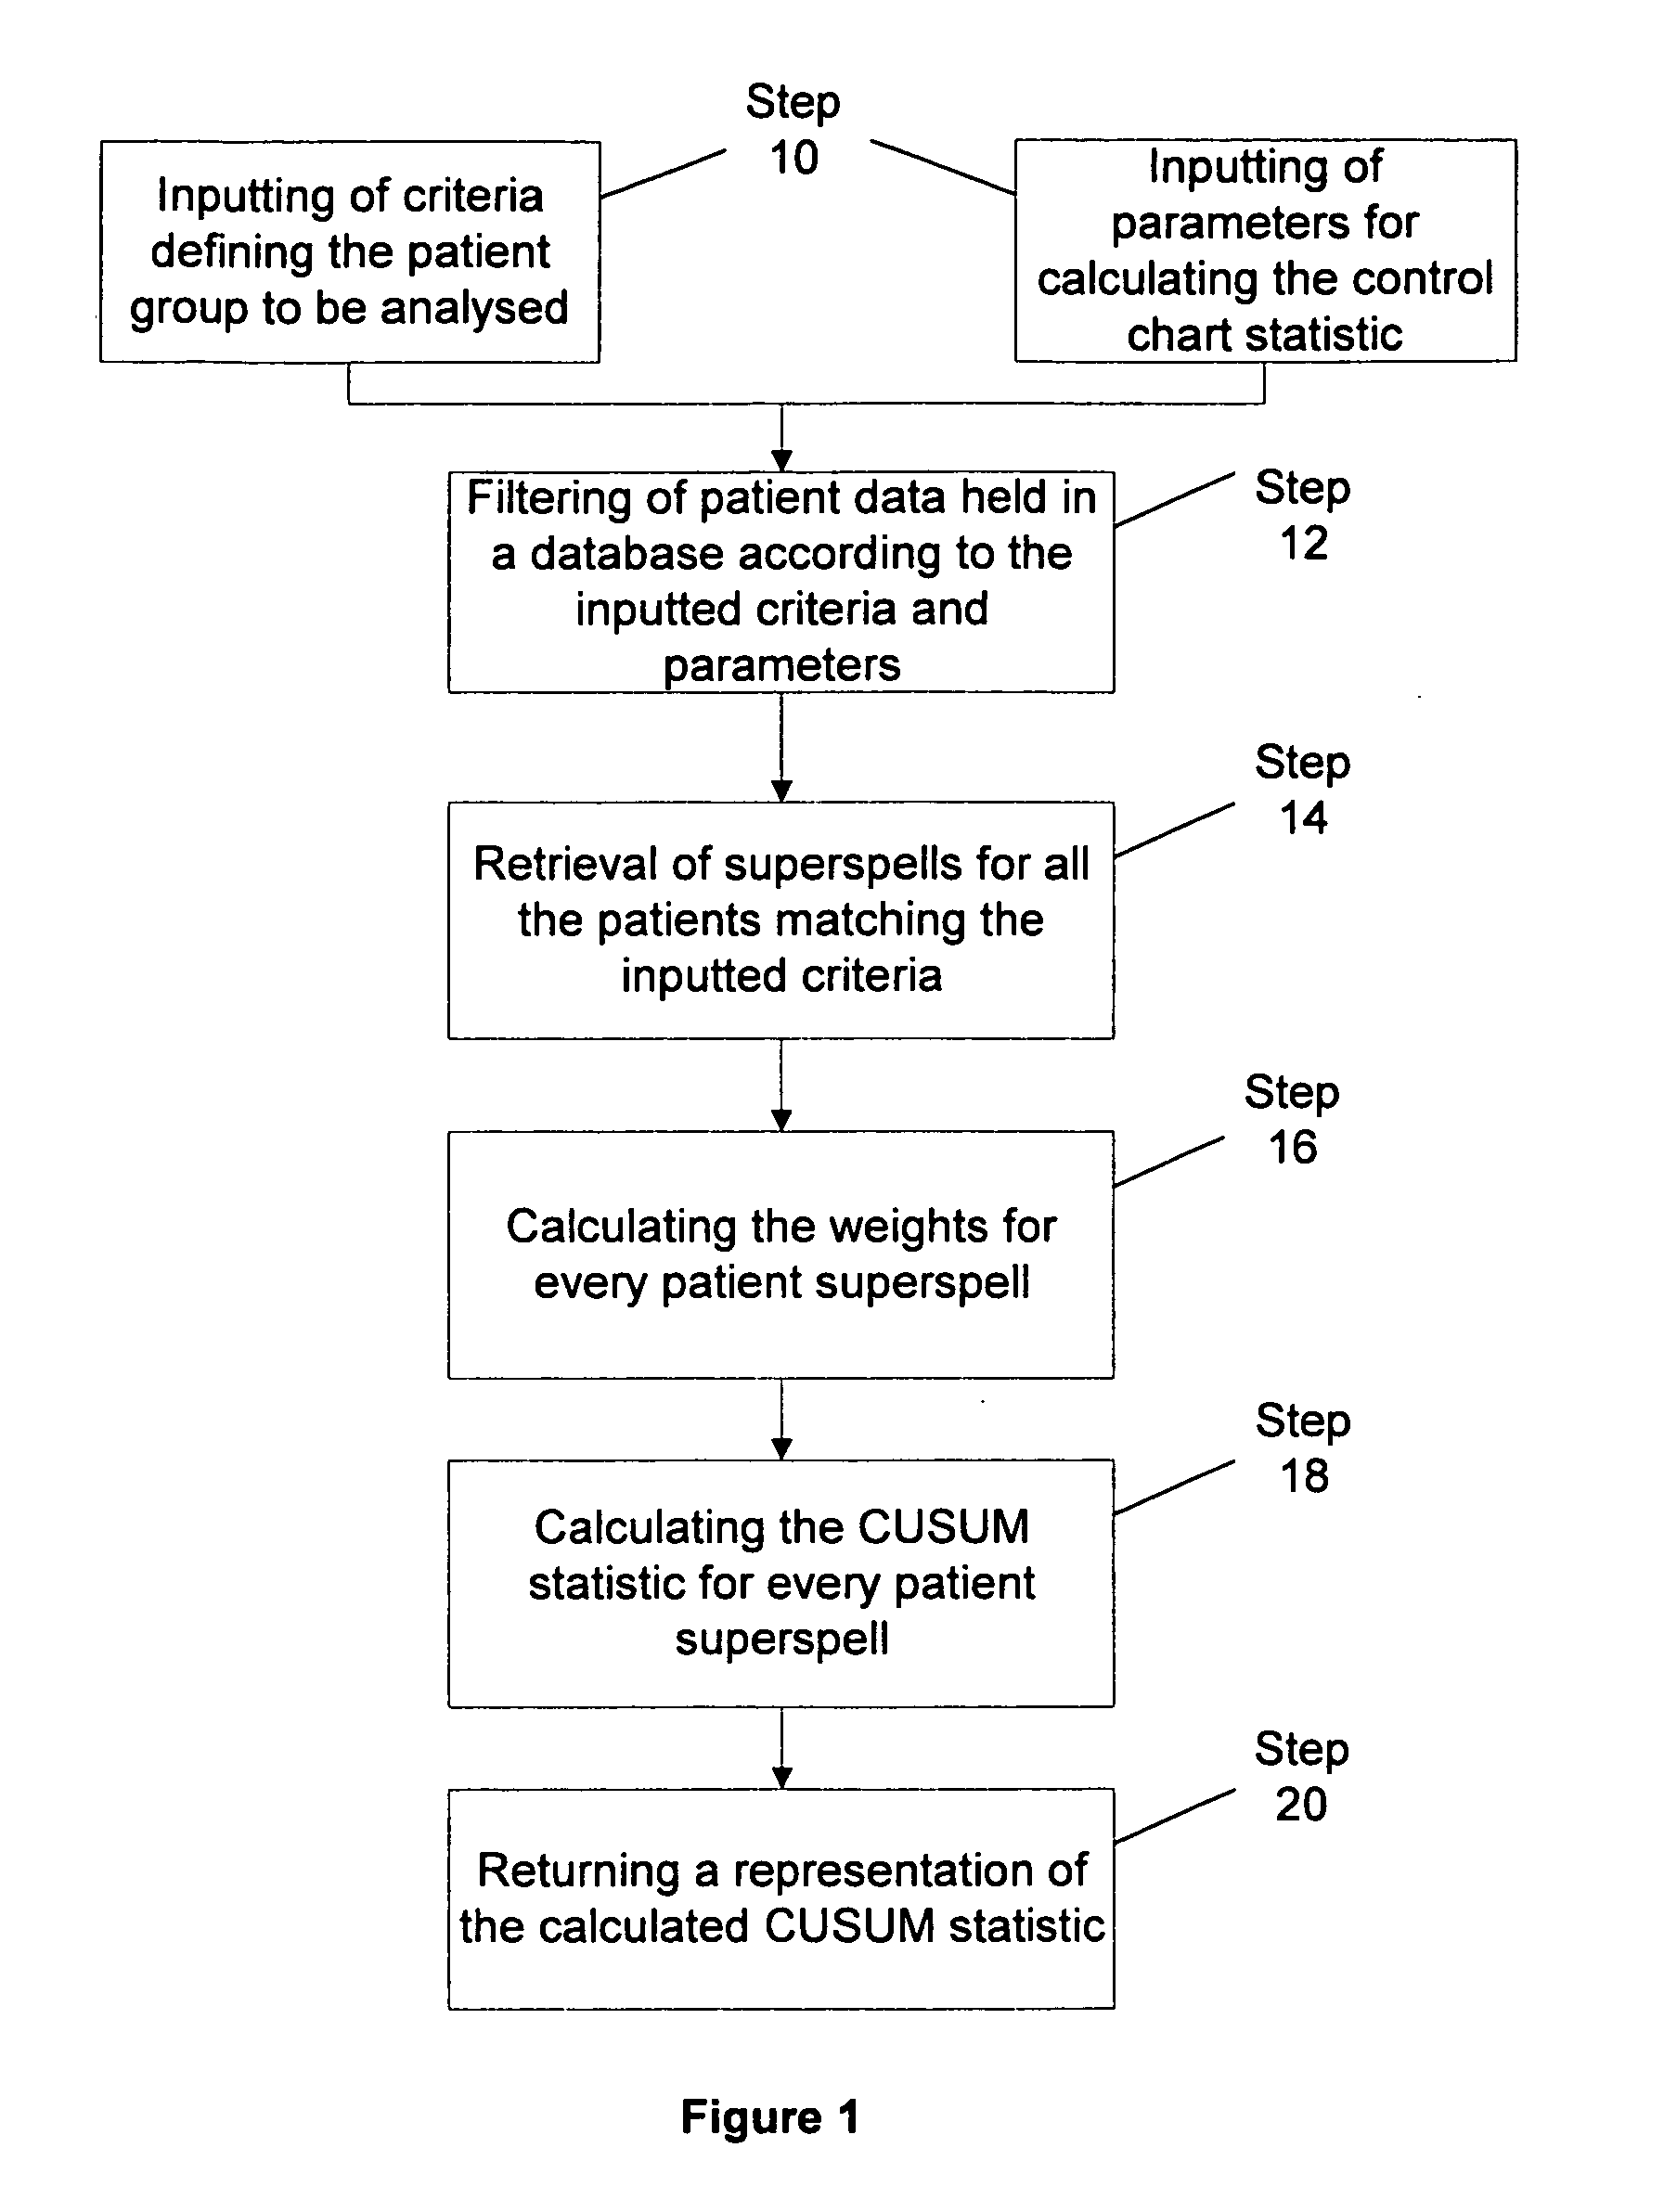
[0016] The following describes the dataset which is currently being used by the system. It is provided as an example and to aid clarity when describing the system's functionality. The system may also be used to measure different outcomes or use similar data from other sources.

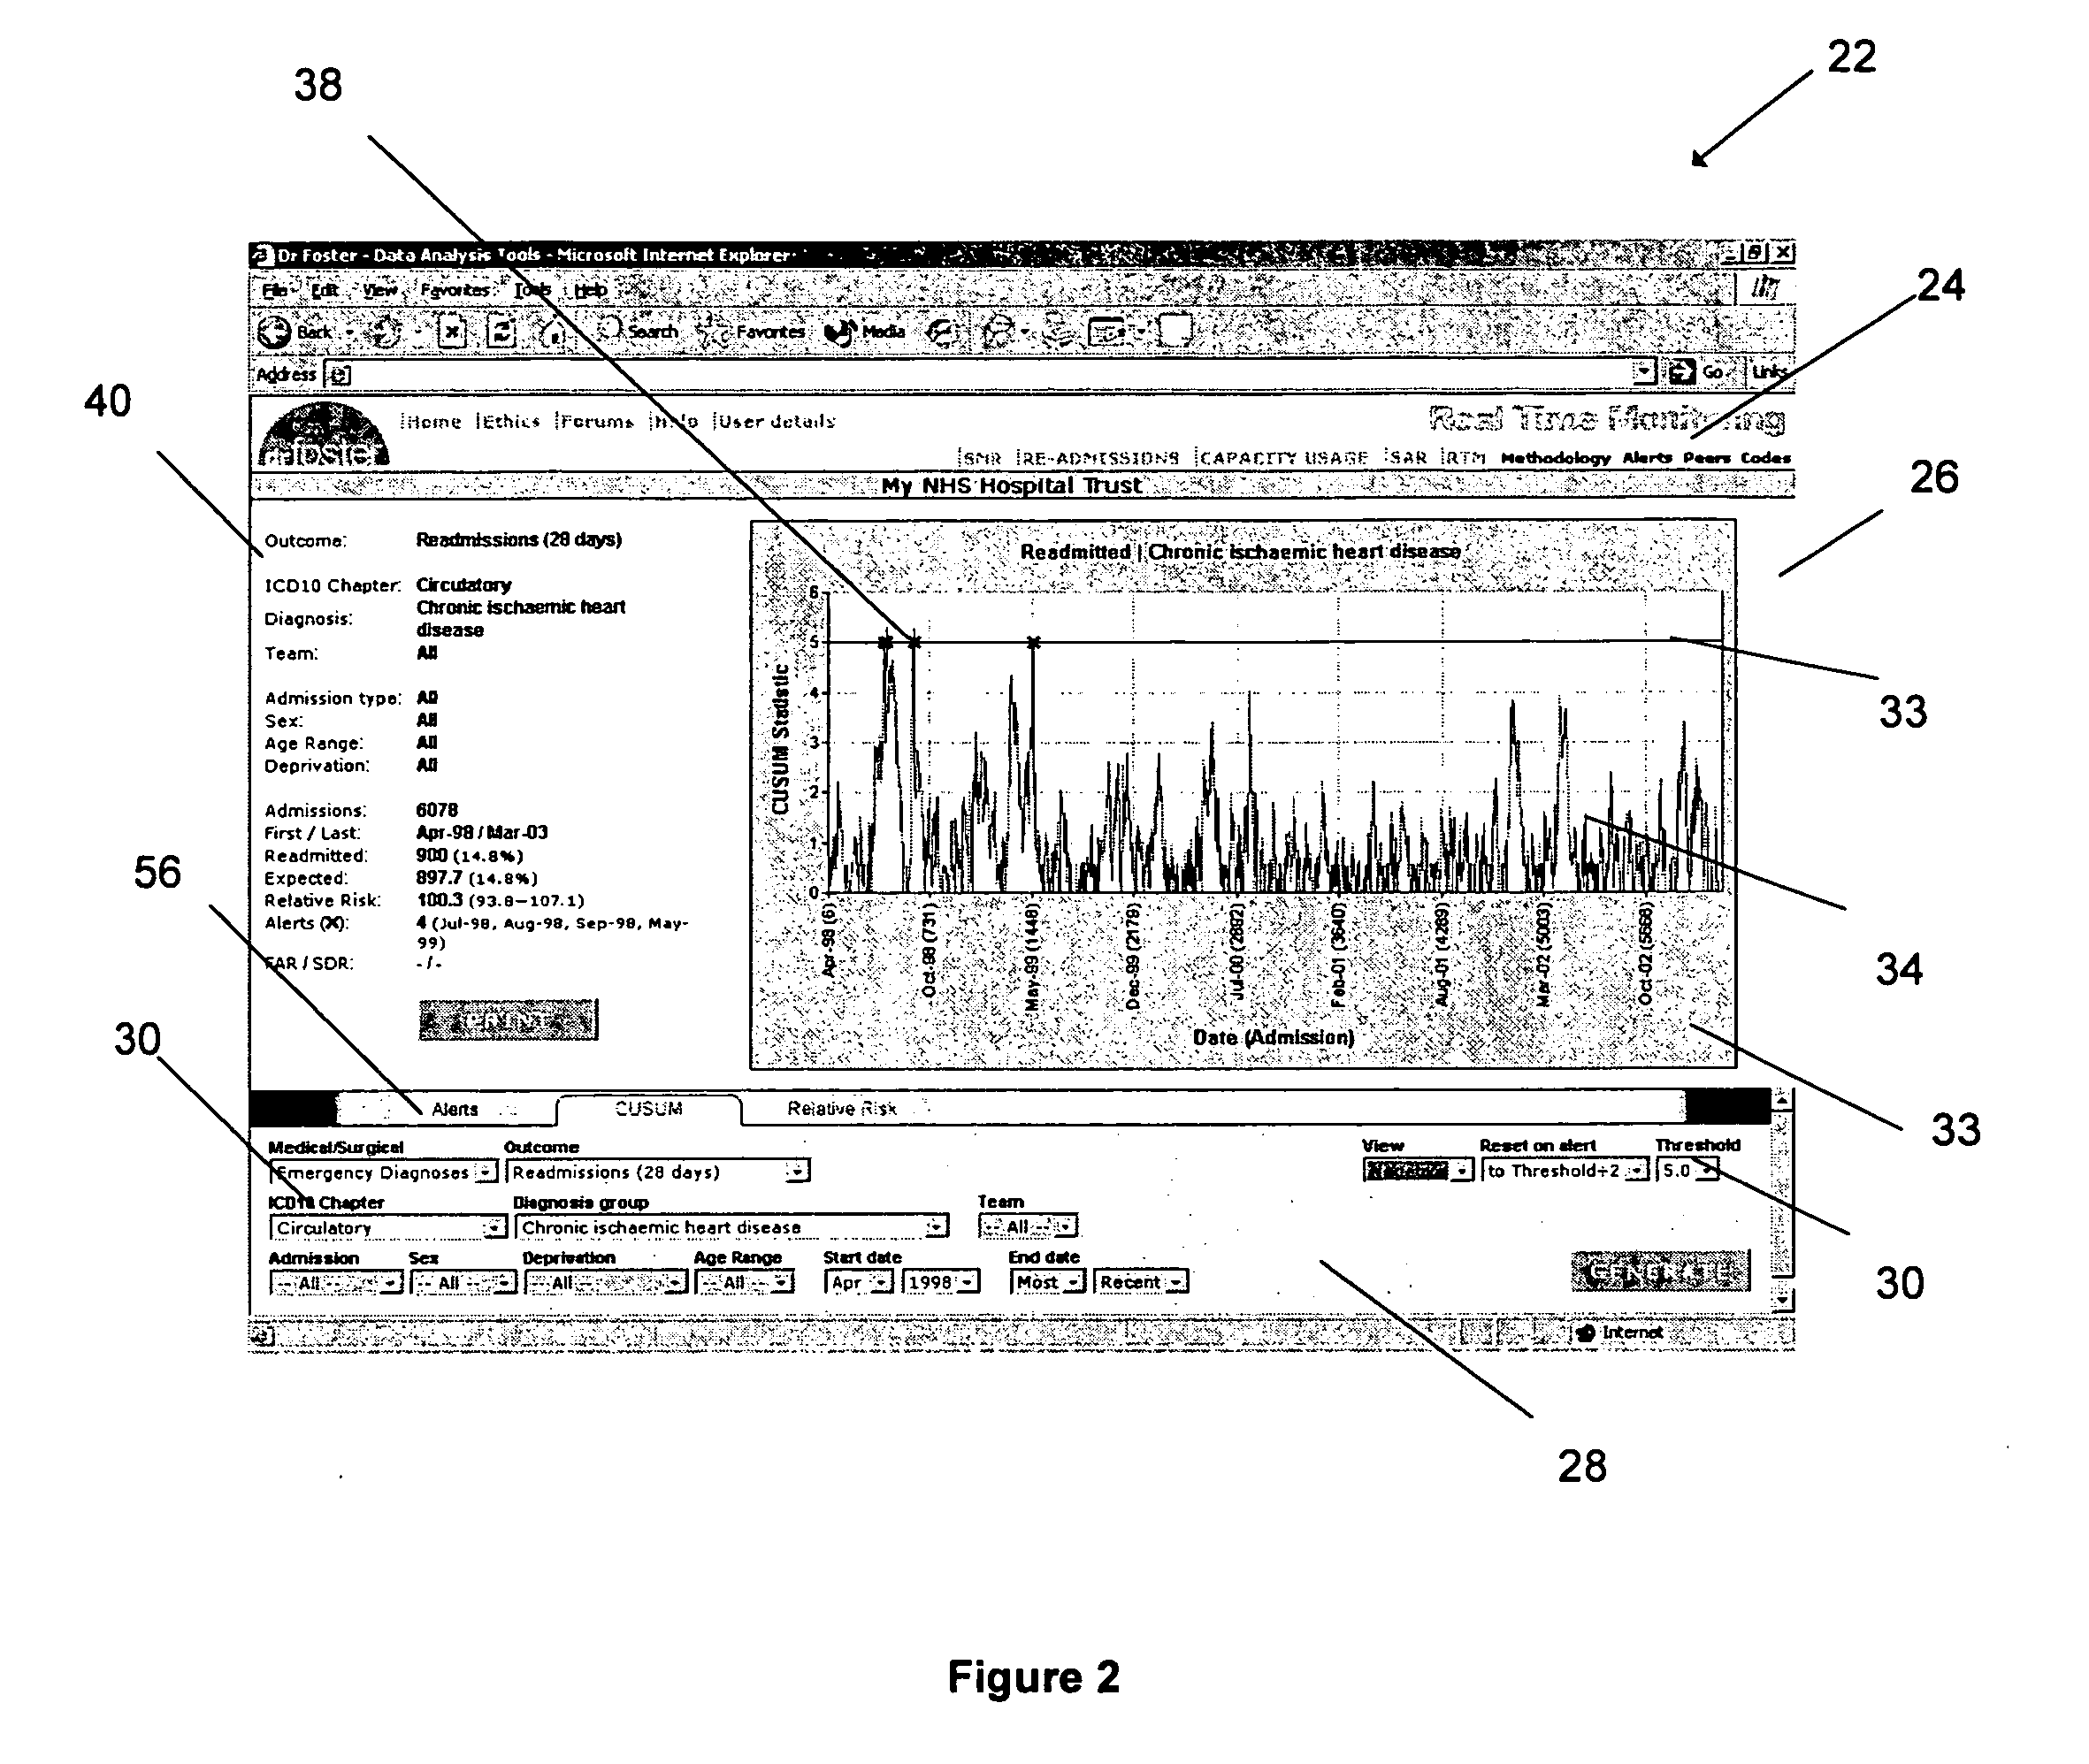
[0017] The system applies statistical process control methodology to health outcomes within hospitals. Control charts such as cumulative sum (CUSUM) charts are used to determine if the outcomes have diverged significantly from a benchmark value. The benchmark values are derived from national dataset and are preferably equal to the average outcome for a relevant group of patients.

[0018] Preferably, the system uses real-time or near-real-time data in order to provide users of the system with up to date data. The use of real-time or near-real-time data allows the users to quickly determine when outcomes have diverged significantly from a benchmark value in order to allow appropriate corrective measures to be tak...


PUM


Abstract

A method and apparatus for analysing data allowing accurate, up to date analysis of the performance of hospitals or hospital trusts as the data is entered into the system. The method and apparatus is optimised for analysing data in such a way as to produce graphical representations allowing easy recognition of groups of patient having or hospitals producing outcomes which have significantly diverged from the desired outcome. The method involves filtering data held within databases to retrieve data belonging to the patient group that is to be analysed. The filtered data is then analysed using statistical calculations and a representation of the analysis is returned to the user for review.

Description

CROSS-REFERENCE TO RELATED APPLICATIONS [0001] Not Applicable STATEMENT RE: FEDERALLY SPONSORED RESEARCH / DEVELOPMENT [0002] Not Applicable BACKGROUND [0003] This invention relates to a methods and apparatus for analyzing data. The invention is particularly applicable to monitoring performance within a Patient Records System. BRIEF SUMMARY [0004] In the United Kingdom performance monitoring is carried out using annual data since 1996. The data is collated from the national Hospital Episode Statistics (HES) dataset. The HES dataset is collated using data received from all English NHS hospital trusts. In the UK, hospitals are managed firstly on an individual level and then at a trust level, therefore, a hospital trust is a set of hospitals having the same controlling management team. The data held within the HES dataset is based on periods of treatment such as a stay in hospital known as episodes. Episodes may be linked together into “spells” representing a continuous period of care fo...

Claims


Application Information

Patent Timeline
Patent Type & Authority Applications(United States)
IPC IPC(8): G06Q50/00G06F19/00G06Q50/22
CPCG06F19/322G06F19/327G06Q50/22G06F19/3487G06F19/3443G16H10/60G16H15/00G16H40/20G16H50/70
Inventor TAYLOR, ROGERMIDDLETON, STEVEN
Owner DR FOSTER
Why Eureka
Try Eureka