Quality control system for manufacturing industrial products

Inactive Publication Date: 2006-03-02
HITACHI LTD
View PDF5 Cites 104 Cited by
  • Summary
  • Abstract
  • Description
  • Claims
  • Application Information

AI Technical Summary

Benefits of technology

[0022] In view of this, the construction of a product quality control system has been demanded in which the complicated connecting structure in the manufacturing history data is searched to reach the fundamental cause of quality variation in addition to simply listing the candidates for the cause of product quality variation.
[0023] The object of this invention is to provide a product quality control system in which not only the candidates for the cause of variation in the product quality history data (Y) is listed from the manufacturing history data (X) but also the complicated connecting structure in the manufacturing history data (X) is searched to arrive at the fundamental cause of quality variation.
[0024] In order to achieve this object, according to this invention, there is provided a product quality control system for controlling the quality of the product manufactured through a plurality of manufacturing processes and at least one inspection process, comprising a manufacturing sequence information management apparatus for storing and managing the information on the order in which materials and parts used for manufacture of a product and a product in progress are input into each manufacturing process, a manufacturing management apparatus for storing the products, the materials and parts thereof and a product in progress uniquely with corresponding individual identification information and giving an instruction to manufacture the product based on the individual identification information, the sequence information supplied from the manufacturing sequence information management apparatus and a product manufacturing plan, and a causation analysis apparatus of quality variation for analyzing the cause of product quality variation based on the manufacturing history data corresponding to the individual identification information collected by the manufacturing history data collection apparatus arranged in each manufacturing process and the product quality history data corresponding to the individual identification information measured in the inspection process, wherein the causation analysis apparatus of quality variation includes a correlation analysis module of quality variation for calculating by collation the statistical correlation magnitude between

Problems solved by technology

The production of key devices requires the complicated, accurate process of many steps.
Even in the case where a

Method used


Image

  • Quality control system for manufacturing industrial products
  • Quality control system for manufacturing industrial products
  • Quality control system for manufacturing industrial products

Examples


embodiment 1

[0098] The basic form of the product quality control system according to a first embodiment of this invention is explained below with reference to FIGS. 1, 2, 3, 4, 11 and 16.

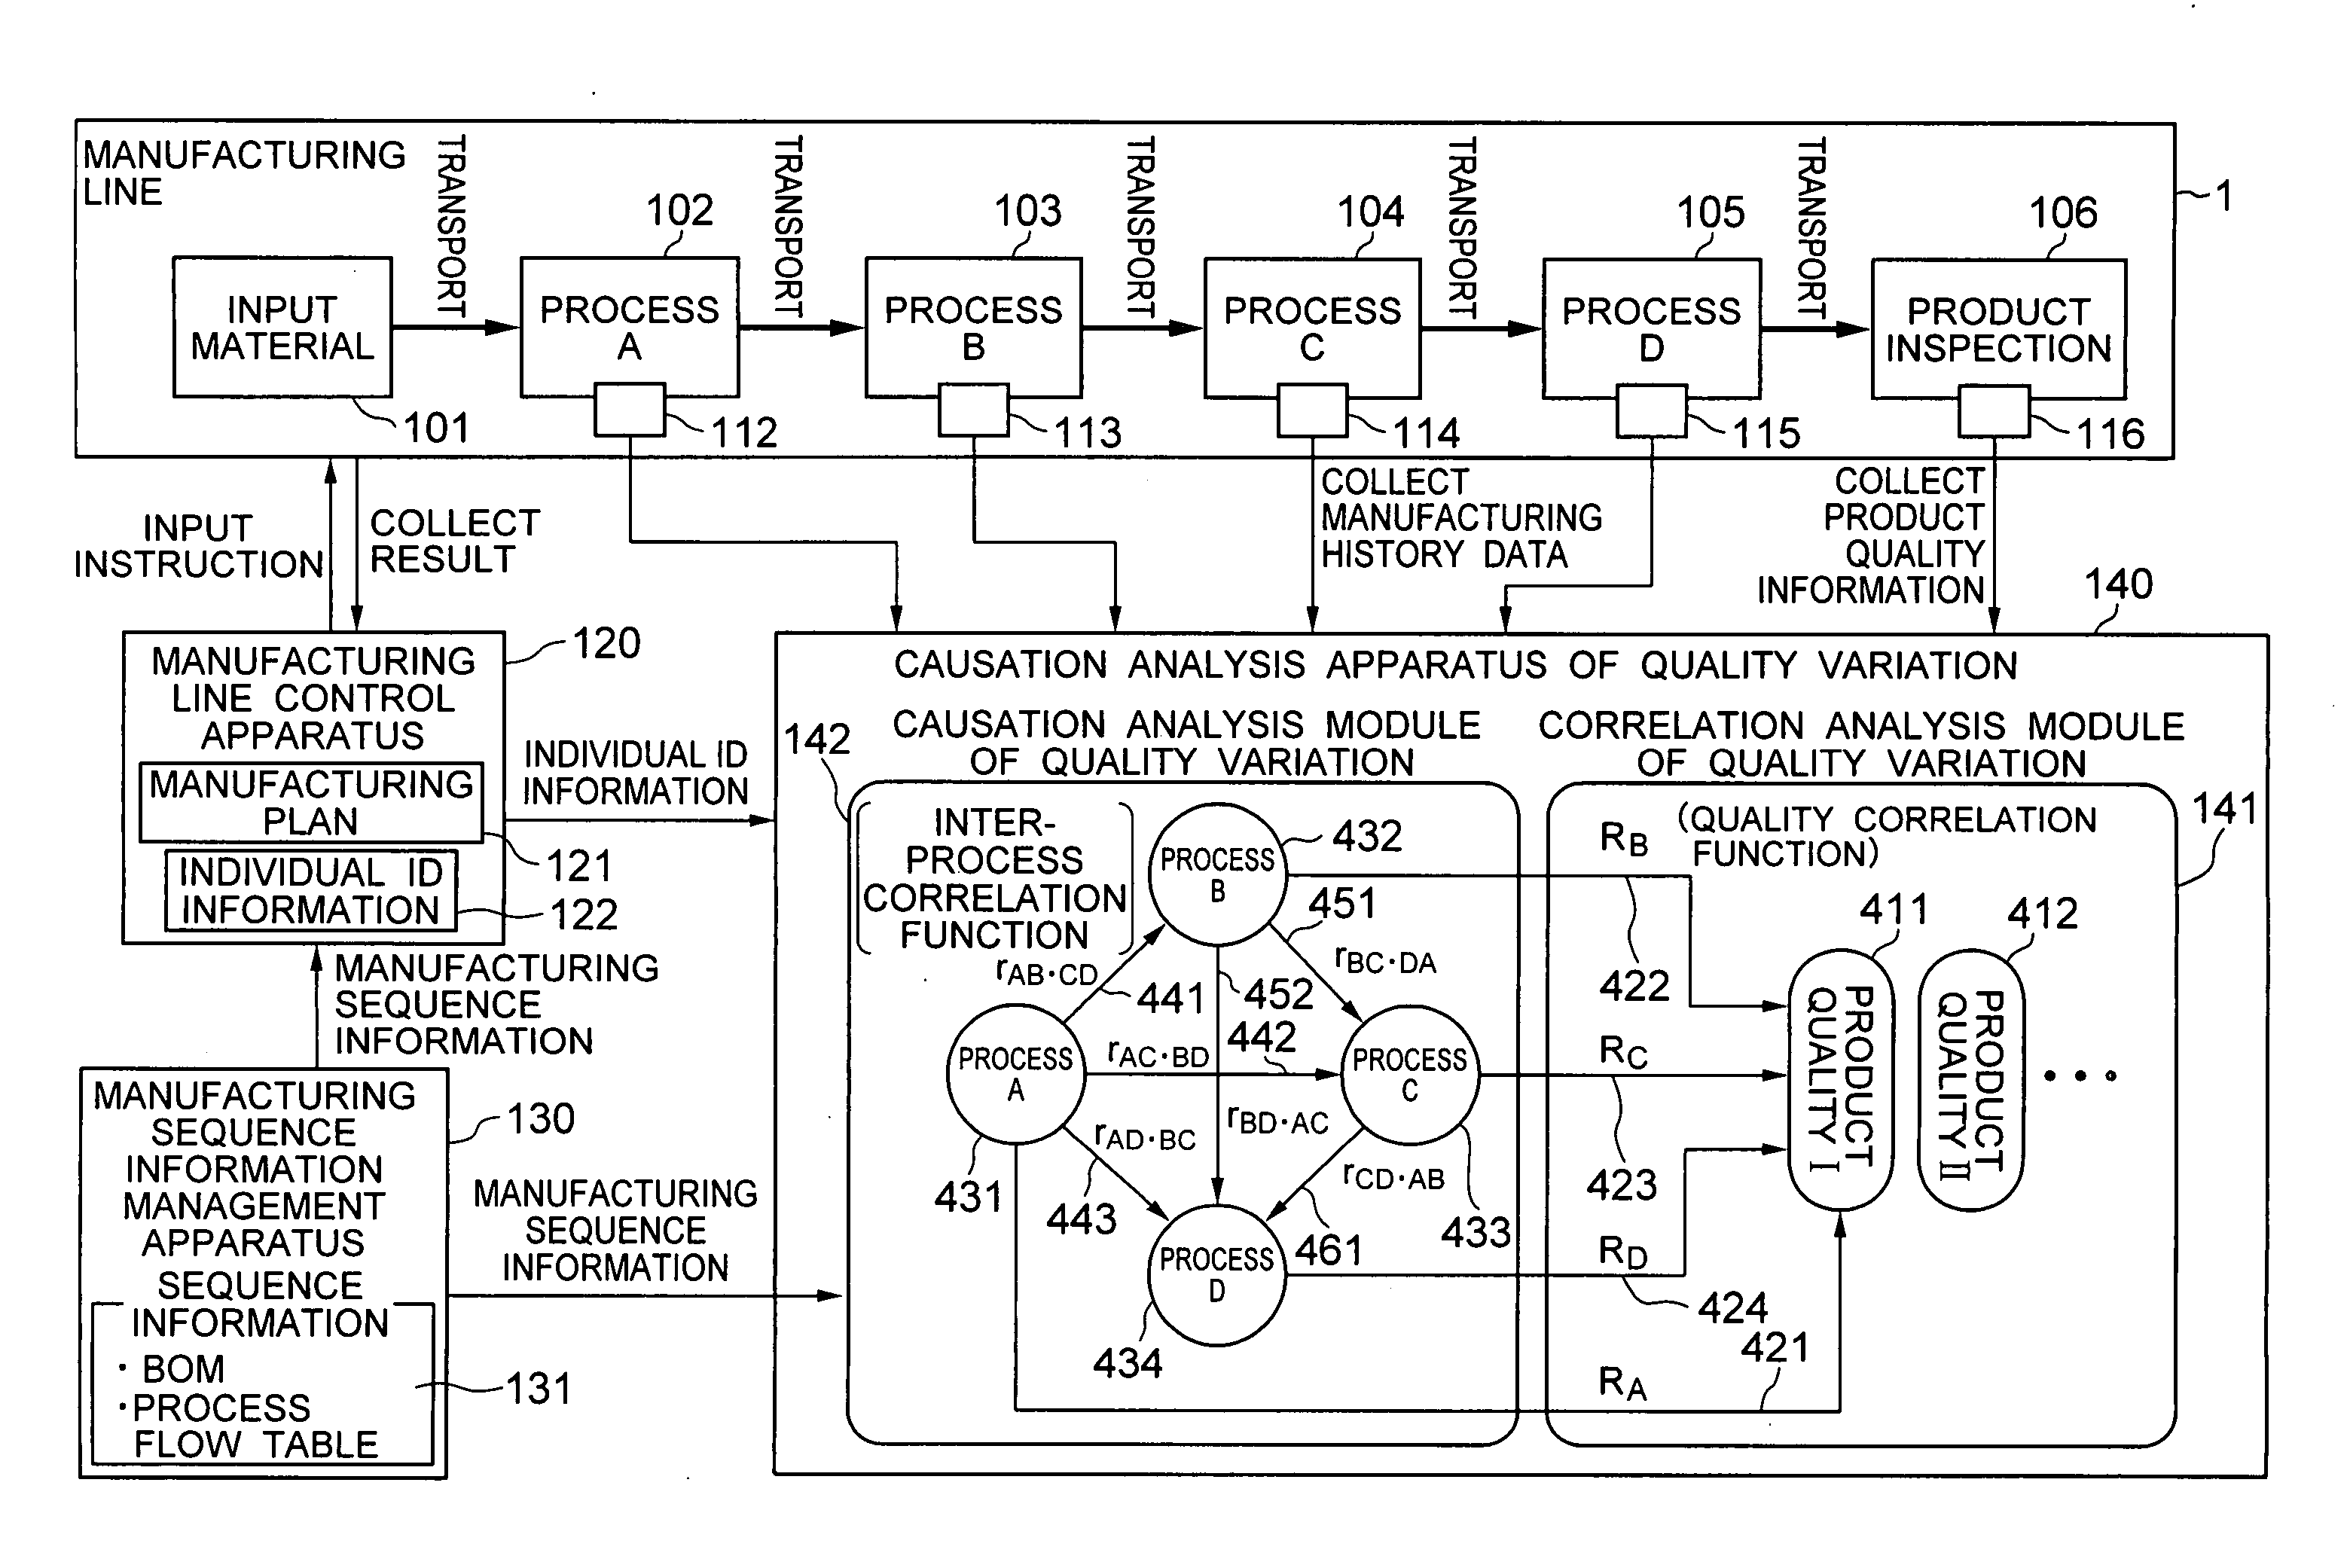
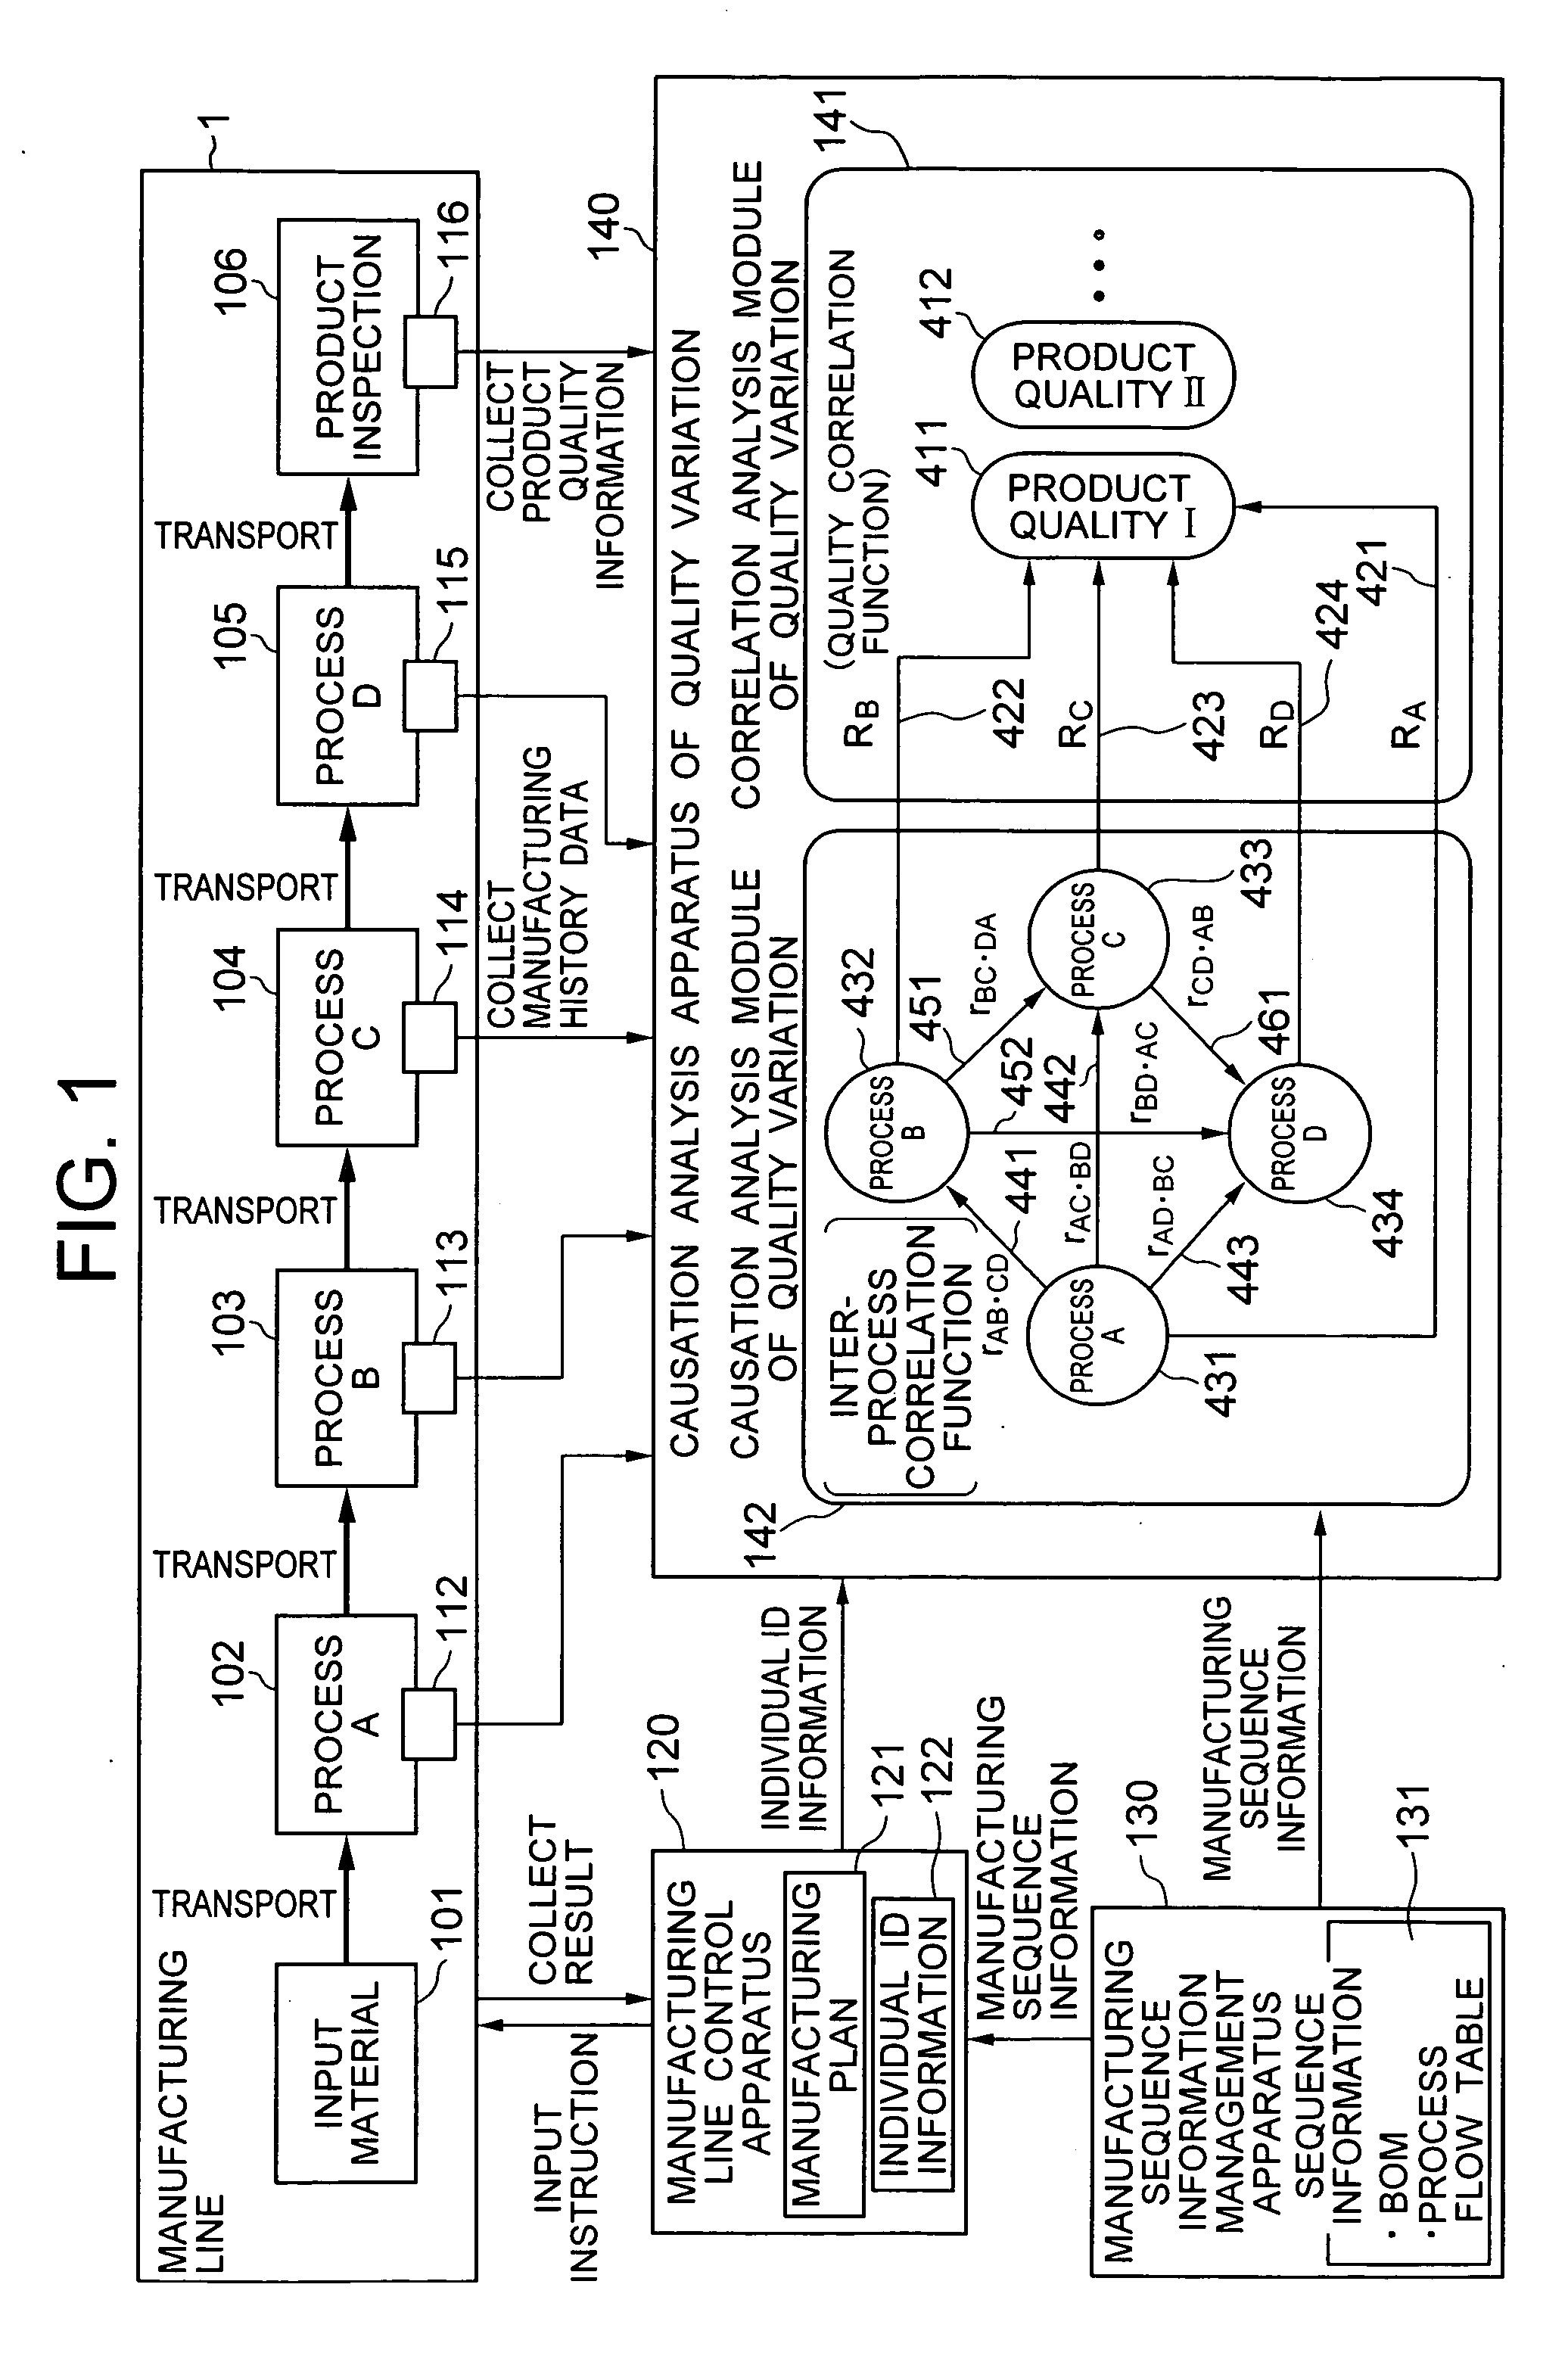
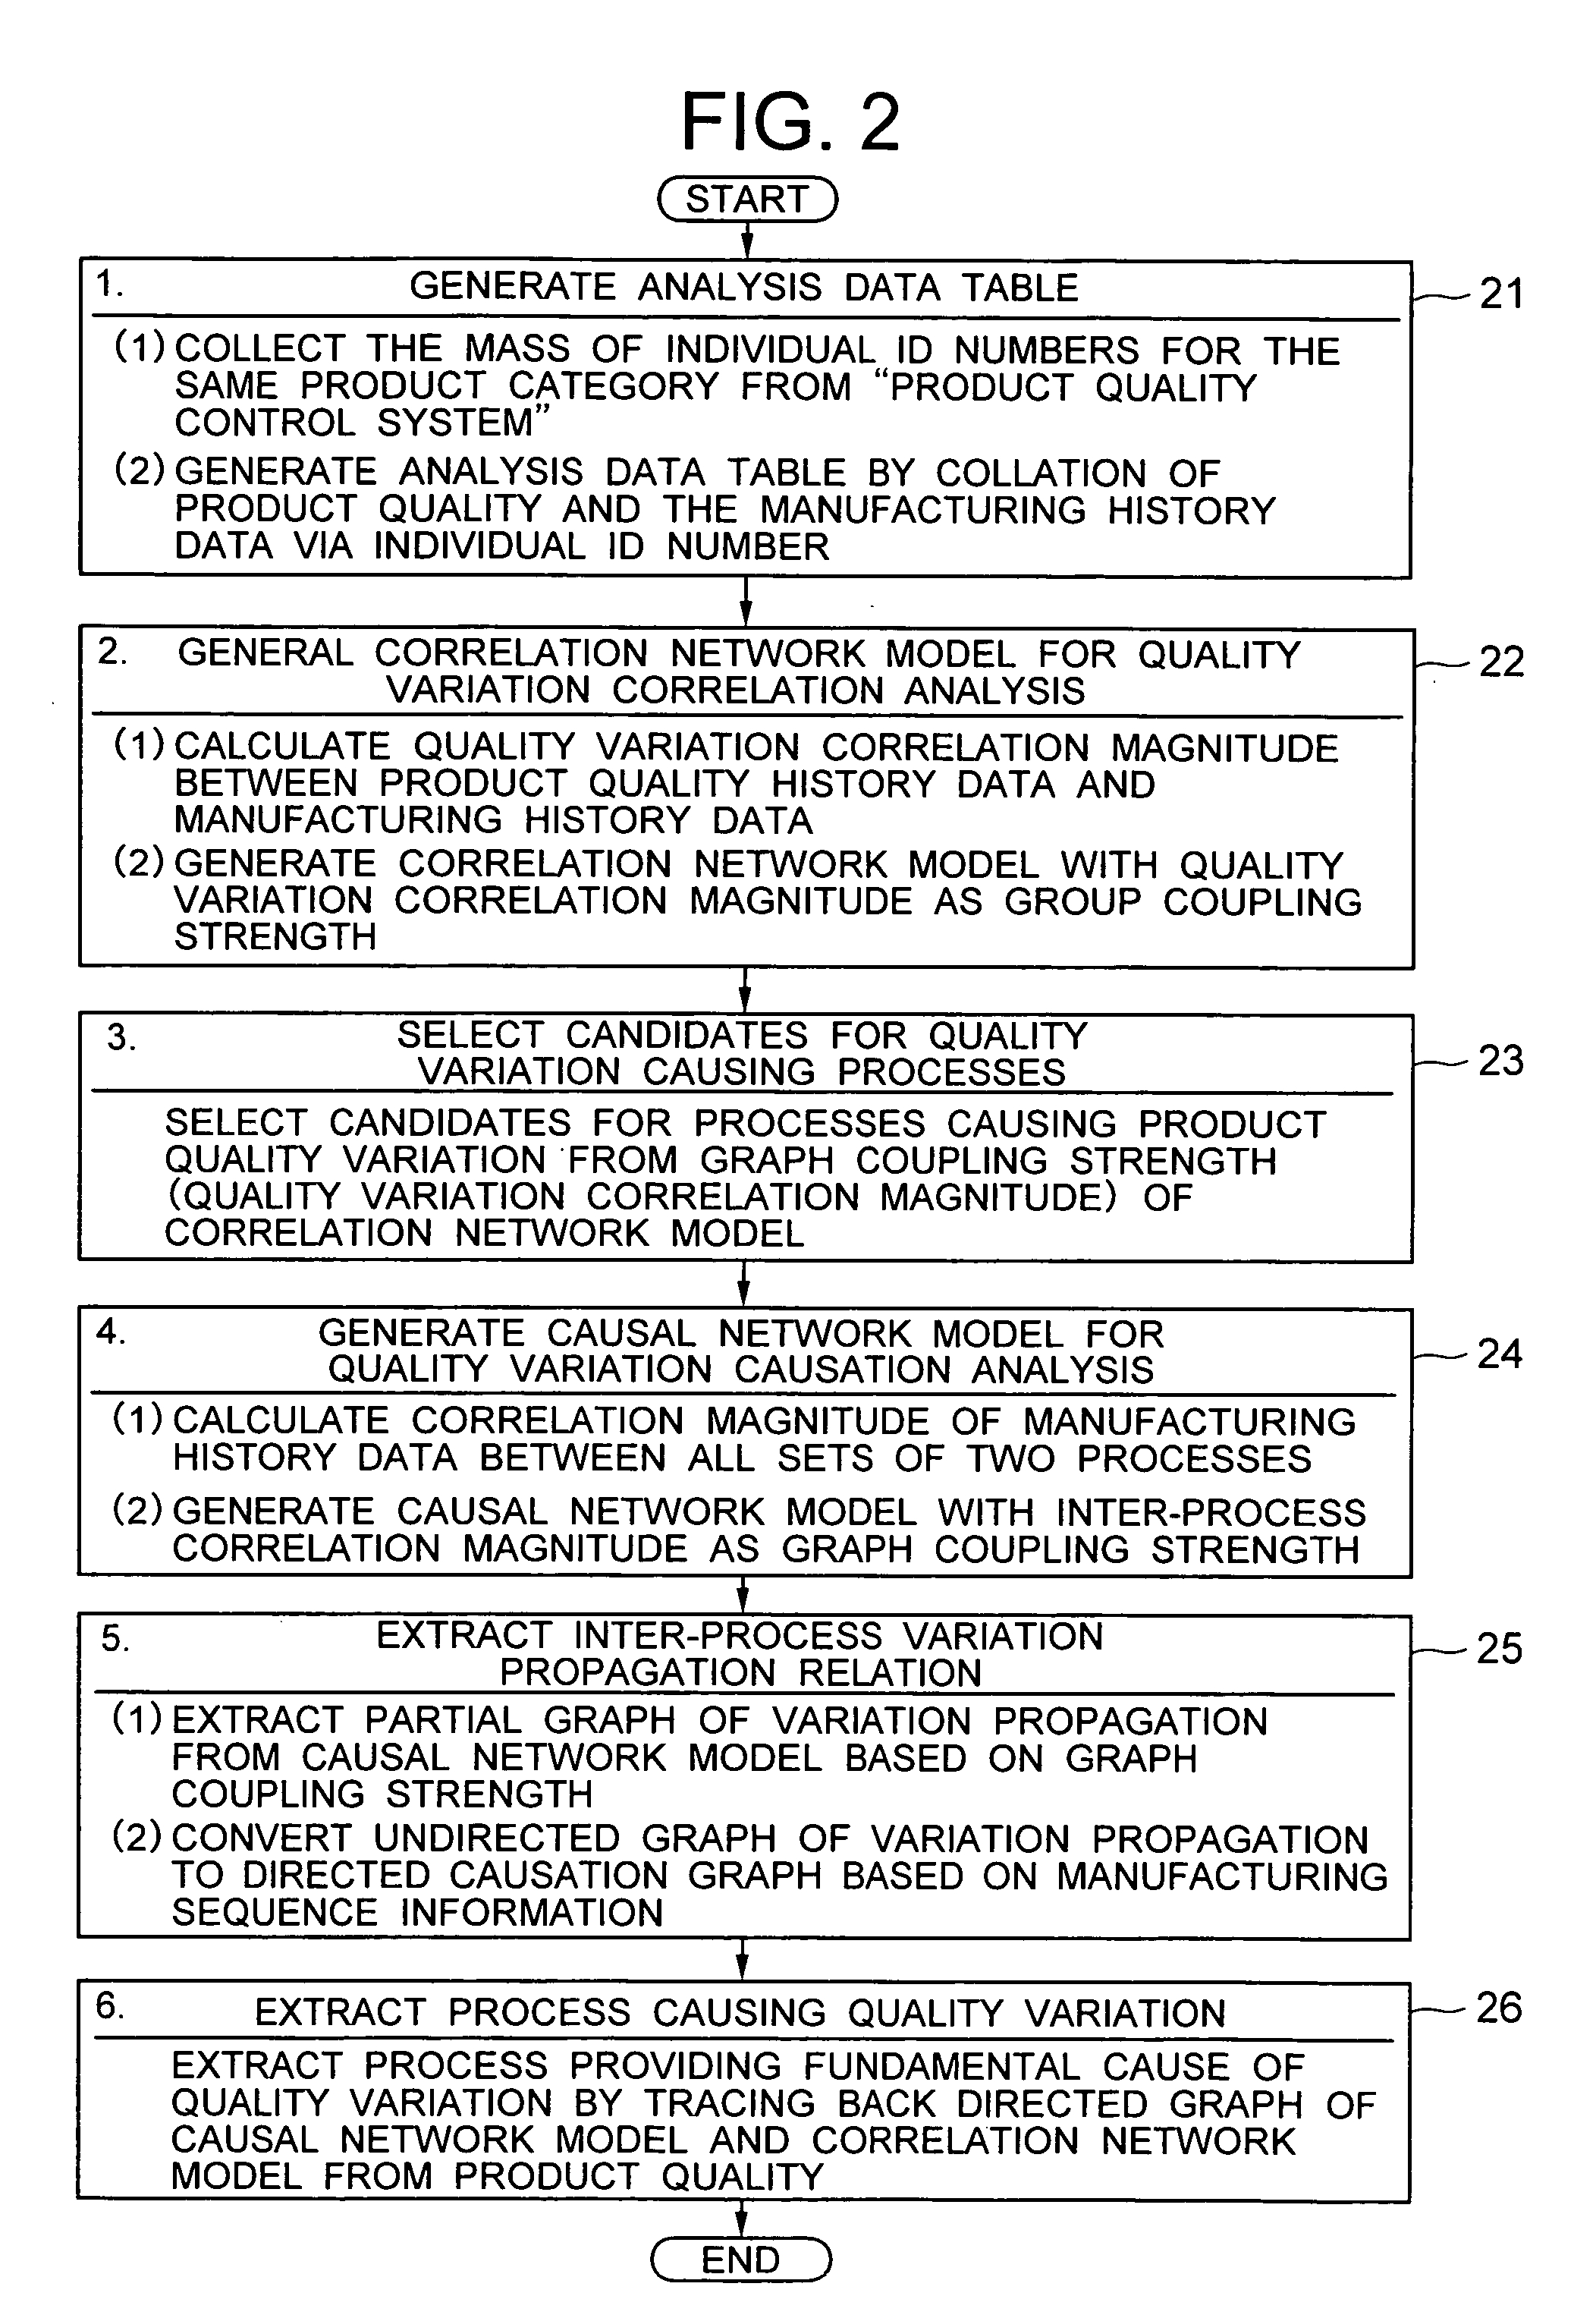
[0099]FIG. 1 is a diagram for explaining the product quality control system according to an embodiment of the invention. FIG. 2 is a diagram for explaining the steps of the process. FIG. 3 is a diagram for explaining an analysis data table for collating and comparing the product quality history data and the manufacturing history data to each other. FIG. 4 is a diagram for explaining the manufacturing BOM (bill of material) providing the manufacturing sequence information. FIG. 16 is a diagram for explaining a computer system to package the product quality control system according to the invention. FIGS. 11 to 15 are diagrams for explaining in detail the method of analyzing the cause of quality variation by a statistical network model.

[0100] First, the product quality control system according to an embodiment ...

embodiment 2

[0188] The product quality control system according to a second embodiment of the invention is explained below with reference to FIGS. 17 to 30. The second embodiment deals with the process of the invention for analyzing an actual product.

[0189]FIGS. 17 and 18A to 18C are diagrams for explaining a product subjected to quality variation cause analysis according to the invention. FIG. 17 shows the appearance of the product. FIG. 18A is a sectional view of a part A214, FIG. 18B a sectional view of a part B224, and FIG. 18C a diagram for explaining the assembly of a product 232.

[0190] The product 232 is assembled by fitting the part A214 and the part B224 with each other. The concave portion 214f of the part A214 and the convex fitting portion 224f of the part B224 constitute fitting portions, while the hole 214s of the part A214 and the convex portion (shaft) 224s of the part B224 make up clearance portions.

[0191] Specifically, when the fitting portions 214f, 224f are set in positio...

embodiment 3

[0215] A product quality control system according to a third embodiment of the invention is explained with reference to FIGS. 31 to 39. The third embodiment represents a case in which the manufacturing equipment causing the product quality variation is extracted automatically from a plurality of manufacturing equipments using only the input result information to each equipment.

[0216]FIG. 31 is a diagram showing the route of the manufacturing equipments used in each manufacturing process for a given product. FIG. 32 is a comparison table of the product quality history and the manufacturing equipment route information configured of the equipment identification numbers of the manufacturing equipments through which the individual material, part, product in progress or the product is passed. FIG. 33 is a comparison table of the manufacturing history data and the product quality history generated by conversion to permit calculation of the correlation magnitude or mutual correlation magni...


PUM


Abstract

In a quality control system for manufacturing industrial products, the product quality history and the manufacturing process history are collected and collated to calculate the correlation magnitude between the two histories. The candidates for the cause of quality variation hidden in the manufacturing processes are listed, and the correlation magnitude between all combinations of the variates of the manufacturing process history are calculated. Further, by utilizing the manufacturing sequence history used for an input plan, a causation connecting structure model between the manufacturing processes of the manufacturing line is automatically generated and automatically analyzed thereby to automatically extract the fundamental cause of quality variation from the candidates for the cause of quality variation. By doing so, the cause of quality variation of industrial products manufactured through a complicated process can be traced in a complicated connecting structure in the manufacturing history data.

Description

INCORPORATION BY REFERENCE [0001] The present application claims priority from Japanese application JP2004-247708 filed on Aug. 27, 2004, the content of which is hereby incorporated by reference into this application. BACKGROUND OF THE INVENTION [0002] This invention relates to a product quality control system for controlling the manufacture of products, or in particular to a quality control system for products manufactured through a plurality of processes and supply chain elements. [0003] A method and an apparatus for controlling the product quality on a semiconductor manufacturing line are disclosed in JP-A-2002-110493 (Patent Document 1) and JP-A-2000-252180 (Patent Document 2). These patents relate to a method and an apparatus for controlling the product quality based on the analysis of the causation connection of the product quality data and the manufacturing data. The product quality data to be analyzed is the electrical characteristics and yield of the semiconductor wafer, wh...

Claims


Application Information

Patent Timeline
IPC IPC(8): G06F19/00G05B19/418G06Q50/00G06Q50/04
CPCG06Q10/06
Inventor TAMAKI, KENJINONAKA, YOUICHI
Owner HITACHI LTD
Why Eureka
Try Eureka