
Device and system for verifying quality of bar codes

a bar code and verification system technology, applied in the field of optical readers, can solve the problems of affecting the capacity of a bar code symbol to be decoded by a reader, affecting the reading capacity of the bar code symbol, and unreadable bar codes

Active Publication Date: 2006-05-11
HAND HELD PRODS
View PDF54 Cites 45 Cited by
  • Summary
  • Abstract
  • Description
  • Claims
  • Application Information

AI Technical Summary

Benefits of technology

[0009] Processing circuitry for processing image signals corresponding to printed bar codes may be partially disposed within the hand held verification device and partially disposed within a host processor system spaced apart from and associated with the hand held verification device.
[0010] The hand held verification device

Problems solved by technology

Numerous factors can lead to a bar code being unreadable.
A bar code symbol can become degraded from extended use, for example, if a wand or other contact reader is swiped across a bar code numerous times. Dust or debris collecting on a bar code, as in a factory or other industrial setting can also negatively affect the capacity of a bar code symbol to be decoded by a reader.
The most prevalent forms of degradation actually occur during the printing process, for example ink smearing, improper encodation of the required information, use of improper ink resulting in insufficient bar to space contrast and improperly dimensioned photographic masters.
While standards have been developed for evaluating bar code symbols, the devices available for conducting such evaluations continue to exhibit limitations.
For example, some available bar code verification devices are large, bulky and expensive.
Still other available verification devices have been noted to be difficult to operate.

Method used


Image

  • Device and system for verifying quality of bar codes
  • Device and system for verifying quality of bar codes
  • Device and system for verifying quality of bar codes

Examples


example 1

[0085] An under sampled signal is processed. The initial bar code data prior to sampling is represented in the waveform diagram of FIG. 3B. The waveform of FIG. 3B is then sampled with sample spacing of Period2. The waveform diagram presented in FIG. 3B is a scan reflectance profile in which image data sample values are expressed in terms of ratio to maximum values. In the present example, a larger number corresponds to a higher reflectance, i.e., white is high. The sampled bar code data is shown in FIG. 3C with each sample point noted.

[0086] A sinc function is given by eq. 1-1 below, wherein a functional definition of the sinc function is conditional to avoid the singularity at 0. sinc⁡(x)⁢:=if⁢ [(x)=0,1,sin⁢ ⁢(π·x)π·x](eq. ⁢1⁢-⁢1)

[0087] A waveform diagram wherein values generated in accordance with the sinc function given by eq. 1-1 is presented in FIG. 3D. It is seen from the waveform diagram of FIG. 3D that the transfer function given by eq. 1-1 exhibits a decay such that hund...

example 2

[0094] An imaging lens 1070 of device 100 in an embodiment subject to analysis exhibits an approximately linear MTF fall off with spatial frequency. This MTF profile for a custom singlet such as might be used in this product is shown in FIG. 4B. This profile was created using the optics design program ZEMAX from the ZEMAX Development Corporation. The approximately linear MTF fall off of the lens results in reduced optical resolution and edge contrast at the higher spatial frequencies. The present custom lens has an MTF of approximately 71% at 20 cycles per mm in imager space. This optical pattern is imaged on a one dimensional CCD image sensor converting the optical representation of the bar code pattern under test to an electrical waveform. In an analogous fashion, the electrical signal exhibits an approximately linear fall off with frequency in the electrical domain.

[0095] An EAN128 999999 / R1 symbol is sampled by capturing a 1D frame of image data. The file length of the input si...


PUM


Abstract

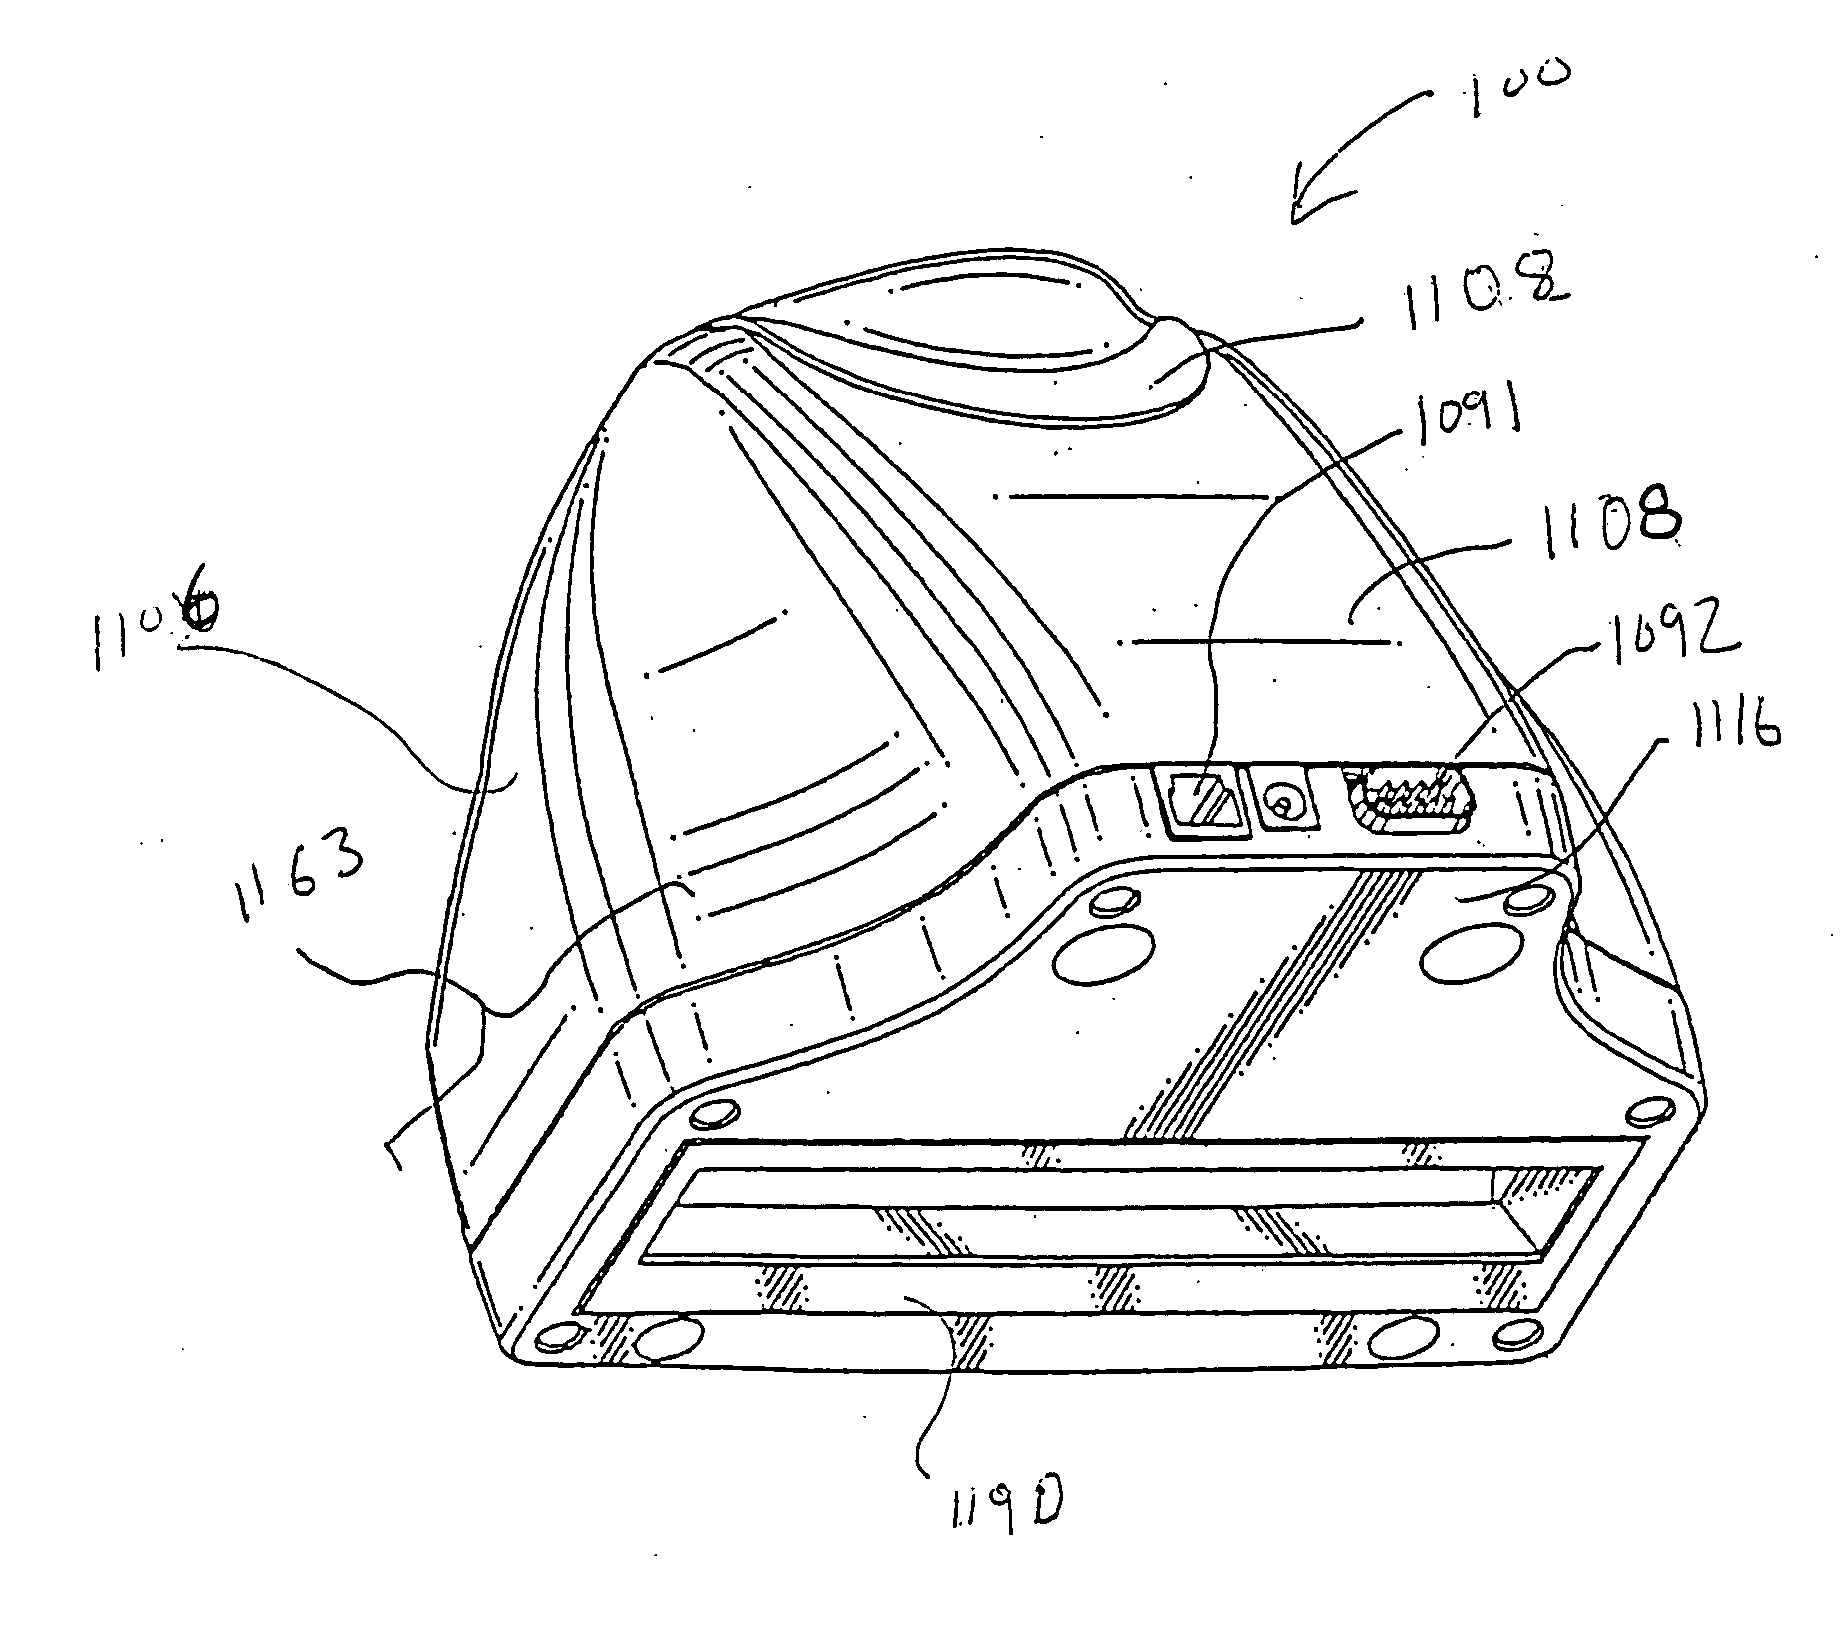
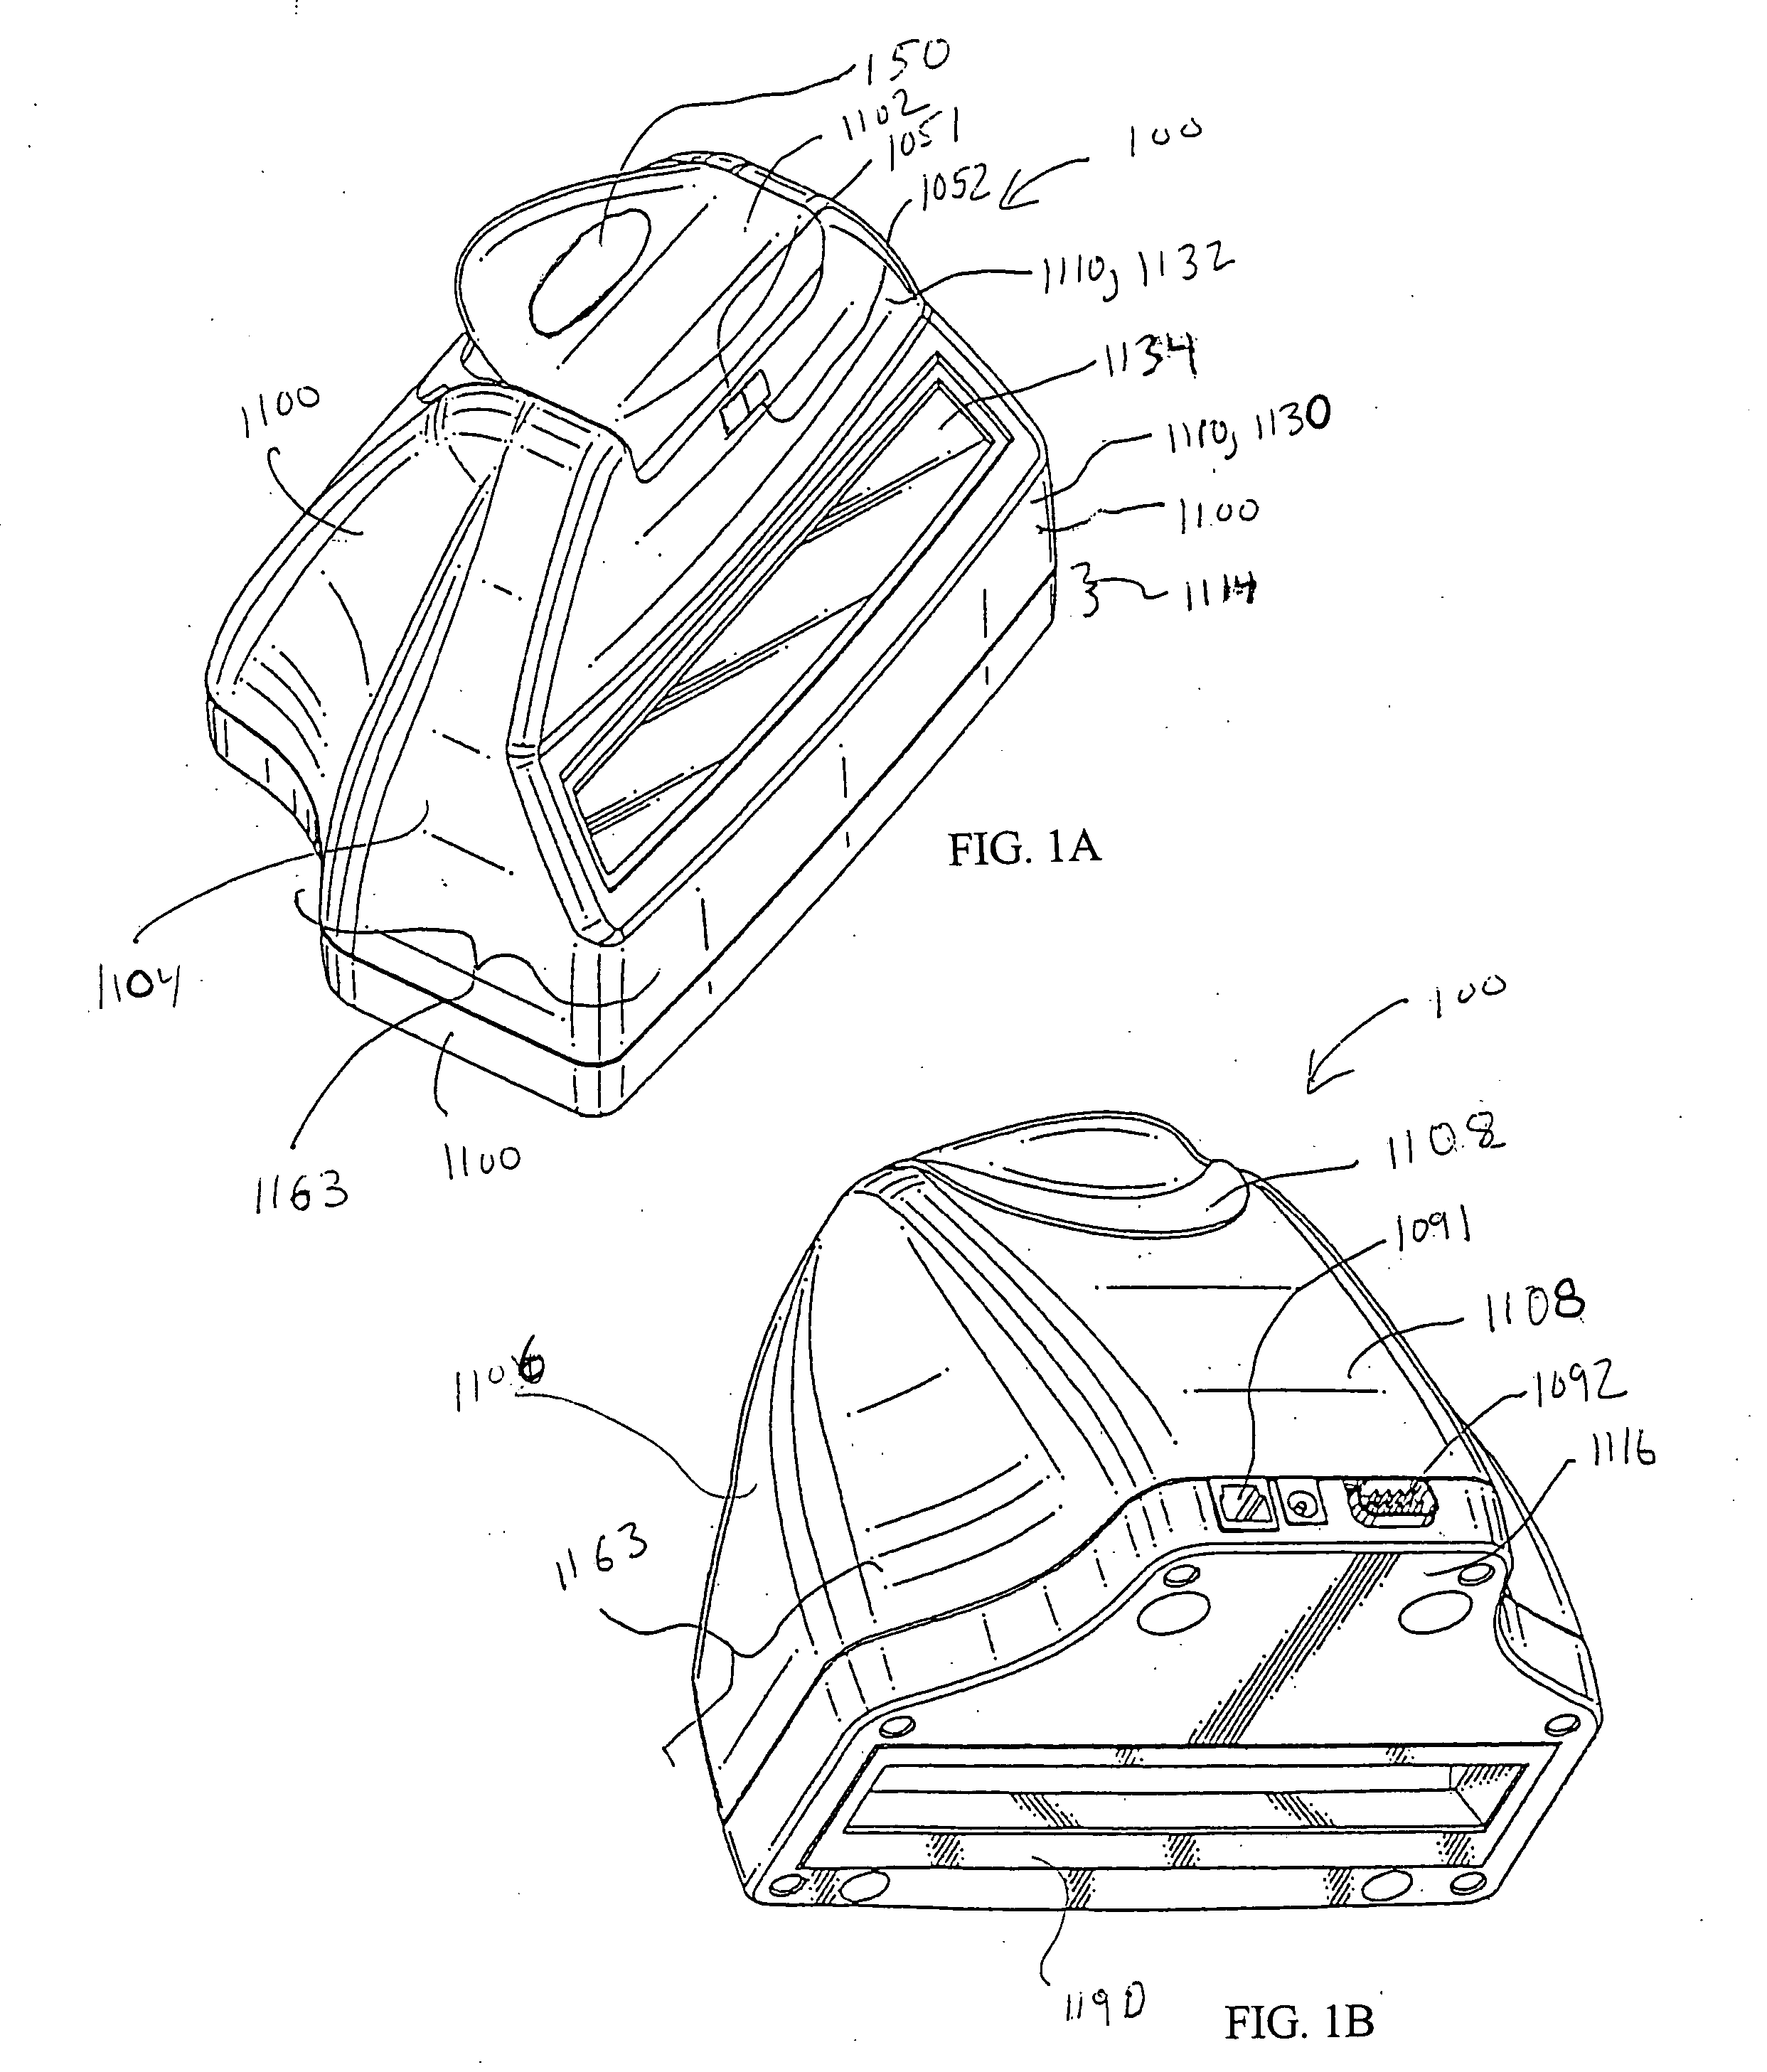
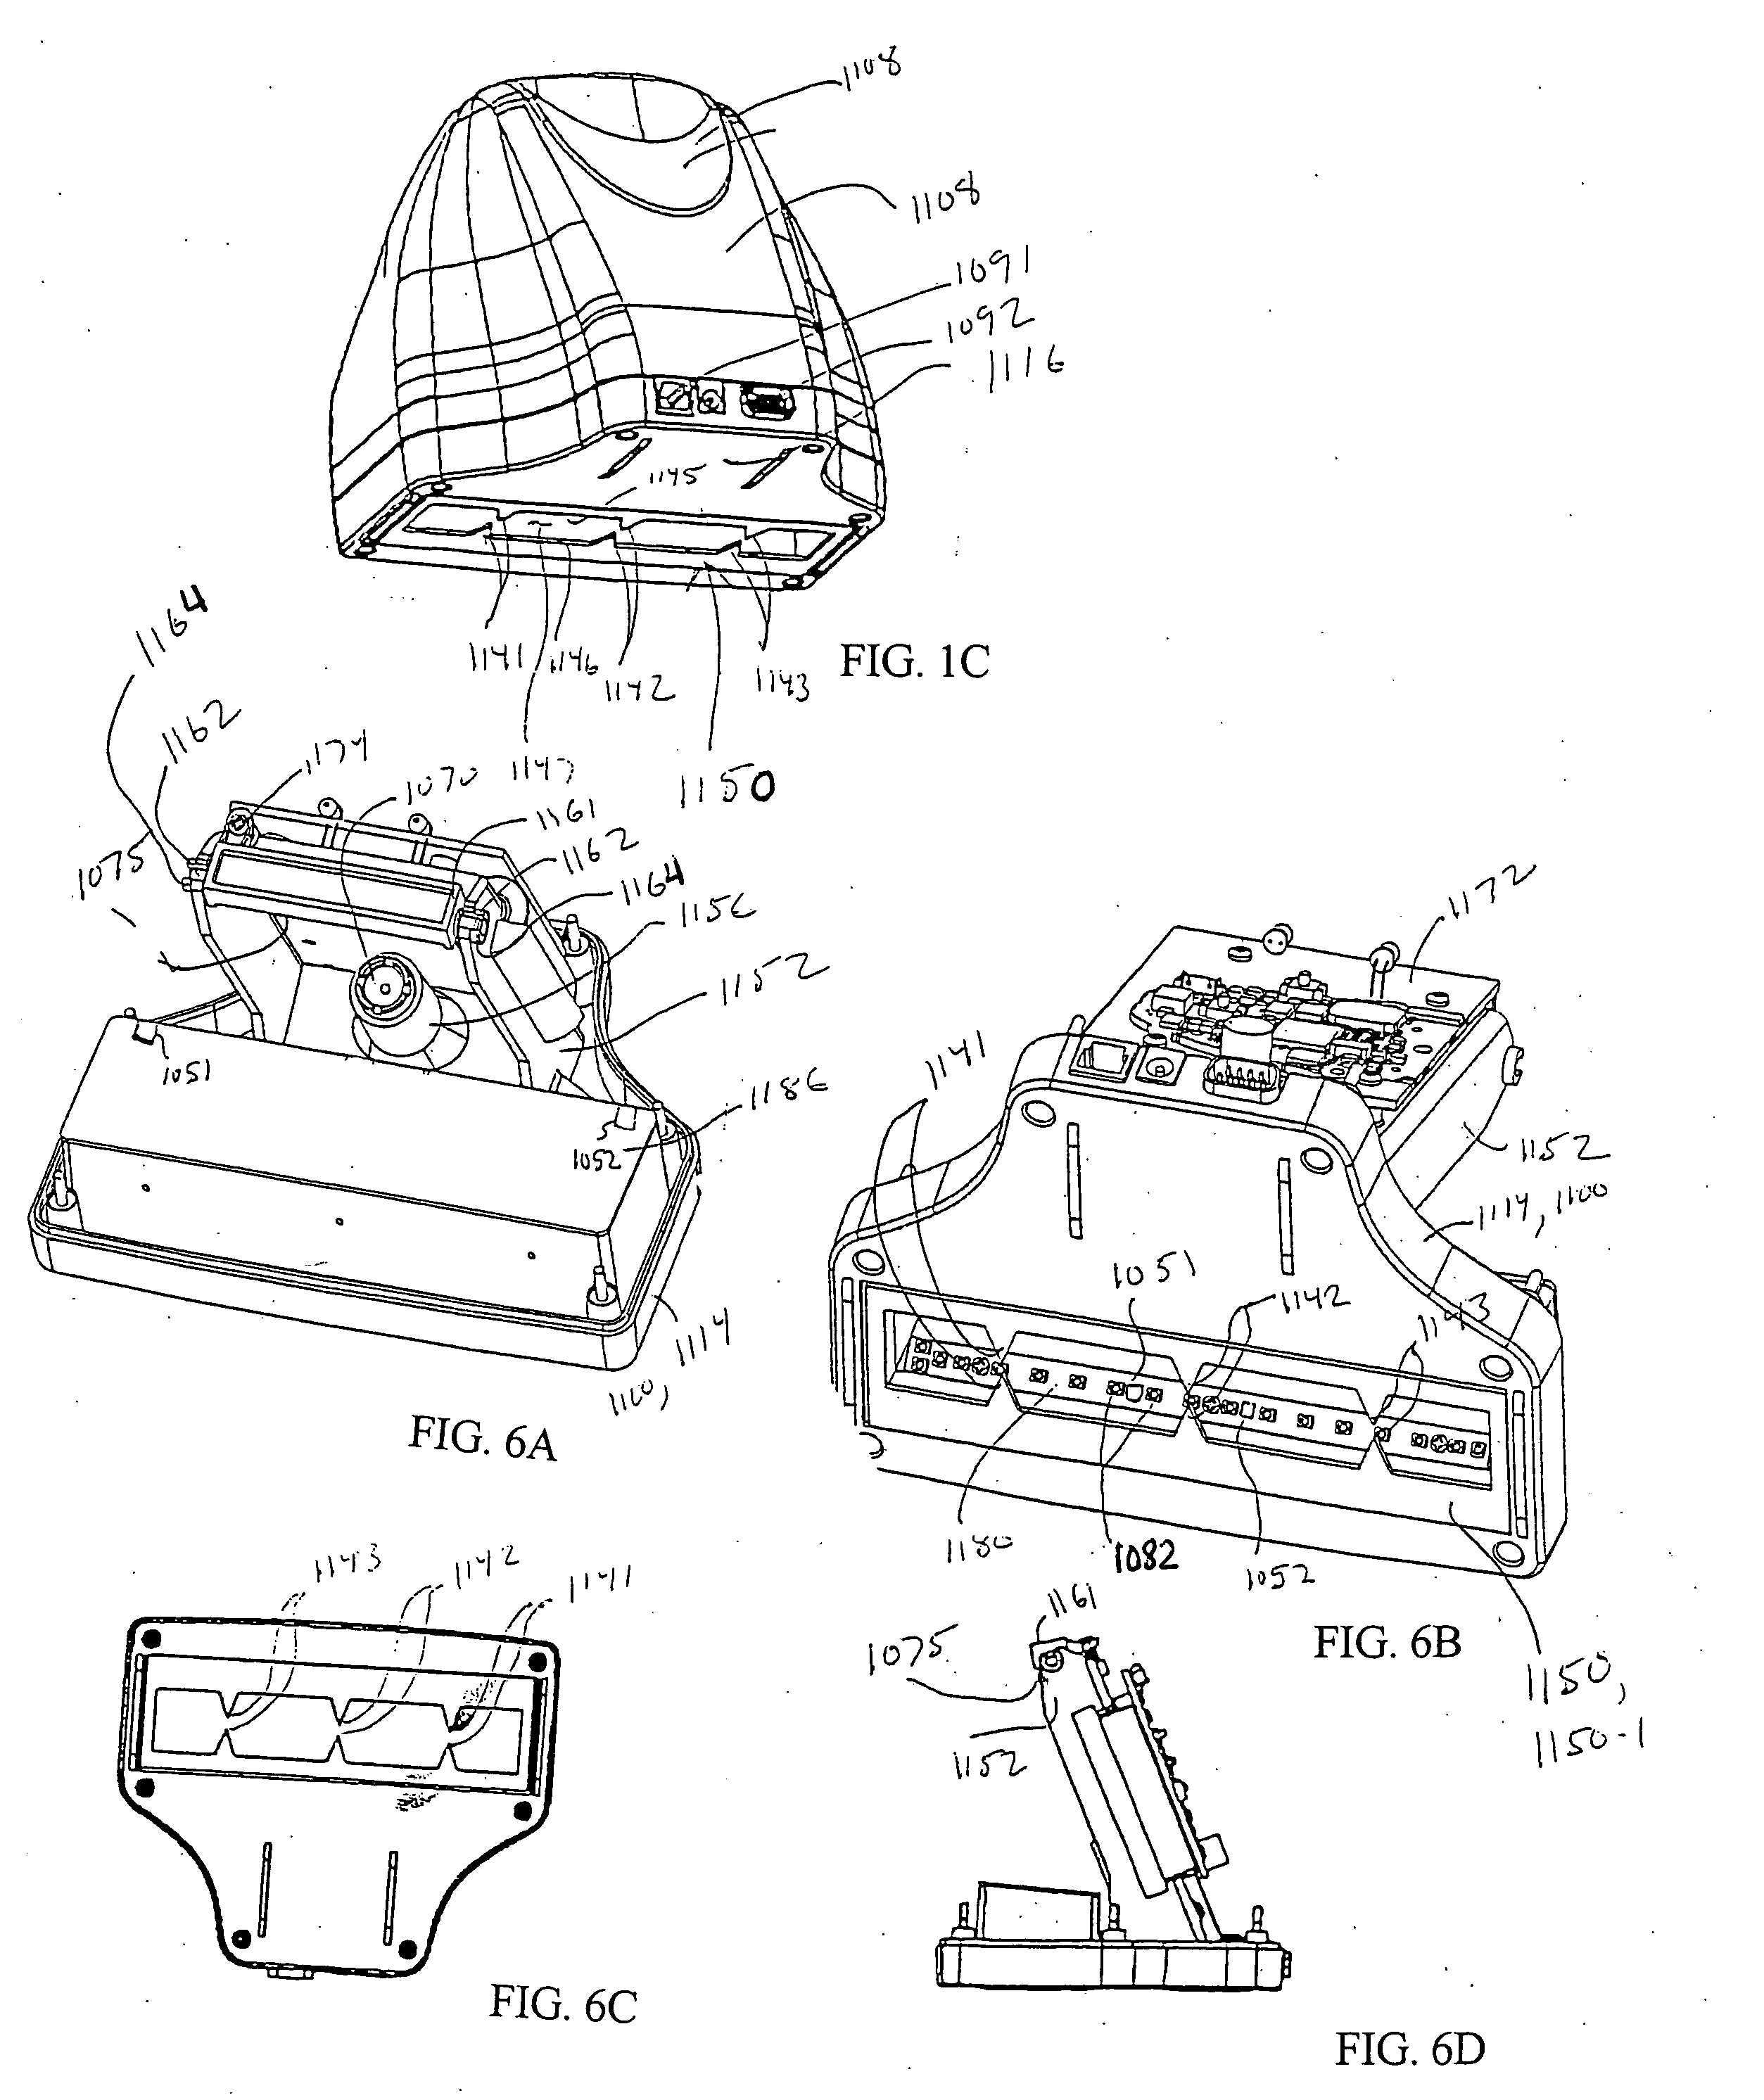
The present invention is a bar code verification device having an ergonomic form factor characterized by a domed hand held trigger and a viewing window. The verification device may be disposed in a network that includes a host processor system and other bar code reading devices which may include other bar code verification devices. Processing circuitry for processing image signals corresponding to printed bar codes may be partially disposed within the hand held verification device and partially disposed within a host processor system spaced apart from and associated with the hand held verification device. The hand held verification device may be in wireless communication with the host processor system to which it is associated. The bar code verification system may include signal enhancement modules which interpolate constructed pixel values from actual pixel values and which correct for signal degradation resulting from high frequency spatial sampling.

Description

FIELD OF THE INVENTION [0001] The invention relates generally to optical readers and particularly to optical readers which in addition to decoding bar codes measure characteristics of decodable indicia. BACKGROUND OF THE INVENTION [0002] Bar codes are available in a variety of symbologies. One dimensional symbologies include Code 128, Code 39, Interleaved 2 of 5, Codabar, Code 93, Code 11, and MSI. Stacked 1 symbologies include PDF, Code 16K and Code 49. 2D symbologies include Aztec, Datamatrix, and Qcode. Perhaps the most omnipresent bar code symbology is the 1D symbology known as UPC / EAN. UPC / EAN bar codes are standardly used to mark retail products throughout North America, Europe and several other countries throughout the worlds. [0003] Numerous factors can lead to a bar code being unreadable. A bar code symbol can become degraded from extended use, for example, if a wand or other contact reader is swiped across a bar code numerous times. Dust or debris collecting on a bar code,...

Claims


Application Information

Patent Timeline
IPC IPC(8): G06K7/10
CPCG06K7/089G06K7/10851G01N21/8806
Inventor BISS, CHARLES E.HAVENS, WILLIAM H.ROBINSON, MICHAEL D.BALSCHWEIT, PAULFITCH, TIMOTHY R.MCCALL, MELVIN D.GOMEZ, GARRISONMCCLAUDE, MARK A.LONGACRE, ANDREW JR.SONNEVILLE, EUNICE
Owner HAND HELD PRODS
Learn More