Association between markers in the leptin gene and carcass traits in commercial feedlot steer and heifers
- Summary
- Abstract
- Description
- Claims
- Application Information
AI Technical Summary
Benefits of technology
Problems solved by technology
Method used
Image
Examples
example 1
Animals and Phenotypic Data Collection
[0196] A total of 180 cattle (139 steers and 41 bulls) sired by Angus Charolais or University of Alberta Hybrid bulls were managed and tested for growth and feed efficiency under feedlot conditions. Feed intake was measured for each animal using the GrowSafe® automated feeding system (GrowSafe® Systems Ltd., Airdrie, Alberta, Canada).
[0197] Complete performance and efficiency data was available on a total of 150 animals, excluding all the bulls in test two (total of 21 animals) plus nine other animals that died or had to be excluded from the test due to health and other related problems. Weight measurements of all animals were taken weekly. The performance data analyzed include average daily gain (ADG), on-test metabolic midpoint weight (MWT), residual feed intake (RFI), feed conversion ratio (FCR), average daily dry matter intake (DMI), metabolizable energy intake per unit metabolic weight (MEWT0.75), and partial efficiency of growth (PEG). E...
example 2
Blood Sampling, DNA Extraction and SNP Detection
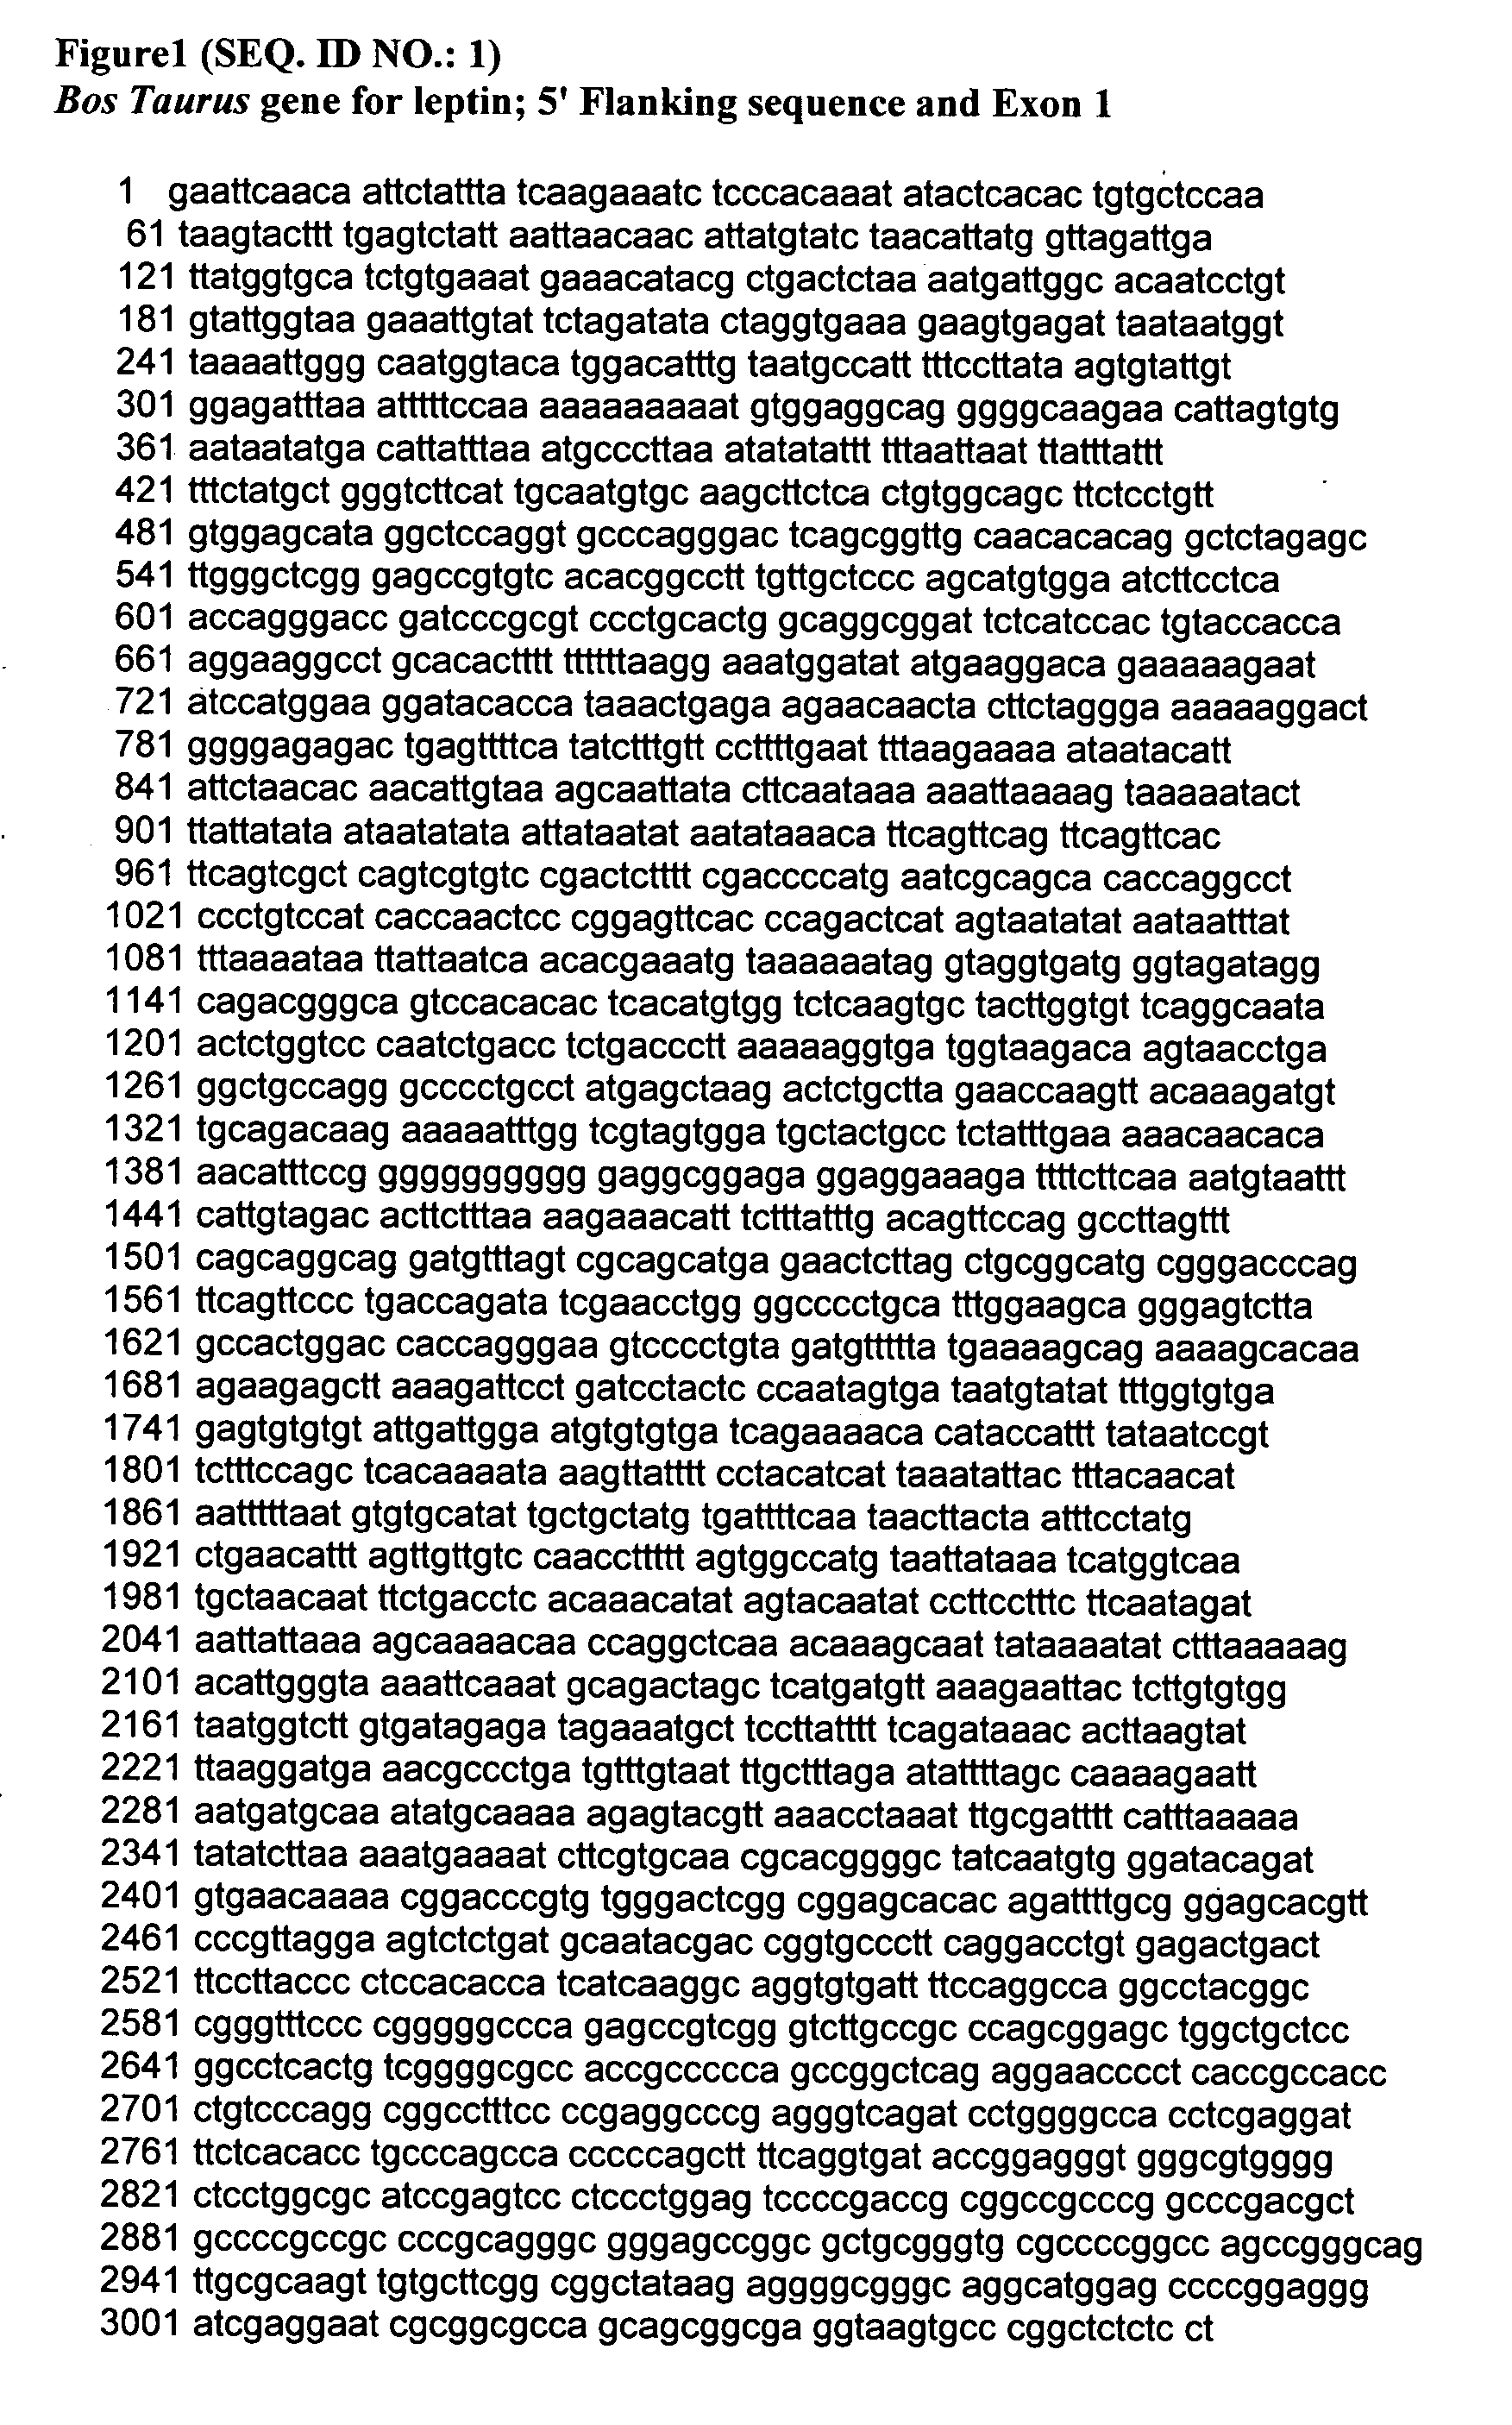
[0205] Blood samples were collected from each animal at start of the feed intake test from which genomic DNA was extracted using a modified saturated salt phenol / chloroform procedure (Sambrook et al., 1989). Identification of polymorphisms in the bovine leptin promoter utilized SEQ ID NO: 1 (GenBank accession number AB070368, Taniguchi et al., 2002). Genomic DNA from a panel of 16 animals was amplified by polymerase chain reaction using forward and reverse primers designed to cover the entire bovine leptin promoter region. The PCR products from each animal were sequenced on a Beckman CEQ 8000 Genetic Analysis System (Beckman Coulter Instruments, Inc.). Sequence data for each animal were analyzed to identify putative single nucleotide polymorphisms.
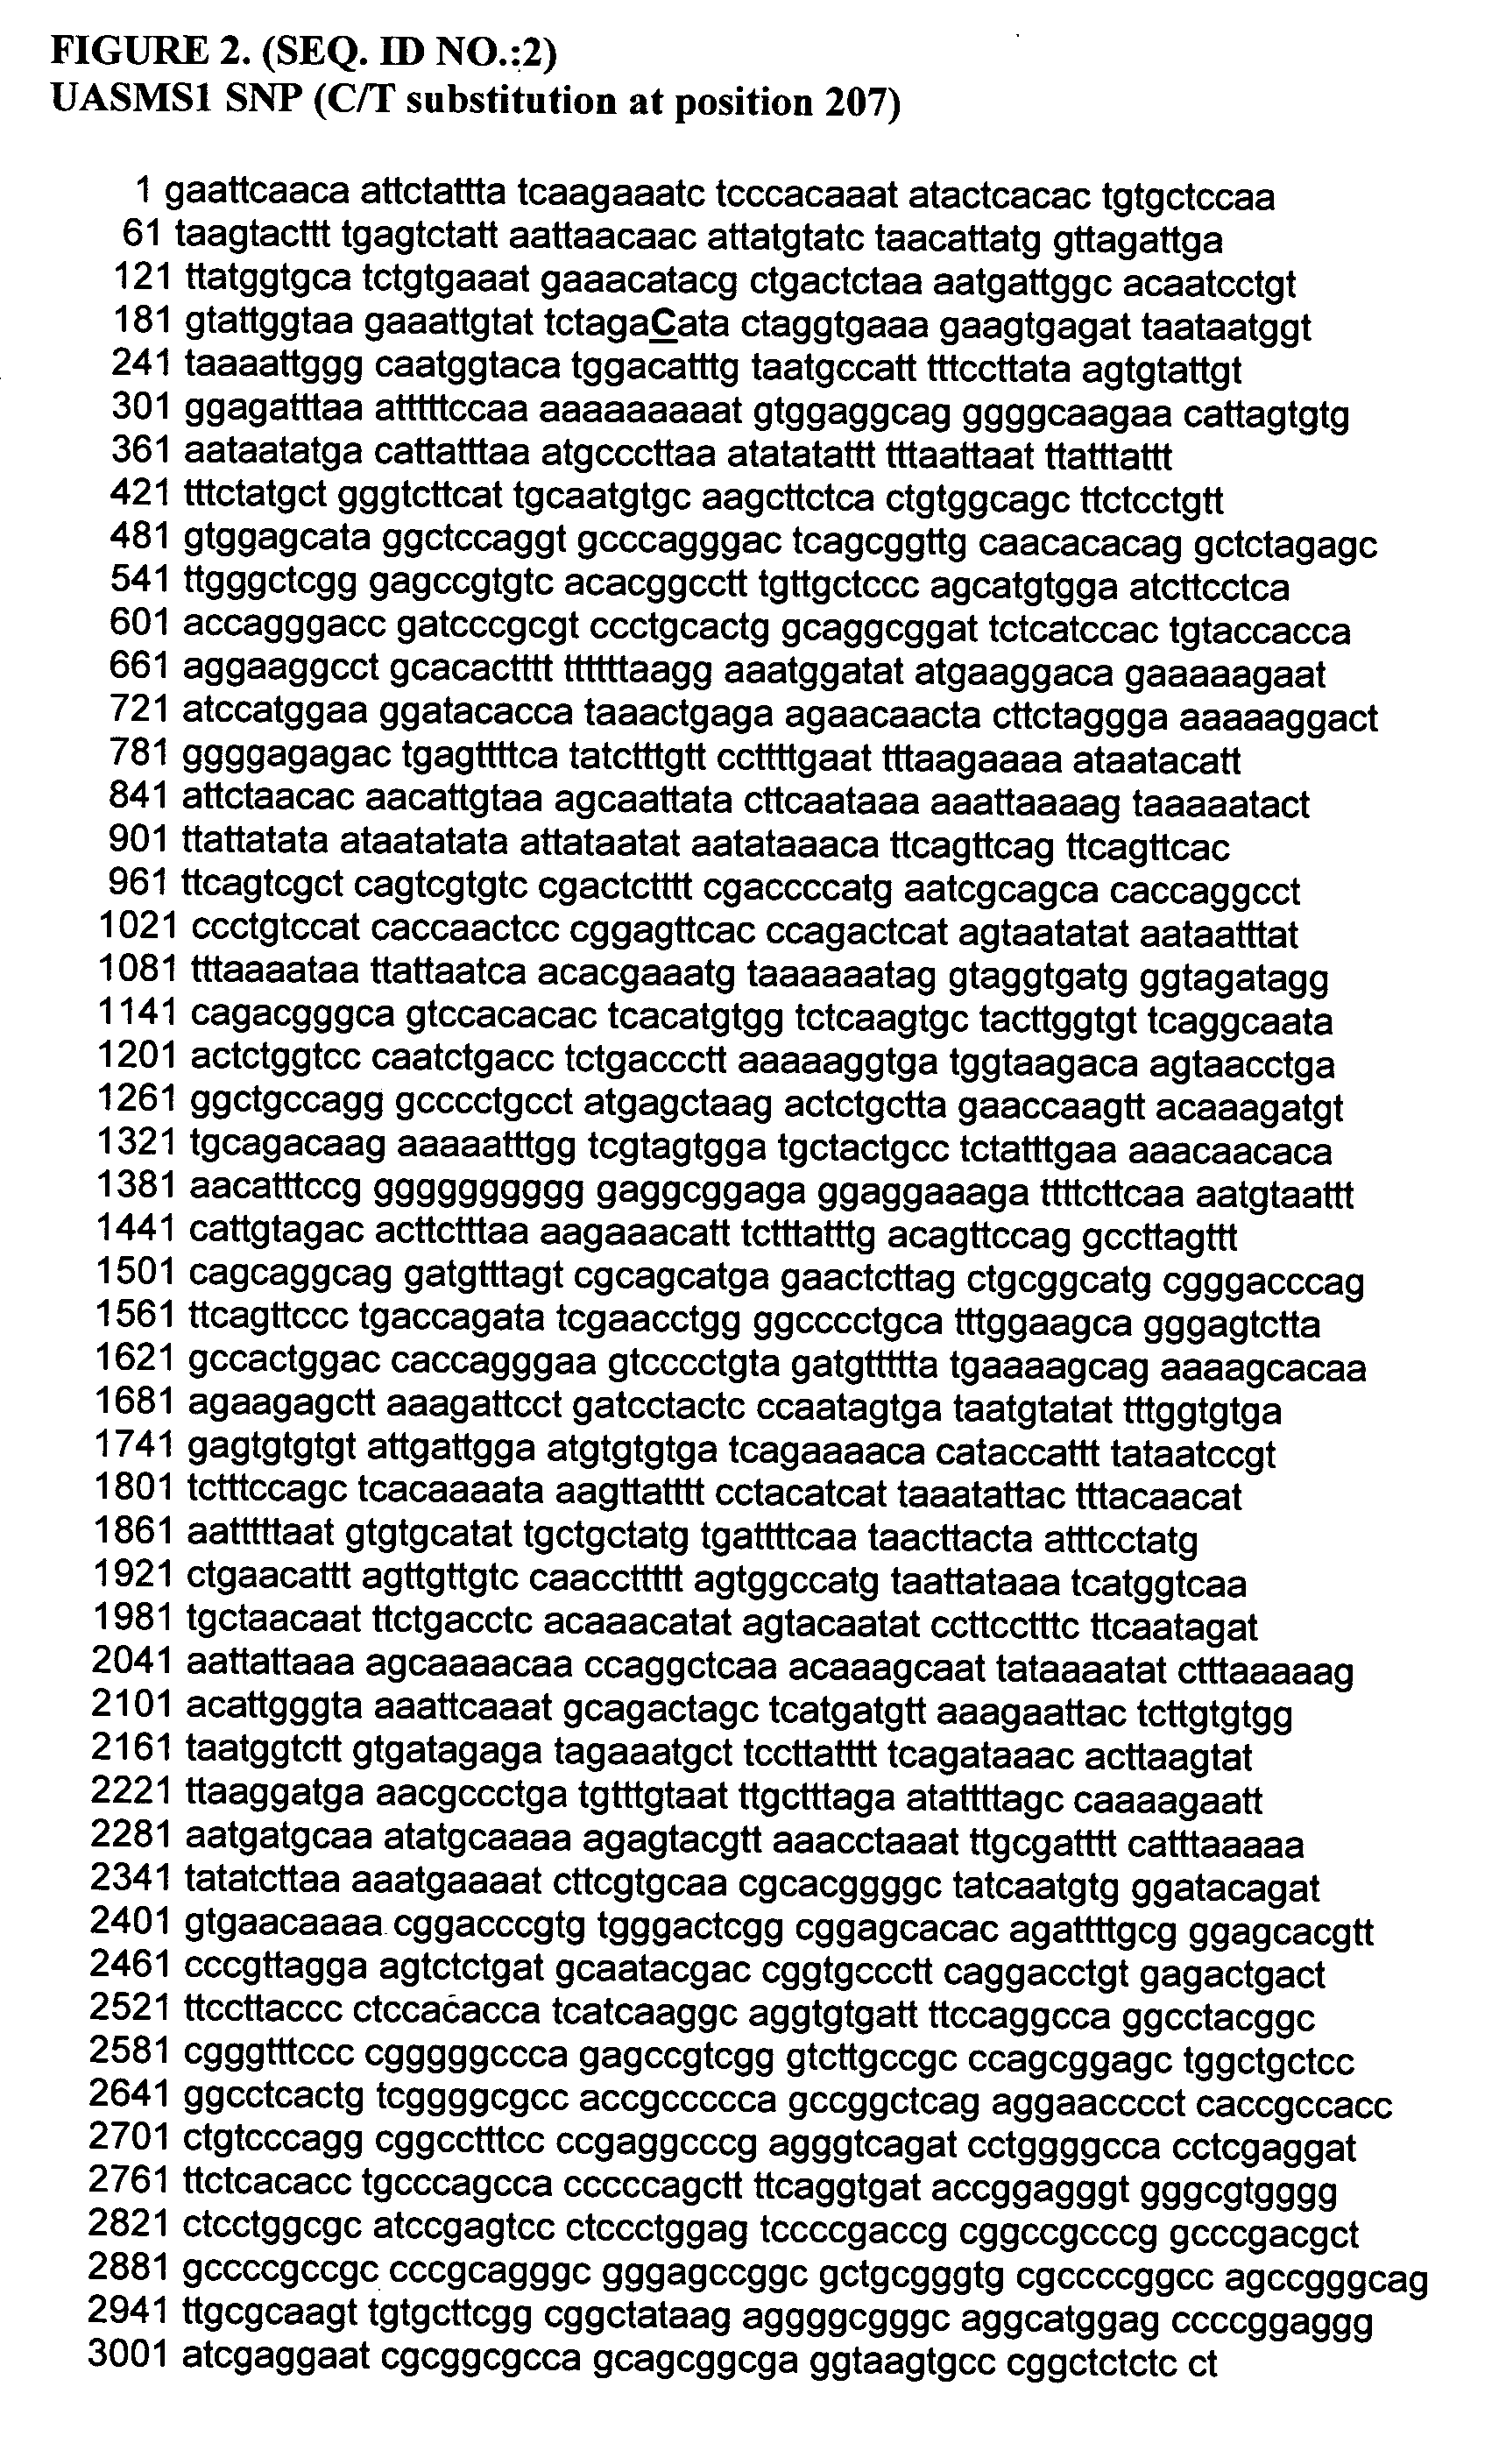
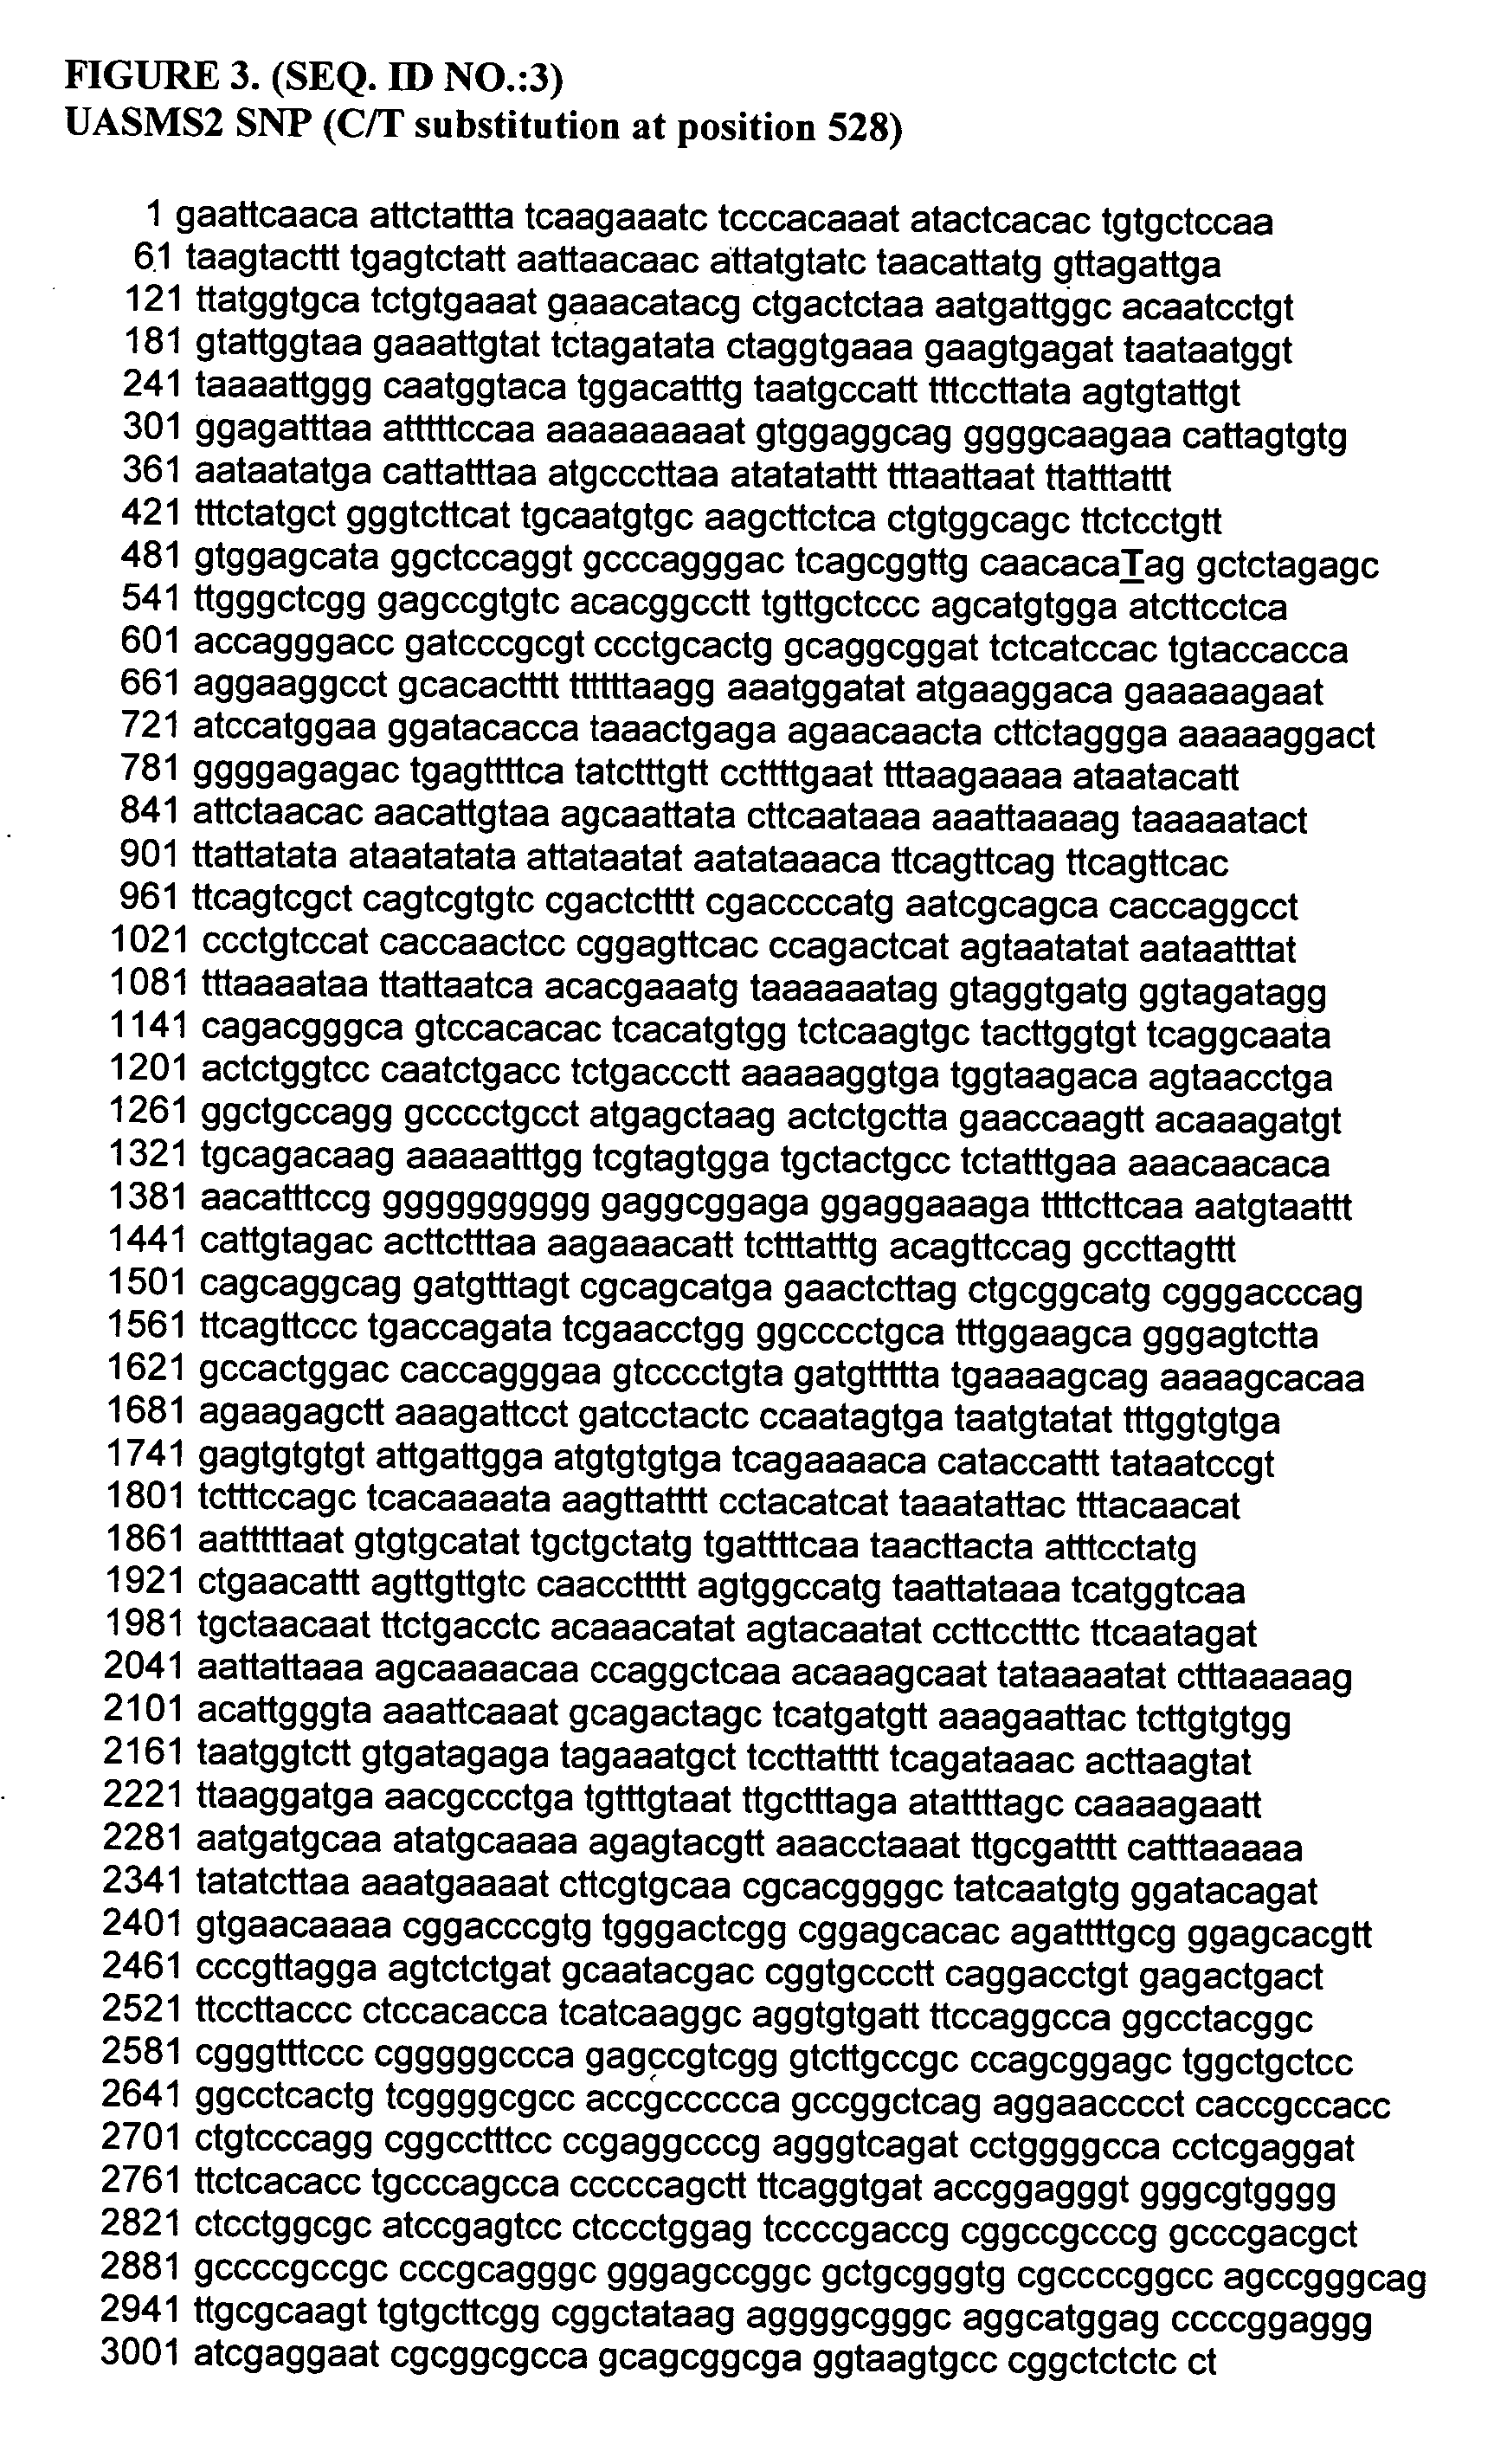
[0206] The analysis identified three new single nucleotide polymorphisms (SNPs), namely UASMS1, UASMS2 and UASMS3 located, respectively at positions 207 (C / T substitution), 528 (C / T substit...
example 3
Genotype and Allele Frequencies
[0210] Tables 2 and 3 show the genotype frequencies and chi-square tests of Hardy-Weinberg equilibrium for the different polymorphisms in the experimental and commercial populations, respectively. Observations of the genotypes revealed that all animals that had genotypes CC, CT or TT of UASMS1 also had genotypes CC, CG or GG of UASMS 3, respectively. Thus, the two polymorphisms were in complete linkage disequilibrium and were designated together as UASMS1-3. The T-G alleles of UASMS1-3 were 59% each in the experimental population and the T alleles of UASMS2 were 21% and EXON2-FB 44%. Similarly, the frequencies of the T-G or T alleles of UASMS1-3, UASMS2 and EXON2-FB were 48%, 20% and 53%, respectively, in the commercial population. Chi-square analyses between observed and expected genotypes showed that the frequencies of all the genotypes of all three polymorphisms did not deviate significantly from Hardy-Weinberg proportions in both populations (P>0....
PUM
| Property | Measurement | Unit |
|---|---|---|
| Electrical conductance | aaaaa | aaaaa |
| Dynamic viscosity | aaaaa | aaaaa |
| Volume | aaaaa | aaaaa |
Abstract
Description
Claims
Application Information
 - R&D
- Intellectual Property
- Life Sciences
- Materials
- Tech Scout
- Unparalleled Data Quality
- Higher Quality Content
- 60% Fewer Hallucinations
Browse by: Latest US Patents, China's latest patents, Technical Efficacy Thesaurus, Application Domain, Technology Topic, Popular Technical Reports.
© 2025 PatSnap. All rights reserved.Legal|Privacy policy|Modern Slavery Act Transparency Statement|Sitemap|About US| Contact US: help@patsnap.com


