Method and system for displaying performance constraints in a flow design tool

a flow design and performance constraint technology, applied in the field of flow modeling tools, can solve the problems of network connection being too slow for the required data throughput, bottlenecks can stem, model flow complexity is increasing and more complex, etc., to achieve precise performance values, eliminate any bottlenecks, and arrange flow

Inactive Publication Date: 2007-03-01
IBM CORP
View PDF35 Cites 25 Cited by
  • Summary
  • Abstract
  • Description
  • Claims
  • Application Information

AI Technical Summary

Benefits of technology

[0027] The method in accordance with the present invention is particularly advantageous as it enables the user to identify any severe problems, such as bottlenecks, during the design phase of the flow. The

Problems solved by technology

Modeling flows is however becoming more and more complex due to the many components involved as well as heterogeneous environments becoming more popular.
Bottlenecks can stem from network connections being too slow for a required data throughput.
Servers incapable of delivering data at a required speed will limit the utilization of successive servers.
Moreover, peak loads on an individual server can cause it to have too high a load, thus preventing it from handling other tasks scheduled for that server.
Keeping a good overview of the environment is essential, but does not guarantee for optimum results.
Furthermore, problemat

Method used


Image

  • Method and system for displaying performance constraints in a flow design tool
  • Method and system for displaying performance constraints in a flow design tool
  • Method and system for displaying performance constraints in a flow design tool

Examples


Embodiment Construction

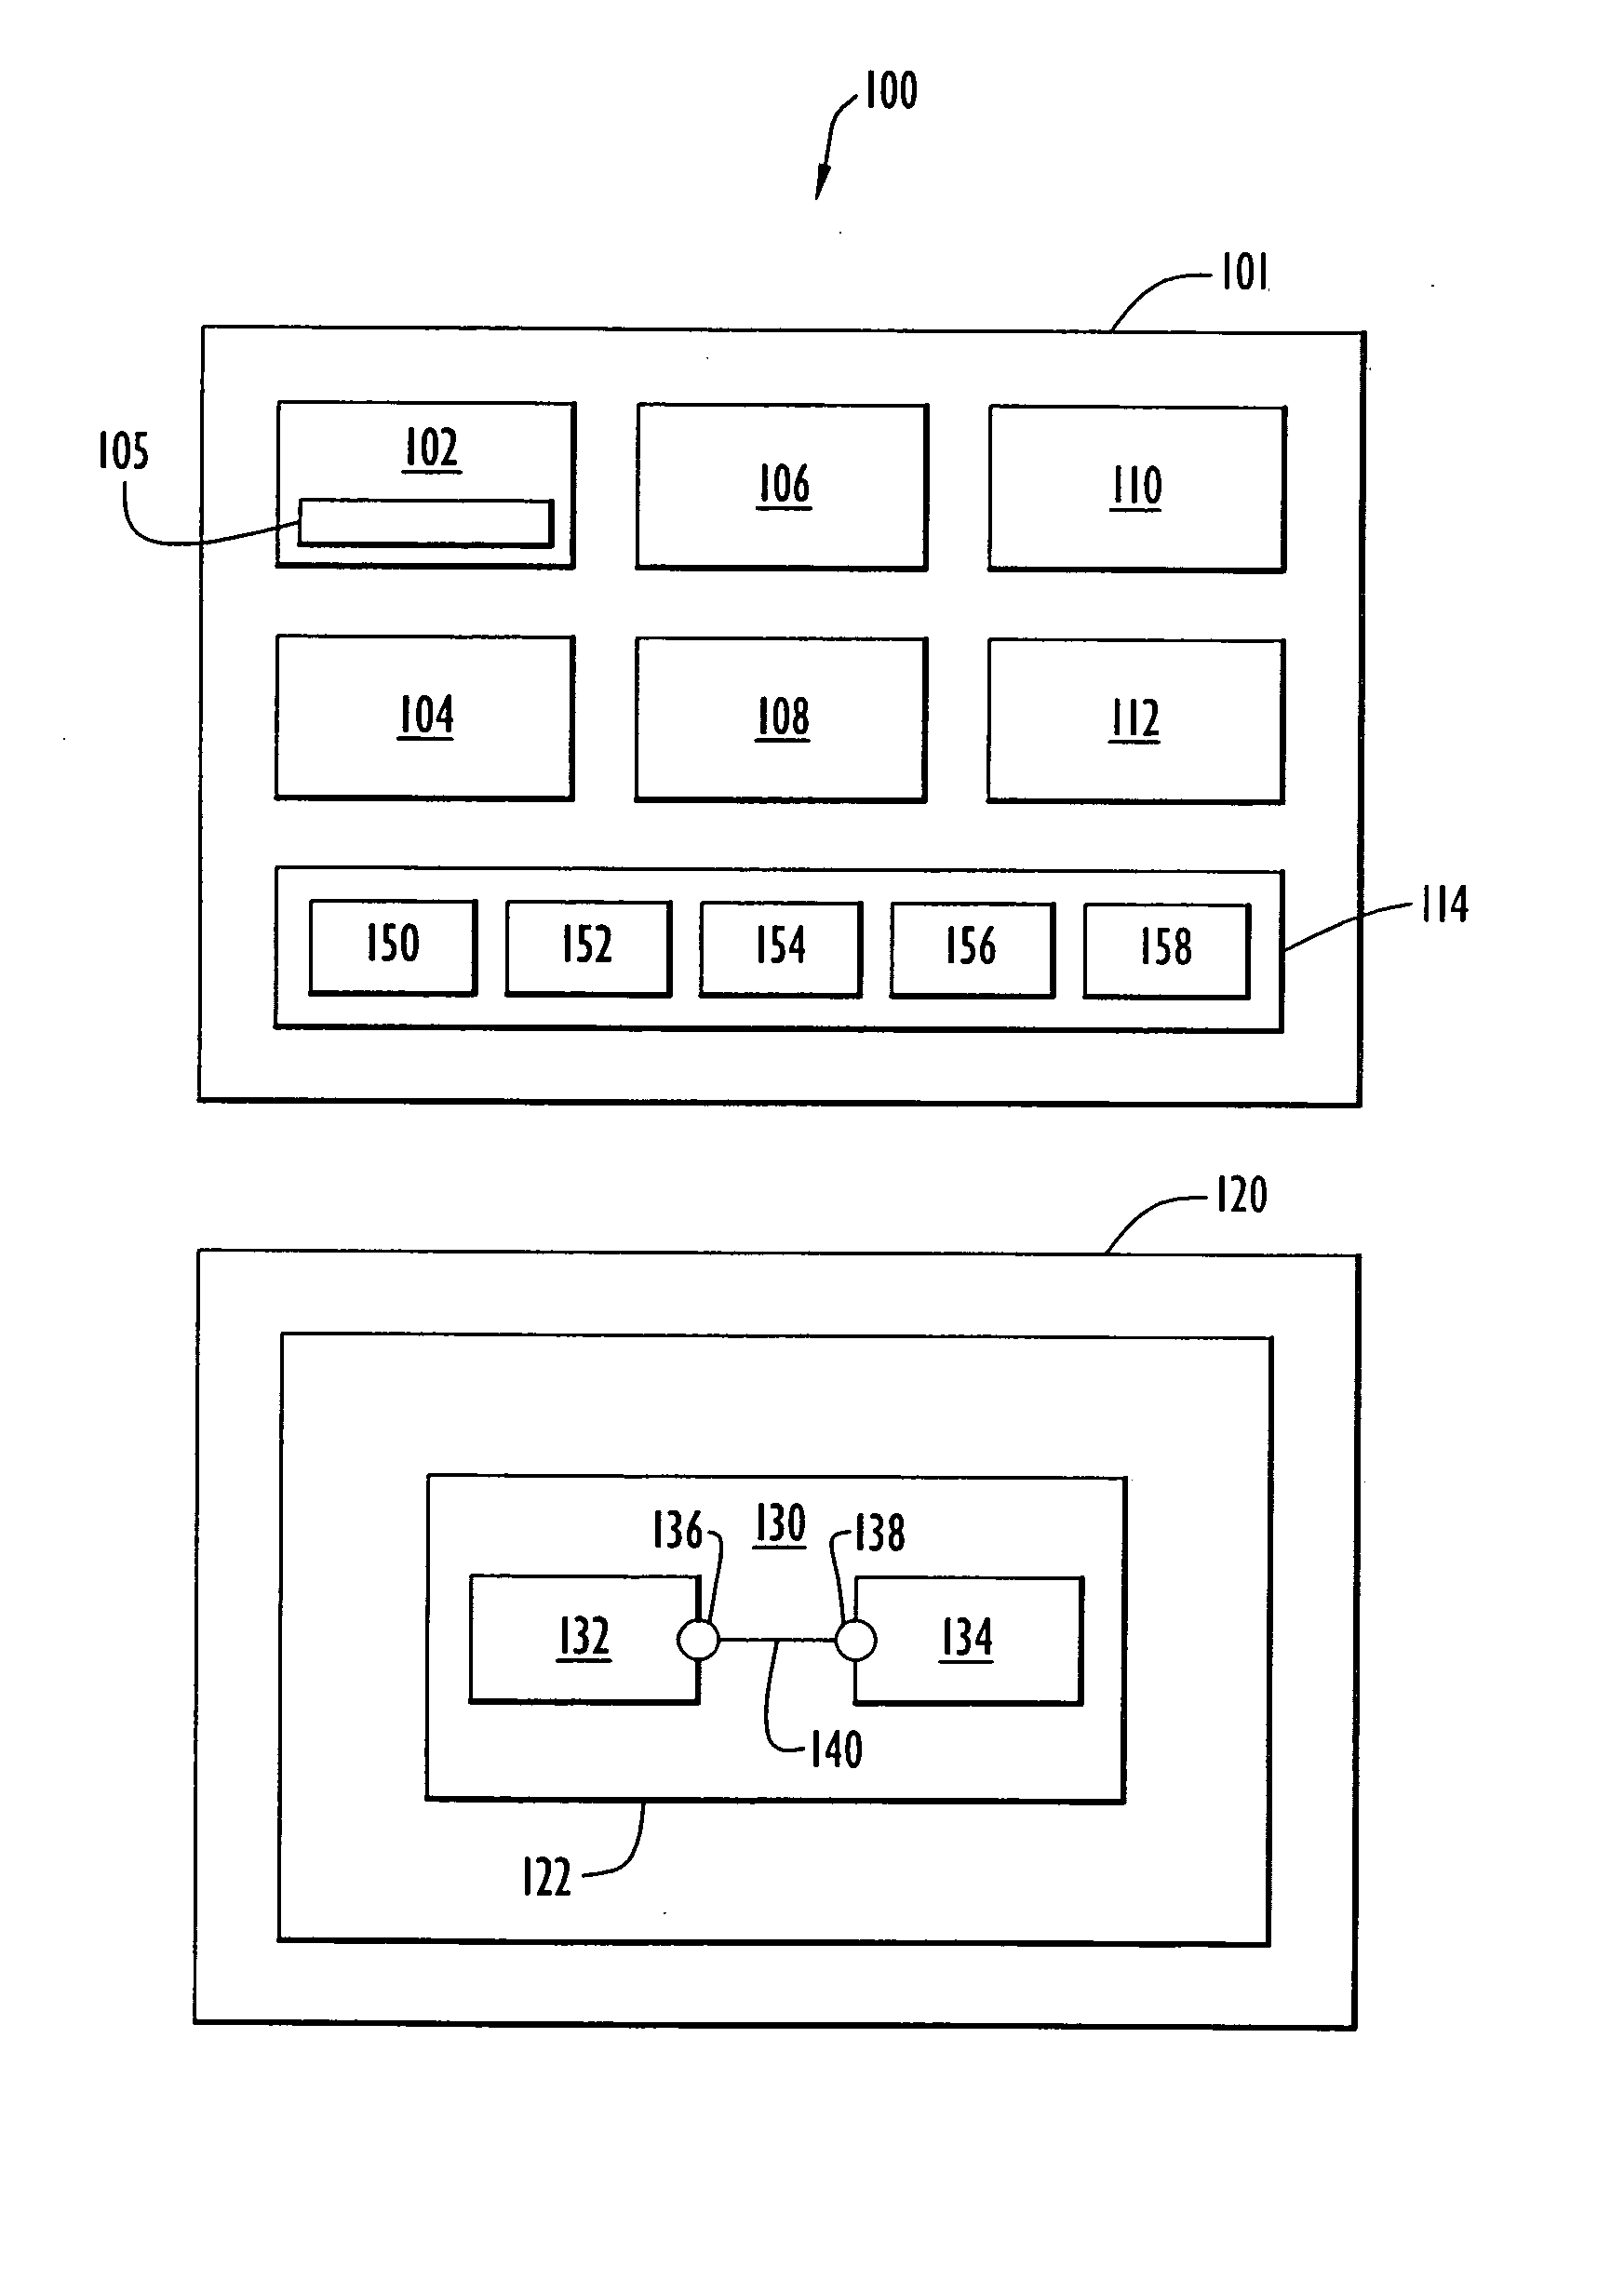
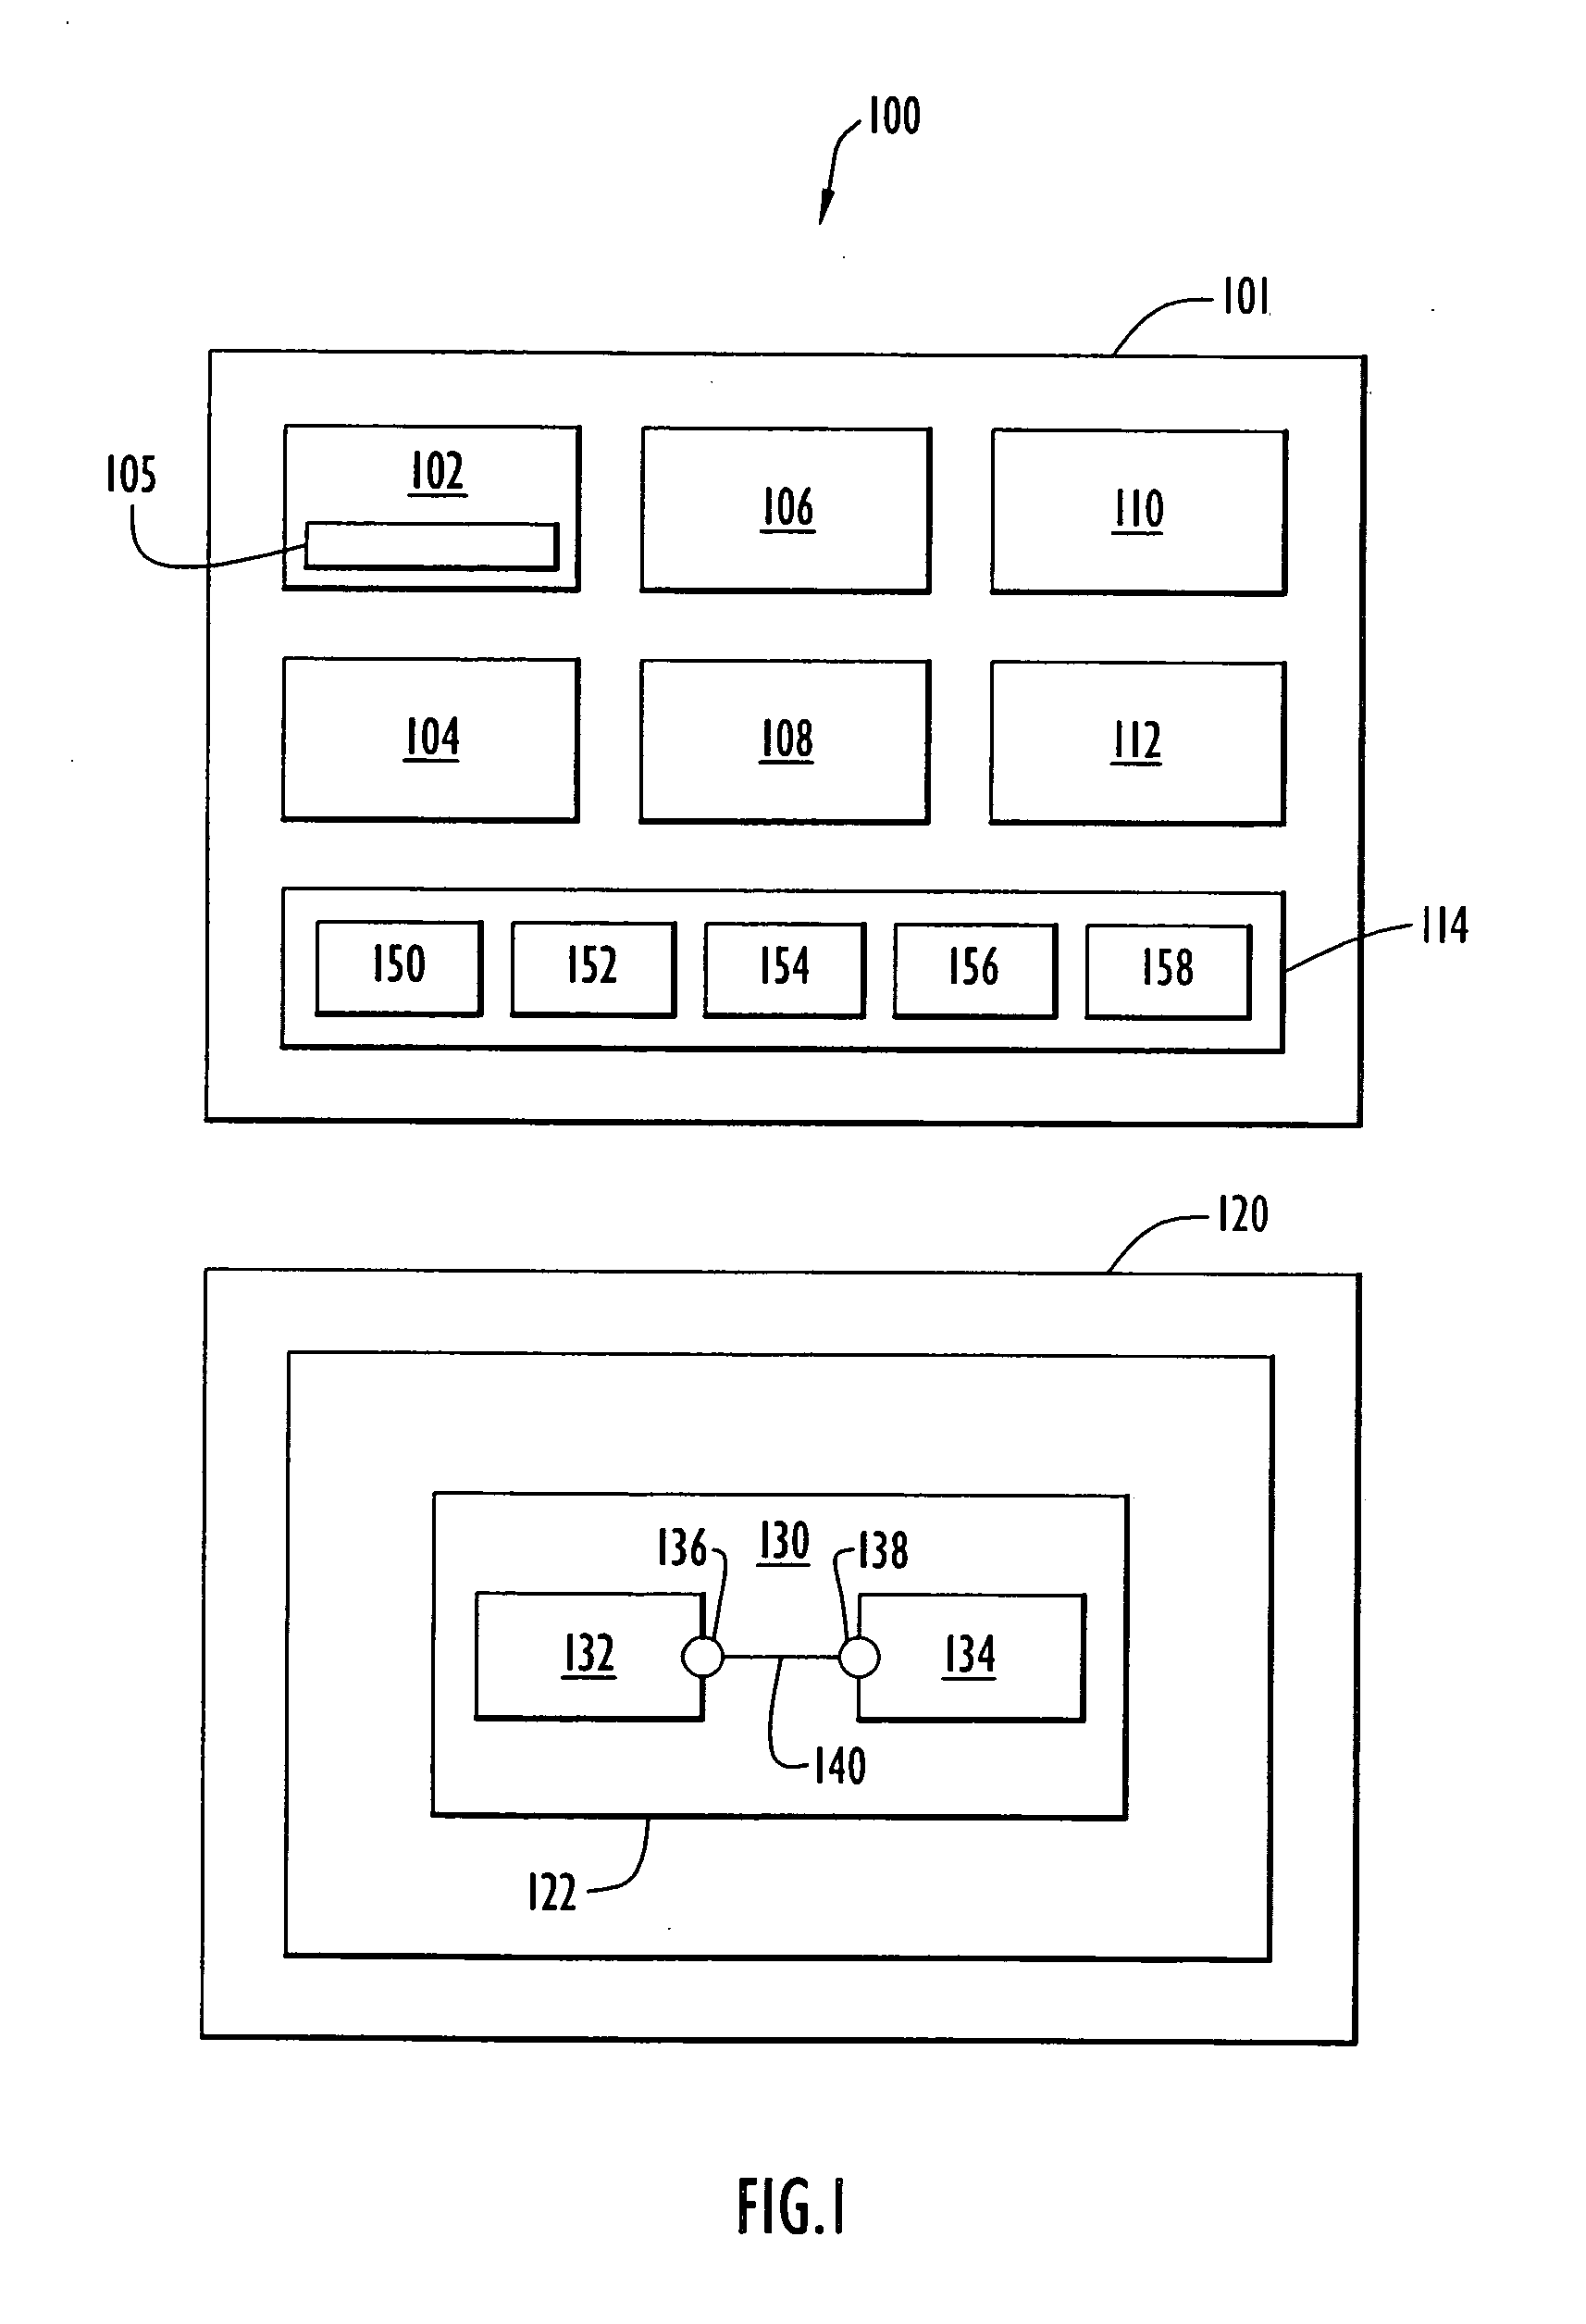
[0037]FIG. 1 is a block diagram of a system 100 that implements an embodiment of the present invention. The system comprises a computer system 101 and a screen 120. The flow design tool 102 and the data processing system 104 in accordance with the present invention are executed by the microprocessor 106. The flow design tool 102 and the data processing system 104 use a graphics card 110 to generate a graphical user interface 122 on the screen 120. The flow design tool 102 can comprise a flow simulation tool 105.

[0038] The flow design tool 102 enables the user to create a flow 130 on the graphical user interface 122 by use of an input device 108 (e.g., a keyboard, a mouse, etc.). The flow comprises operators 132 and 134 with an input channel 138 and an output channel 136. A link 140 connects the output channel 136 with the input channel 138.

[0039] An operator can represent, for example, a hardware device on which a database is stored, a data processing system, a computer, a router ...


PUM


Abstract

A method and system of the present invention determines the performance values of components of a flow by taking the interactions between the components into account, and visualizes the performance values on a graphical user interface during a flow design phase. Thus, interactions between the components of the flow become transparent to the user and bottlenecks can be identified immediately.

Description

BACKGROUND OF THE INVENTION [0001] 1. Field of the Invention [0002] The present invention relates to flow modeling tools in general and to the visualization of flows in particular. [0003] 2. Discussion of Related Art [0004] Flow modeling tools are frequently employed during the design phase of a flow process, such as a workflow process or a dataflow process. All flow modeling tools comprise a graphical user interface on which the flow to be designed can be, drawn. This is done in most flow modeling tools by selecting operators from a palette and placing them on the graphical user interface. Operators are steps composing the flow. [0005] In the case of a dataflow, an operator can be any kind of data source (e.g., database, flat file, etc.) providing some data, any kind of transformer applying a transformation on the data, or any kind of target in which the data can be loaded. [0006] In the case of a workflow, an operator can be any kind of activity playing a role in the flow (e.g., i...

Claims


Application Information

Patent Timeline
IPC IPC(8): G06T17/00G06G7/48G06F17/50G06Q10/00
CPCG06Q10/06
Inventor RASPL, STEFANSAILLET, YANNICK
Owner IBM CORP
Why Eureka
Try Eureka