Methods for identifying discrete populations (e.g., clusters) of data within a flow cytometer multi-dimensional data set

a flow cytometer and data set technology, applied in material analysis, measurement devices, instruments, etc., can solve the problems of reducing the production of red cells, unable to keep up with the removal of red cells, and low overall red blood cell count and hematocrit, so as to achieve more robust and accurate classification and accurately classify the data set into populations

Inactive Publication Date: 2007-05-24
IDEXX LABORATORIES
View PDF11 Cites 62 Cited by
  • Summary
  • Abstract
  • Description
  • Claims
  • Application Information

AI Technical Summary

Benefits of technology

[0040] The use of the expert knowledge set in combination with the finite mixture model allows for more robust and accurate methods of automatically classifying data into one or more populations. In the context of flow cytometry and blood samples, an expert hematologist approaches a given flow cytometry data set expecting to find evidence of the five WBC types and has, as a result of previous information derived from blood manipulation studies, a good idea where they fall in one or more two-dimensional projections of the seven-dimensional data. There are no necessary bounds on what might comprise an expert's a priori knowledge set, but examples can include cluster position (e.g., in a two-dimensional projection or plot of a subset of the data), geometric shape of a...

Problems solved by technology

In anemia, red cell production may be diminished to the point where it can no longer keep up with red cell removal, and as a result the overall red blood cell count and hematocrit are low.
If few or no reticulocytes are detectable in these patients, the bone marrow is not adequately responding to the red blood cell deficit.
Like RBCs, platelets lack nuclei and thus cannot reproduce.
However, the skills necessary to perform these test manually are rare and require years of training.
Furthermore, the time required to perform each of these tests manually is very high.
For example, material within cells having a strong absorption at the illuminating wavelength may interfere with size determination because cells containing this material produce smaller forward scatter signals than would otherwise be expected, leading to an underestimate of cell size.
However, the calibration proc...

Method used


Image

  • Methods for identifying discrete populations (e.g., clusters) of data within a flow cytometer multi-dimensional data set
  • Methods for identifying discrete populations (e.g., clusters) of data within a flow cytometer multi-dimensional data set
  • Methods for identifying discrete populations (e.g., clusters) of data within a flow cytometer multi-dimensional data set

Examples


Embodiment Construction

[0070] Overview

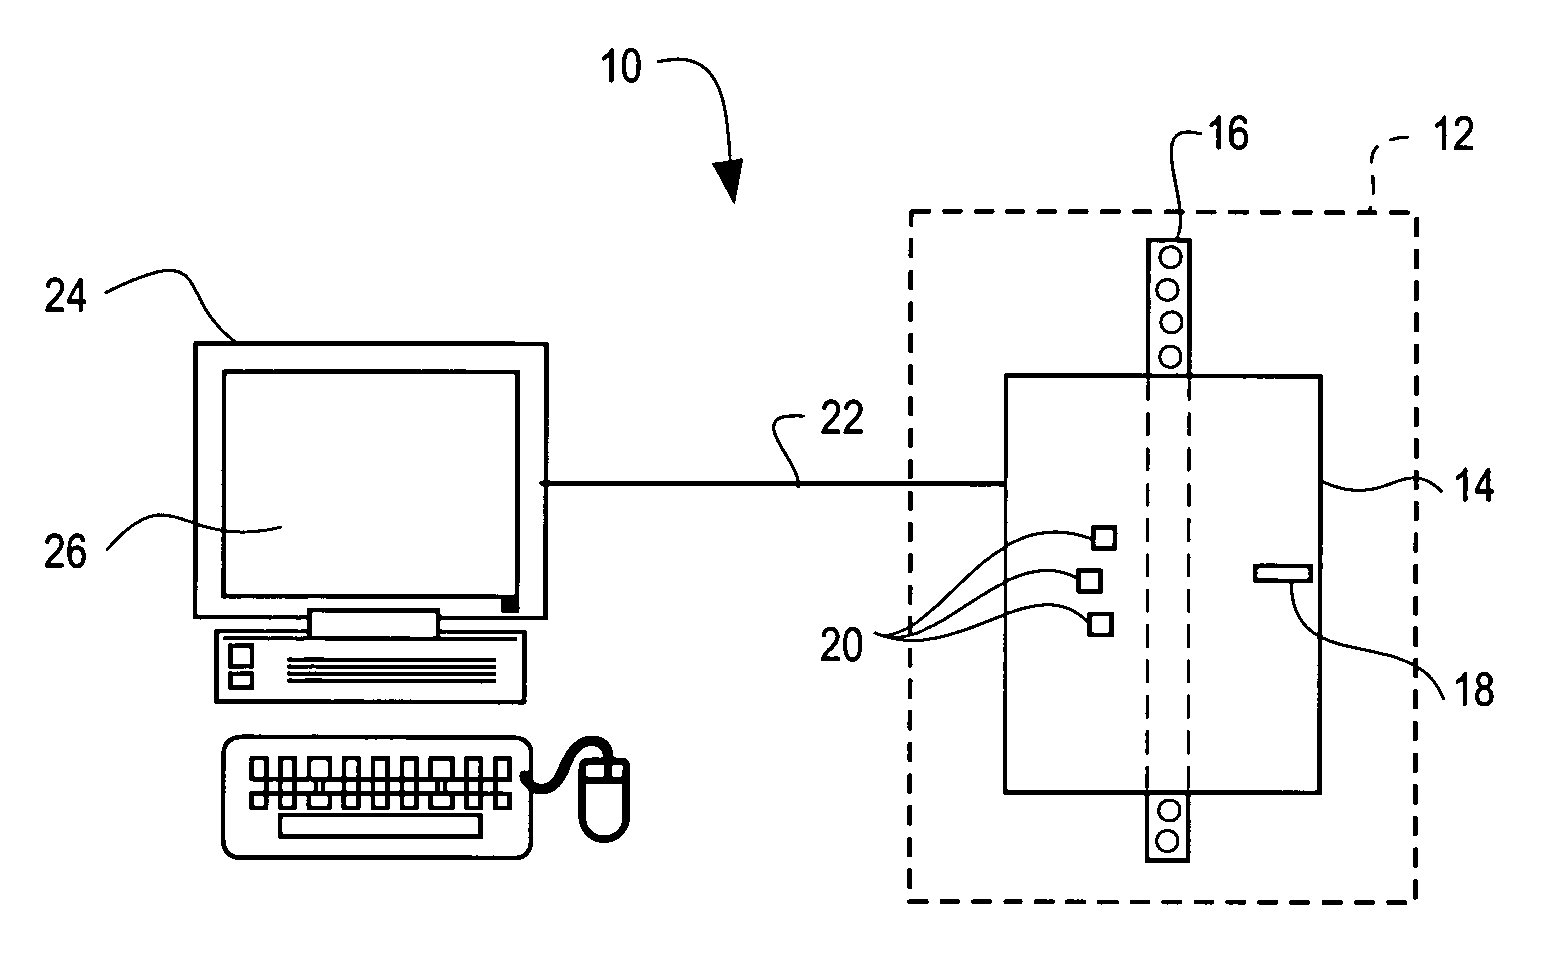
[0071] As noted above, when a blood sample is passed through a flow cytometry system, the system generates N data points in multiple dimensions. In the present example, the flow cytometer obtains data in seven dimensions. The dimensions are referred to herein as “channels” and are abbreviated EXT, EXT_Int, RAS, RAS_Int, FSL, FSH, and TOF, and have been defined previously. The physical properties of the different white blood cells cause light passing through them to scatter differently. For example, larger cells generally have greater EXT and EXT_Int values due to their greater light occlusion, while cells with greater internal complexity tend to produce greater light scatter and this is observed at the FSH detector. In a flow cytometry application of this invention, the goal of the methods described herein is to find, i.e., identify and classify, these populations in the midst of noise and to give quantitative or qualitative estimates on the relative frequencies of e...


PUM


Abstract

Systems and methods for identifying populations of events in a multi-dimensional data set, e.g., seven dimensional flow cytometry data of a blood sample. The populations may, for example, be sets or clusters of data representing different white blood cell components in the sample. The methods use a library consisting of one or more one finite mixture models, each model component comprising parameters representing multi-dimensional Gaussian probability density functions, one density for each population of events expected in the data set. The methods further use an expert knowledge set comprising one or more data transformations for operation on the multi-dimensional data set and one or more logical statements. The transformations and logical statements encode a priori expectations as to the relationships between different event populations in the data set. The methods further use program code comprising instructions by which a processing unit such as a computer may operate on the multi-dimensional data, a finite mixture model selected from the library, and the expert knowledge set to thereby identify populations of events in the multi-dimensional data set.

Description

[0001] A portion of this disclosure of this patent document contains material which is subject to copyright protection. The copyright owner has no objection to the facsimile reproduction by anyone of the patent document or the patent disclosure, as it appears in the Patent and Trademark Office patent file or records, but otherwise reserves all copyright rights whatsoever. BACKGROUND [0002] A. Field of the Invention [0003] This invention relates to the field of methods of analysis of multi-dimensional data and more particularly to methods for identifying and classifying discrete populations or clusters within such data. This invention has applications in a variety of disciplines, including the fields of biology, drug discovery and medicine, such as analysis of blood. One specific application described herein is analysis of multi-dimensional data obtained from a flow cytometer in order to identify and classify the data into discrete populations of different types of white blood cells....

Claims


Application Information

Patent Timeline
IPC IPC(8): G06F19/00
CPCG06F19/3443G06F19/345G06K9/00147G06K9/6226G01N2015/1477G01N2015/008G01N2015/1006G01N2015/1402G01N15/1459G06K9/626G16H50/70G16H50/20G06V20/698G06F18/2321G06F18/24765
Inventor THAYER, EDWARD
Owner IDEXX LABORATORIES
Why Eureka
Try Eureka