Graphics integration into a process configuration and control environment

a control environment and process configuration technology, applied in the field of process plants, can solve the problems of limited graphical capabilities of graphic displays, difficult, if not impossible, to use graphical programs created to support control or other operators in maintenance, configuration or simulation functions, and limited usefulness of specific process functions

Active Publication Date: 2007-06-21
FISHER-ROSEMOUNT SYST INC
View PDF40 Cites 160 Cited by
  • Summary
  • Abstract
  • Description
  • Claims
  • Application Information

AI Technical Summary

Benefits of technology

[0009] Thus, similar to the control configuration application, the display creation application may have template graphical display items, such as tanks, valves, sensors, operator control buttons like slide bars, on / off switches, etc. which may be placed on a screen in any desired configuration to create an operator display, maintenance display and the like. When placed onto the screen, individual graphic items may be interconnected on the screen in a manner that provides some information or display of the inner-workings of the process plant to users. However, to animate the graphic display, the display creator must manually tie each of the graphical items to data generated within the process plant, such as data measured by sensors or indicative of valve positions, etc. by specifying a communication link between the graphic item and the relevant data source within the process plant. This process is tedious, time consuming and may be fraught with error.

Problems solved by technology

However, these graphical display applications have, in the past, been created as part of or to support the specific applications with which they are associated, and thus are generally limited in usefulness to the specific process function for which they were created.
For example, it is difficult, if not impossible, to use a graphical program created to support a control or other operator in a maintenance, a configuration or a simulation function.
Still further, the limited graphical capabilities of these displays are hard to implement and are not done so as part of any graphical object.
This process is tedious, time consuming and may be fraught with error.
Unfortunately, the control modules and displays items discussed above are not modular in any manner.
In a plant having many copies of the same type of equipment (i.e., replicated equipment), this process is tedious, time consuming and fraught with operator introduced errors.
Still further, once programmed, these different control modules and displays are not aware of each other.
Therefore, to make a change to the control modules once created, the engineer or operator must manually make the same change to each of the different control modules for the different replicated equipment which, again, is time consuming and tedious.
The same problem applies for the graphical views created for the different sets of replicated equipment within the plant.
This problem is even more evident when graphical views are created for the same equipment but in different functional contexts within the plant, such as for control viewing, maintenance viewing and simulation functions.
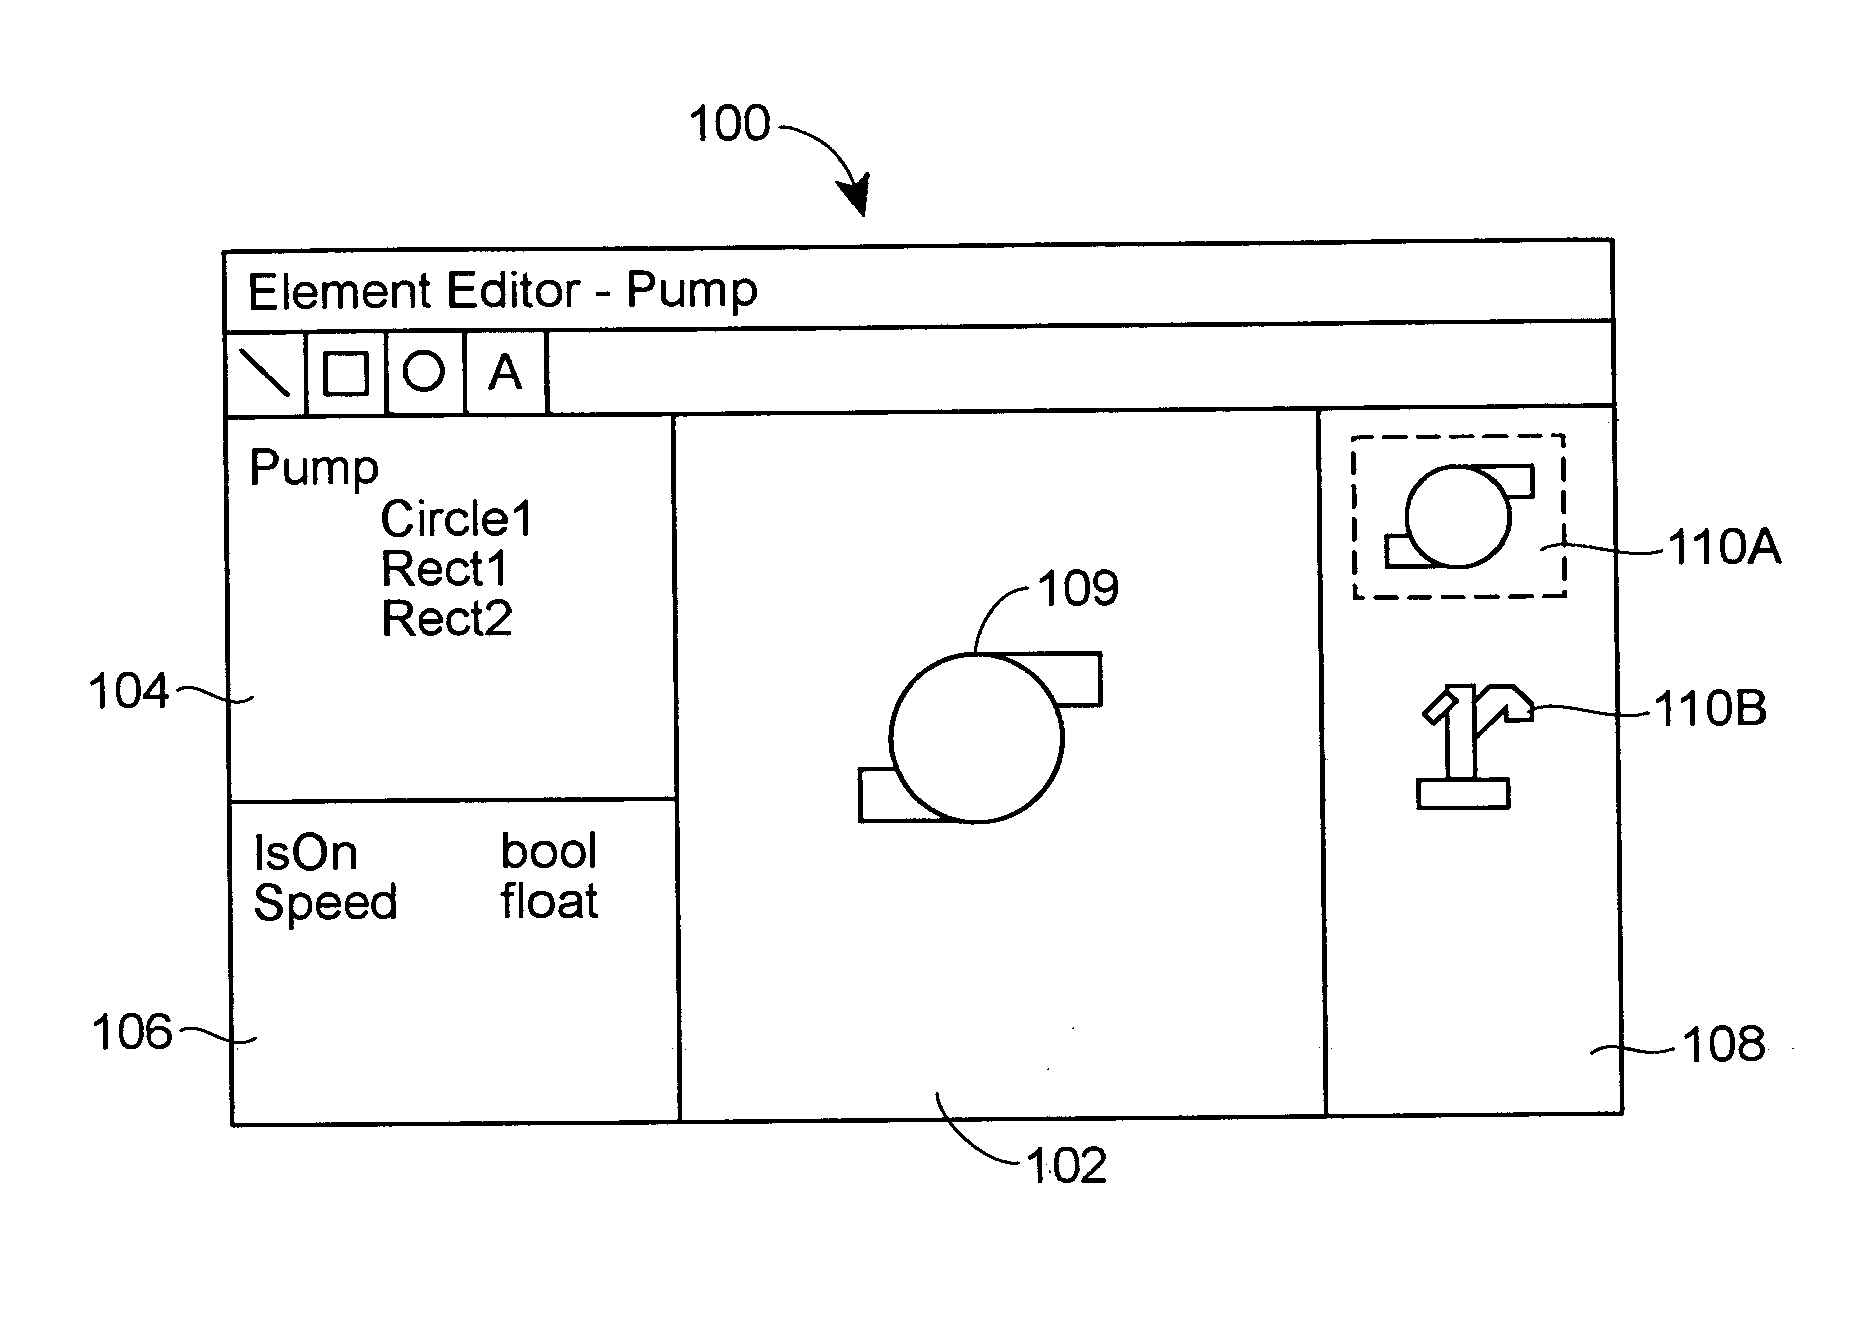
As a result, the graphical editors, to the extent they existed, have only enabled the user to create graphics that support specific functionality needed by a specific application.
Previous process plants did not provide a graphical display editor that could be used by or that could support the graphical needs of various or multiple activities being performed in the context of plant configuration and support.
Thus, for example, a graphical display editor used to support or enable control configuration activities only enabled the user to create control programs and did not support the needs or functionality of operator or maintenance displays.
Similarly, graphic display editors used for creating operator views, maintenance views, etc. to be provided to a control operator or maintenance technician during operation of a plant, did not support functionality associated with configuration activities, simulation activities, etc.
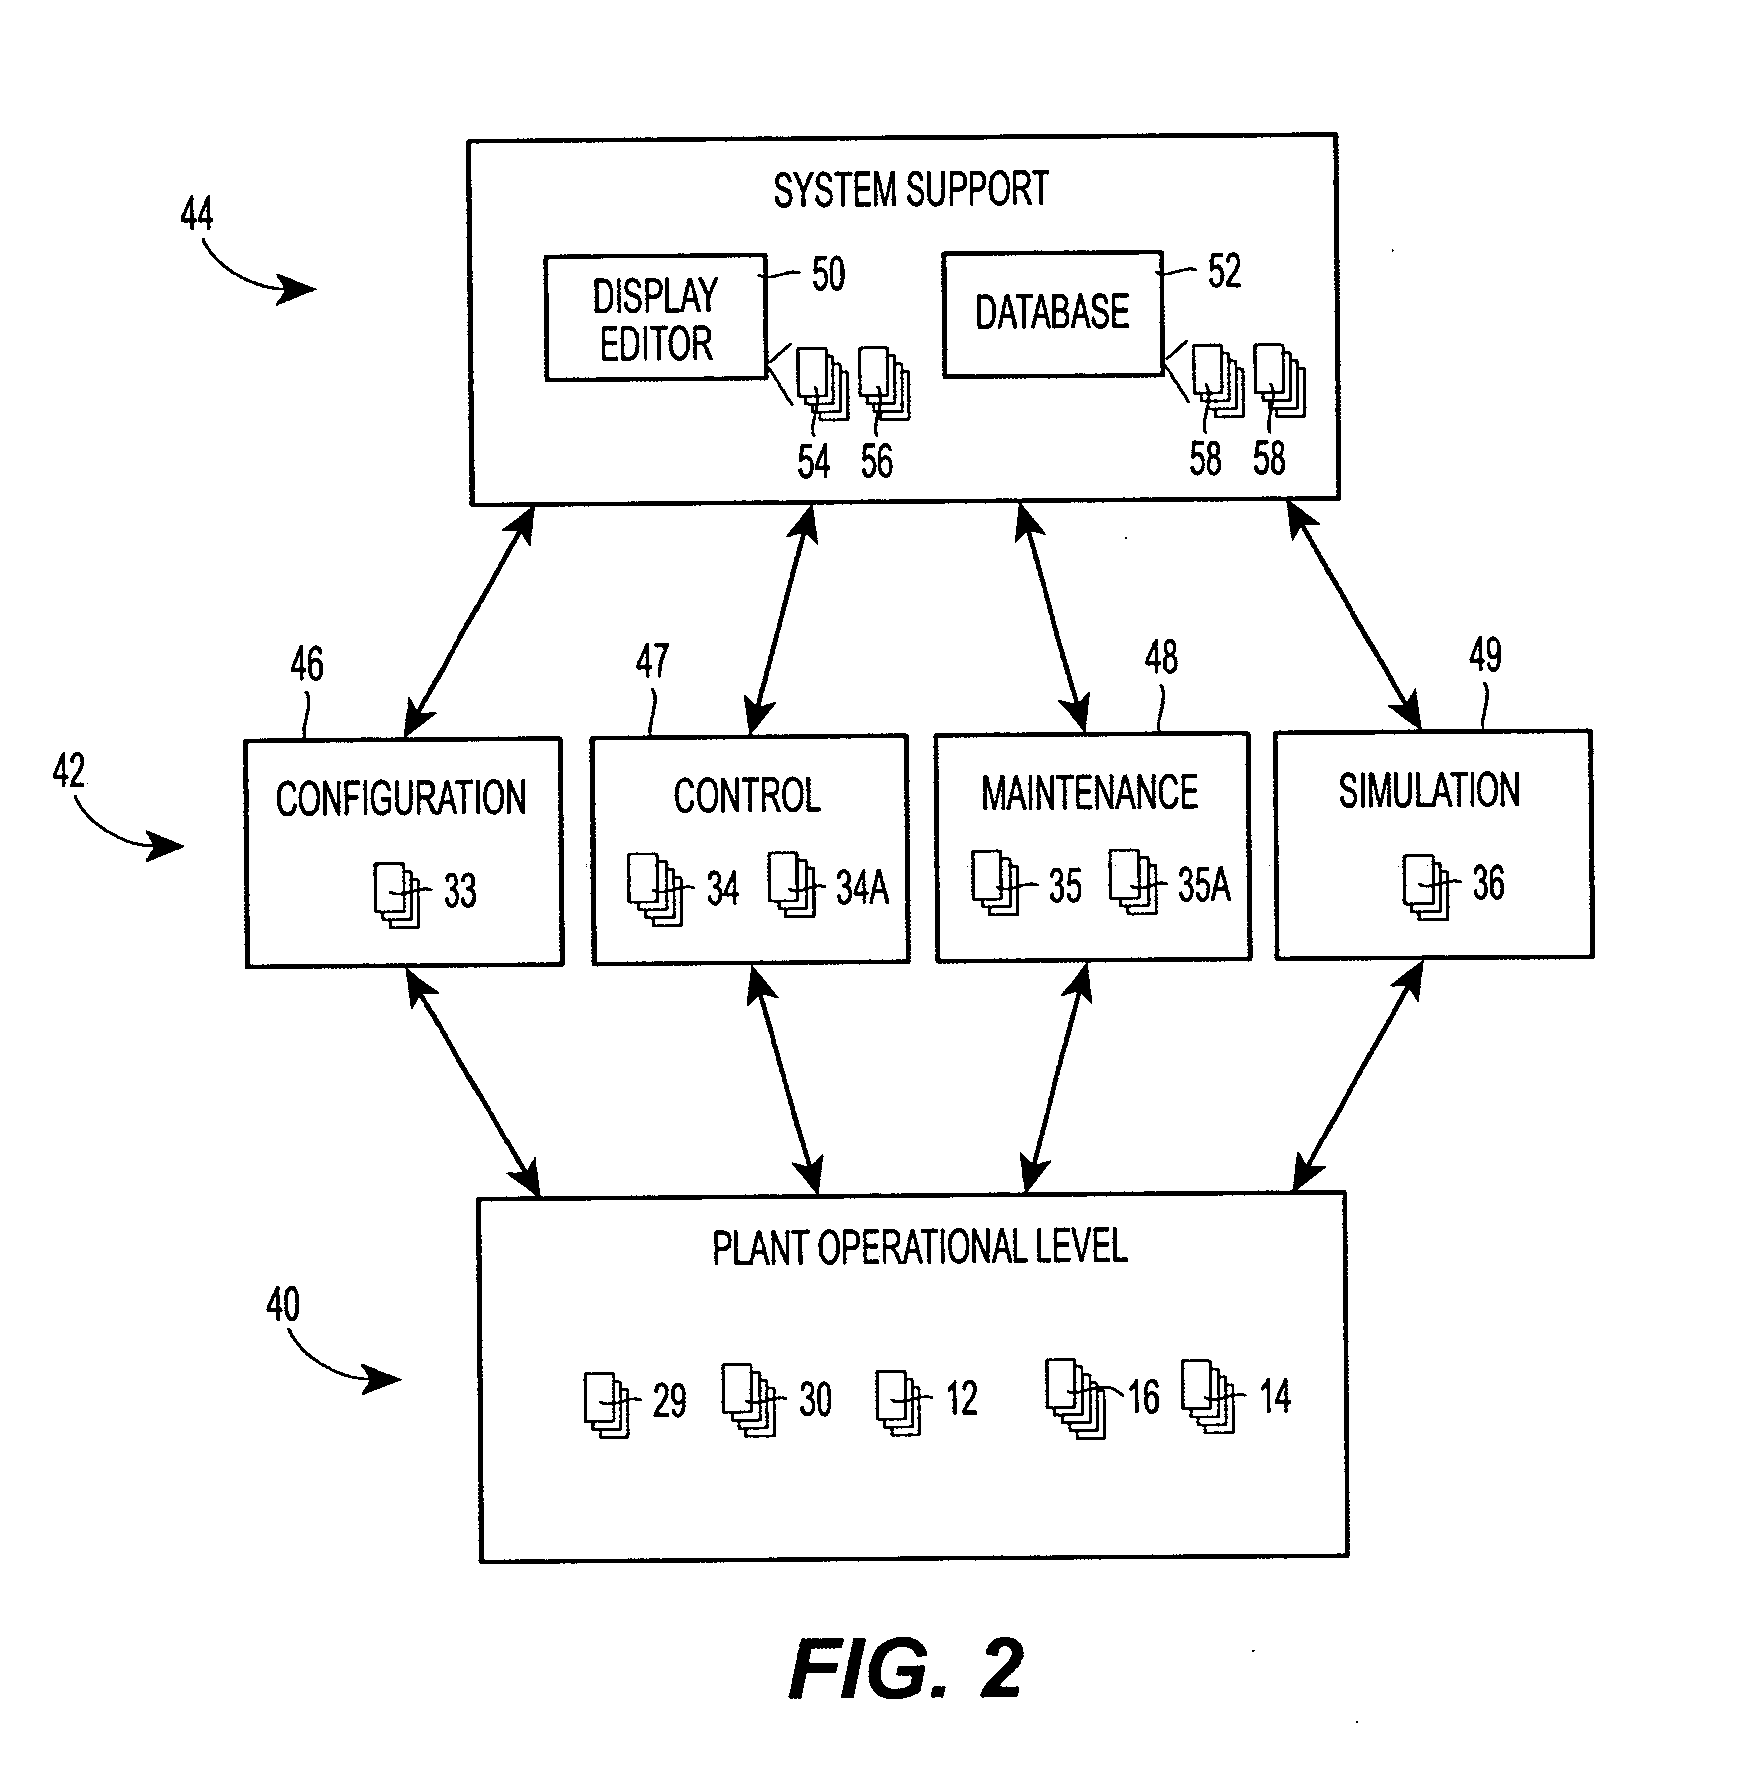
As a result of the graphic display needs being supported at the individual functional levels of the process plant, such as at the control configuration, maintenance support, control operator support and simulation support functional levels, different ones of the displays created by these various editors end up modeling and depicting the same components within the plant, which results in the duplication of graphical display efforts by various different personnel with the process plant.
This duplication of effort is manifested not only in the effort needed to create the different graphical displays depicting the same process element for different uses, but also in the effort needed to tie the graphic elements used in different display applications to the actual hardware or software elements within the process plant to which they are associated.
This non-integration of graphics leads to the graphics actually created for the different functions being different from function to function or from application to application, which can lead to confusion on the part of users who, while familiar with one specific type of graphical display, might occasionally need to view different displays associated with different operations or functions within the plant.
It has been difficult, therefore, to program the process control system to recognize system-level conditions or errors that must be detected by analyzing data from different, possible diversely located devices within the process plant and even more difficult to show these types of errors on operator displays that have not been created to indicate or present such system-level condition information to operators or maintenance personnel.
Also, it is difficult to animate objects within operator displays with these alternate sources of information or data for the different elements within the display.

Method used


Image

  • Graphics integration into a process configuration and control environment
  • Graphics integration into a process configuration and control environment
  • Graphics integration into a process configuration and control environment

Examples


Embodiment Construction

[0041]FIG. 1 illustrates an example process plant 10 in which system level graphical support is provided to various functional areas of the plant 10. As is typical, the process plant 10 includes a distributed process control system having one or more controllers 12, each connected to one or more field devices 14 and 16 via input / output (I / O) devices or cards 18 which may be, for example, Fieldbus interfaces, Profibus interfaces, HART interfaces, standard 4-20 ma interfaces, etc. The controllers 12 are also coupled to one or more host or operator workstations 20-23 via a data highway 24 which may be, for example, an Ethernet link. A database 28 may be connected to the data highway 24 and operates as a data historian to collect and store parameter, status and other data associated with the controllers and field devices within the plant 10 and / or as a configuration database that stores the current configuration of the process control system within the plant 10 as downloaded to and stor...


PUM


Abstract

Graphic elements and graphic displays are provided for use in a process environment to display information to one or more users about the process environment, such as the current state of device within a process plant. The graphic elements and display may be associated with various logical and physical elements within the process plant during configuration of the process plant, and may be configured and downloaded to the hardware within the process plant along with other configuration items, such as control routines. In particular, the graphic elements and graphic displays may be created and stored in a library, and may then be configured by being associated with various logical or physical entities within the plant. During the configuration process, the graphic elements and graphic displays may be associated with areas, equipment, process modules, control routines or control strategies of the plant as defined elsewhere in the plant configuration, or may be associated with interfaces or display devices, to define the hardware on which the graphic displays will execute during runtime, as well as to define the process entities to which these displays will be bound for display purposes. Still further, each of the graphic displays may be defined with a role or a functional use, such as an operator view, a maintenance view, etc., and these roles may be used to defined the proper access and use of the graphic displays within the runtime environment.

Description

RELATED APPLICATIONS [0001] This application is a regular filed application of and claims, for the purposes of priority, the benefit of U.S. Provisional Application Ser. No. 60 / 567,980, entitled “Graphical User Interface for Representing, Monitoring, and Interacting with Process Control Systems,” which was filed on May 4, 2004 and which this application hereby expressly incorporates by reference herein in its entirety. This application is also related to U.S. patent application Ser. No. 10 / 625,481, entitled “Integration of Graphic Display Elements, Process Modules and Control Modules in Process Plants,” which was filed on Jul. 21, 2003, and which published as U.S. Publication No. 2004 / 0153804 on Aug. 5, 2004, which, in turn, is a Continuation-in-Part of U.S. patent application Ser. No. 10 / 278,469, entitled “Smart Process Modules and Objects in Process Plants,” which was filed on Oct. 22, 2002, and which published as U.S. Publication No. 2004 / 0075689 on Apr. 22, 2004, the entire disc...

Claims


Application Information

Patent Timeline
Patent Type & Authority Applications(United States)
IPC IPC(8): G09G5/00G05B19/042G05B23/02G06F9/44H04L29/08
CPCG05B19/0426G06T13/00G05B23/0267G05B2219/23424G05B2219/25067G05B2219/25428G05B2219/31467G05B2219/31469G05B2219/31472G05B2219/31474G05B2219/32128G05B2219/32342G06F8/20G06F9/4428G06N5/04G06Q10/06G06Q50/04H04L2012/4026H04L67/16H04L67/36H04L67/12H04L67/28H04L67/289Y10S715/965G06F8/38G06F9/4443G05B19/41885Y02P90/30Y02P90/84Y02P80/40Y04S40/18G06F9/4488G06F9/451Y02A10/40Y02P90/02Y02P90/80H04L67/56H04L67/51H04L67/75G06F30/12G06F2113/14G06F2111/12G05B19/042G05B19/0425G05B23/02G06F13/387G05B19/0428G05B19/4185G05B19/02G06F13/00G06F9/44G06F11/32G06F16/00G05B19/418G06F9/00
Inventor LUCAS, J. MICHAELNIXON, MARK J.ZHOU, LINGENVER, ALPERWEBB, ARTHUR
Owner FISHER-ROSEMOUNT SYST INC
Why Eureka
Try Eureka