Phylogenetic Analysis of Mass Spectrometry or Gene Array Data for the Diagnosis of Physiological Conditions

a mass spectrometry or gene array technology, applied in the field of universal data mining platform, can solve the problems of unattainable comparability of proteomic analyses performed in diverse locations, difficulty in classifying specimens on the basis of overall similarity,

Active Publication Date: 2007-11-08
AMRI HAKIMA +2
View PDF4 Cites 11 Cited by
  • Summary
  • Abstract
  • Description
  • Claims
  • Application Information

AI Technical Summary

Benefits of technology

[0020] It is an object of the invention to provide improved elements and arrangements thereof in an apparatus for

Problems solved by technology

Classifying specimens on the basis of their overall similarity (e.g., phenetic approaches such as clustering) is problematic.
Comparability of proteomic analyses performed in diverse locations is unattainable due to the lack of broadly acceptable universal methods of analysis.
Further, the use of mass spectrometry (MS) of serum proteins to produce clinically useful profiles has proven to be challenging, and has generat

Method used


Image

  • Phylogenetic Analysis of Mass Spectrometry or Gene Array Data for the Diagnosis of Physiological Conditions
  • Phylogenetic Analysis of Mass Spectrometry or Gene Array Data for the Diagnosis of Physiological Conditions
  • Phylogenetic Analysis of Mass Spectrometry or Gene Array Data for the Diagnosis of Physiological Conditions

Examples


example 1

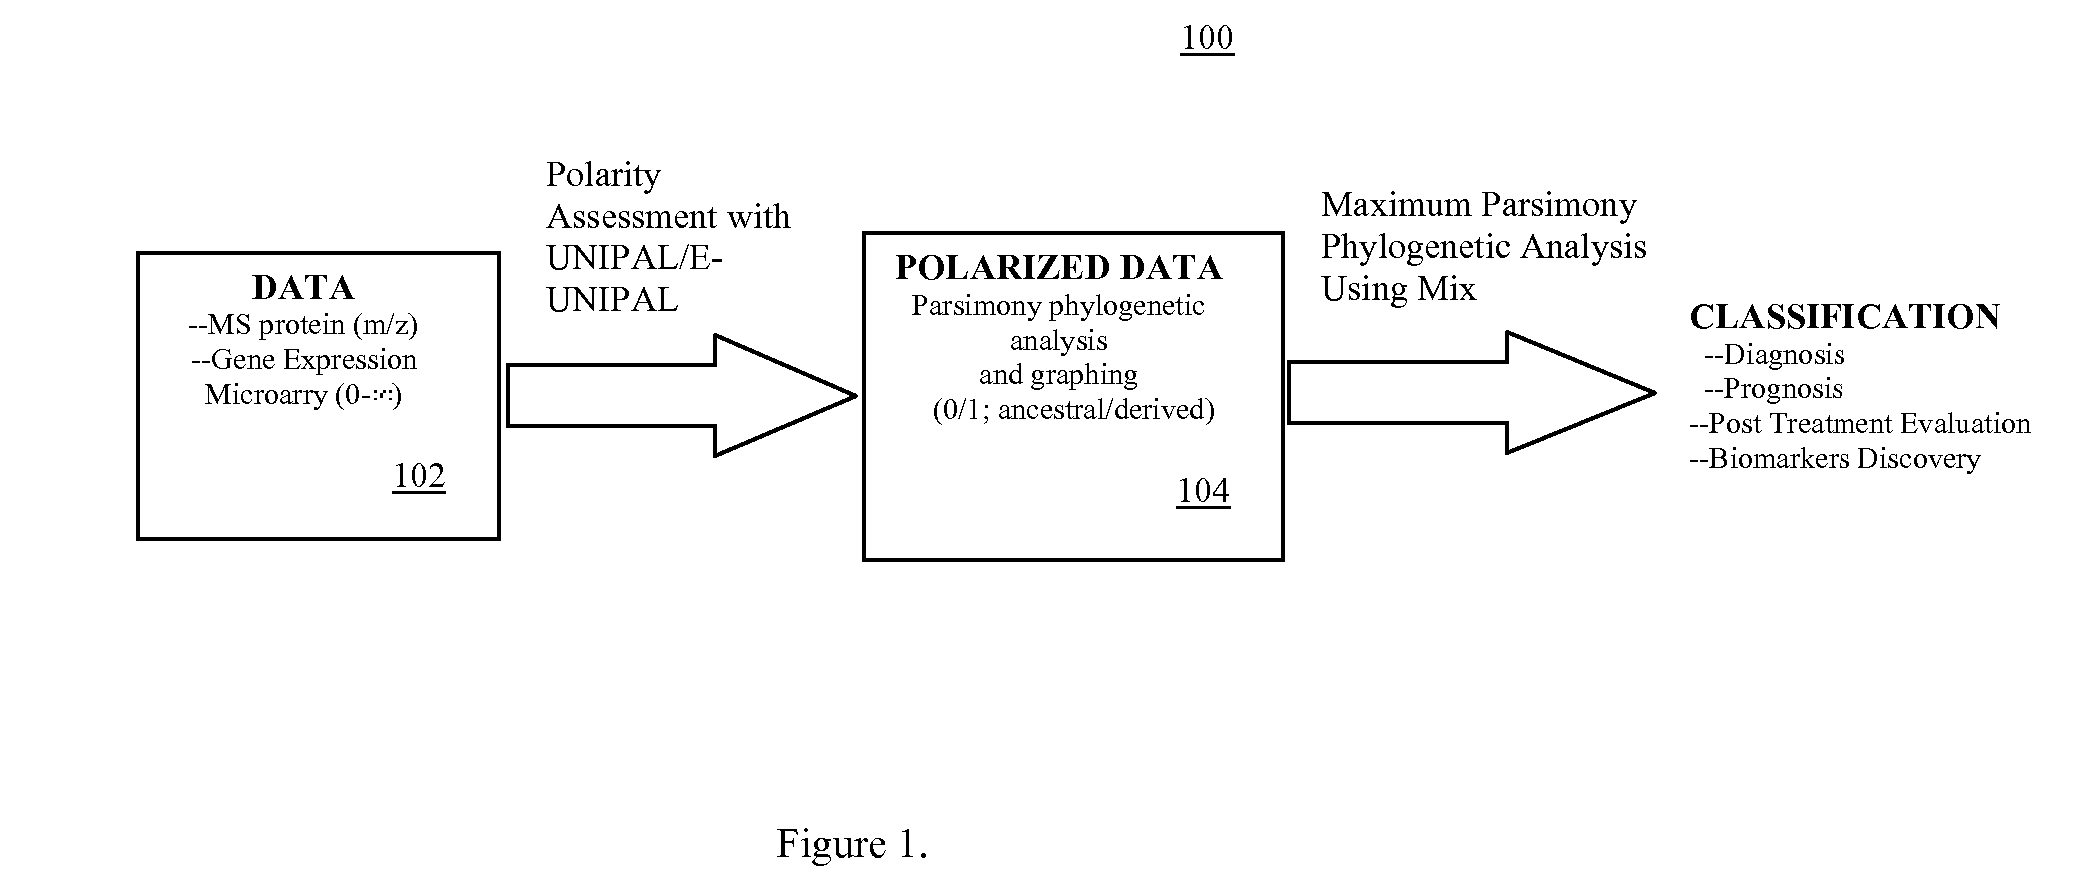
[0056] A mass spectrometry (MS) data of serum proteins was generated by surface-enhanced laser desorption-ionization time-of-flight (SELDI-TOF) of 460 specimens from three types of cancer: ovarian (n=143), pancreatic (n=70), and prostate (n=36), as well as from non-cancerous specimens (n=211). See FIG. 4. All sets of data used in samples were available from the NCI-FDA Clinical Proteomics Program, and are referred to in a few publications (http: / / home.ccr.cancer.gov / ncifdaproteomics / ppatterns.asp).

[0057] A.3. Results

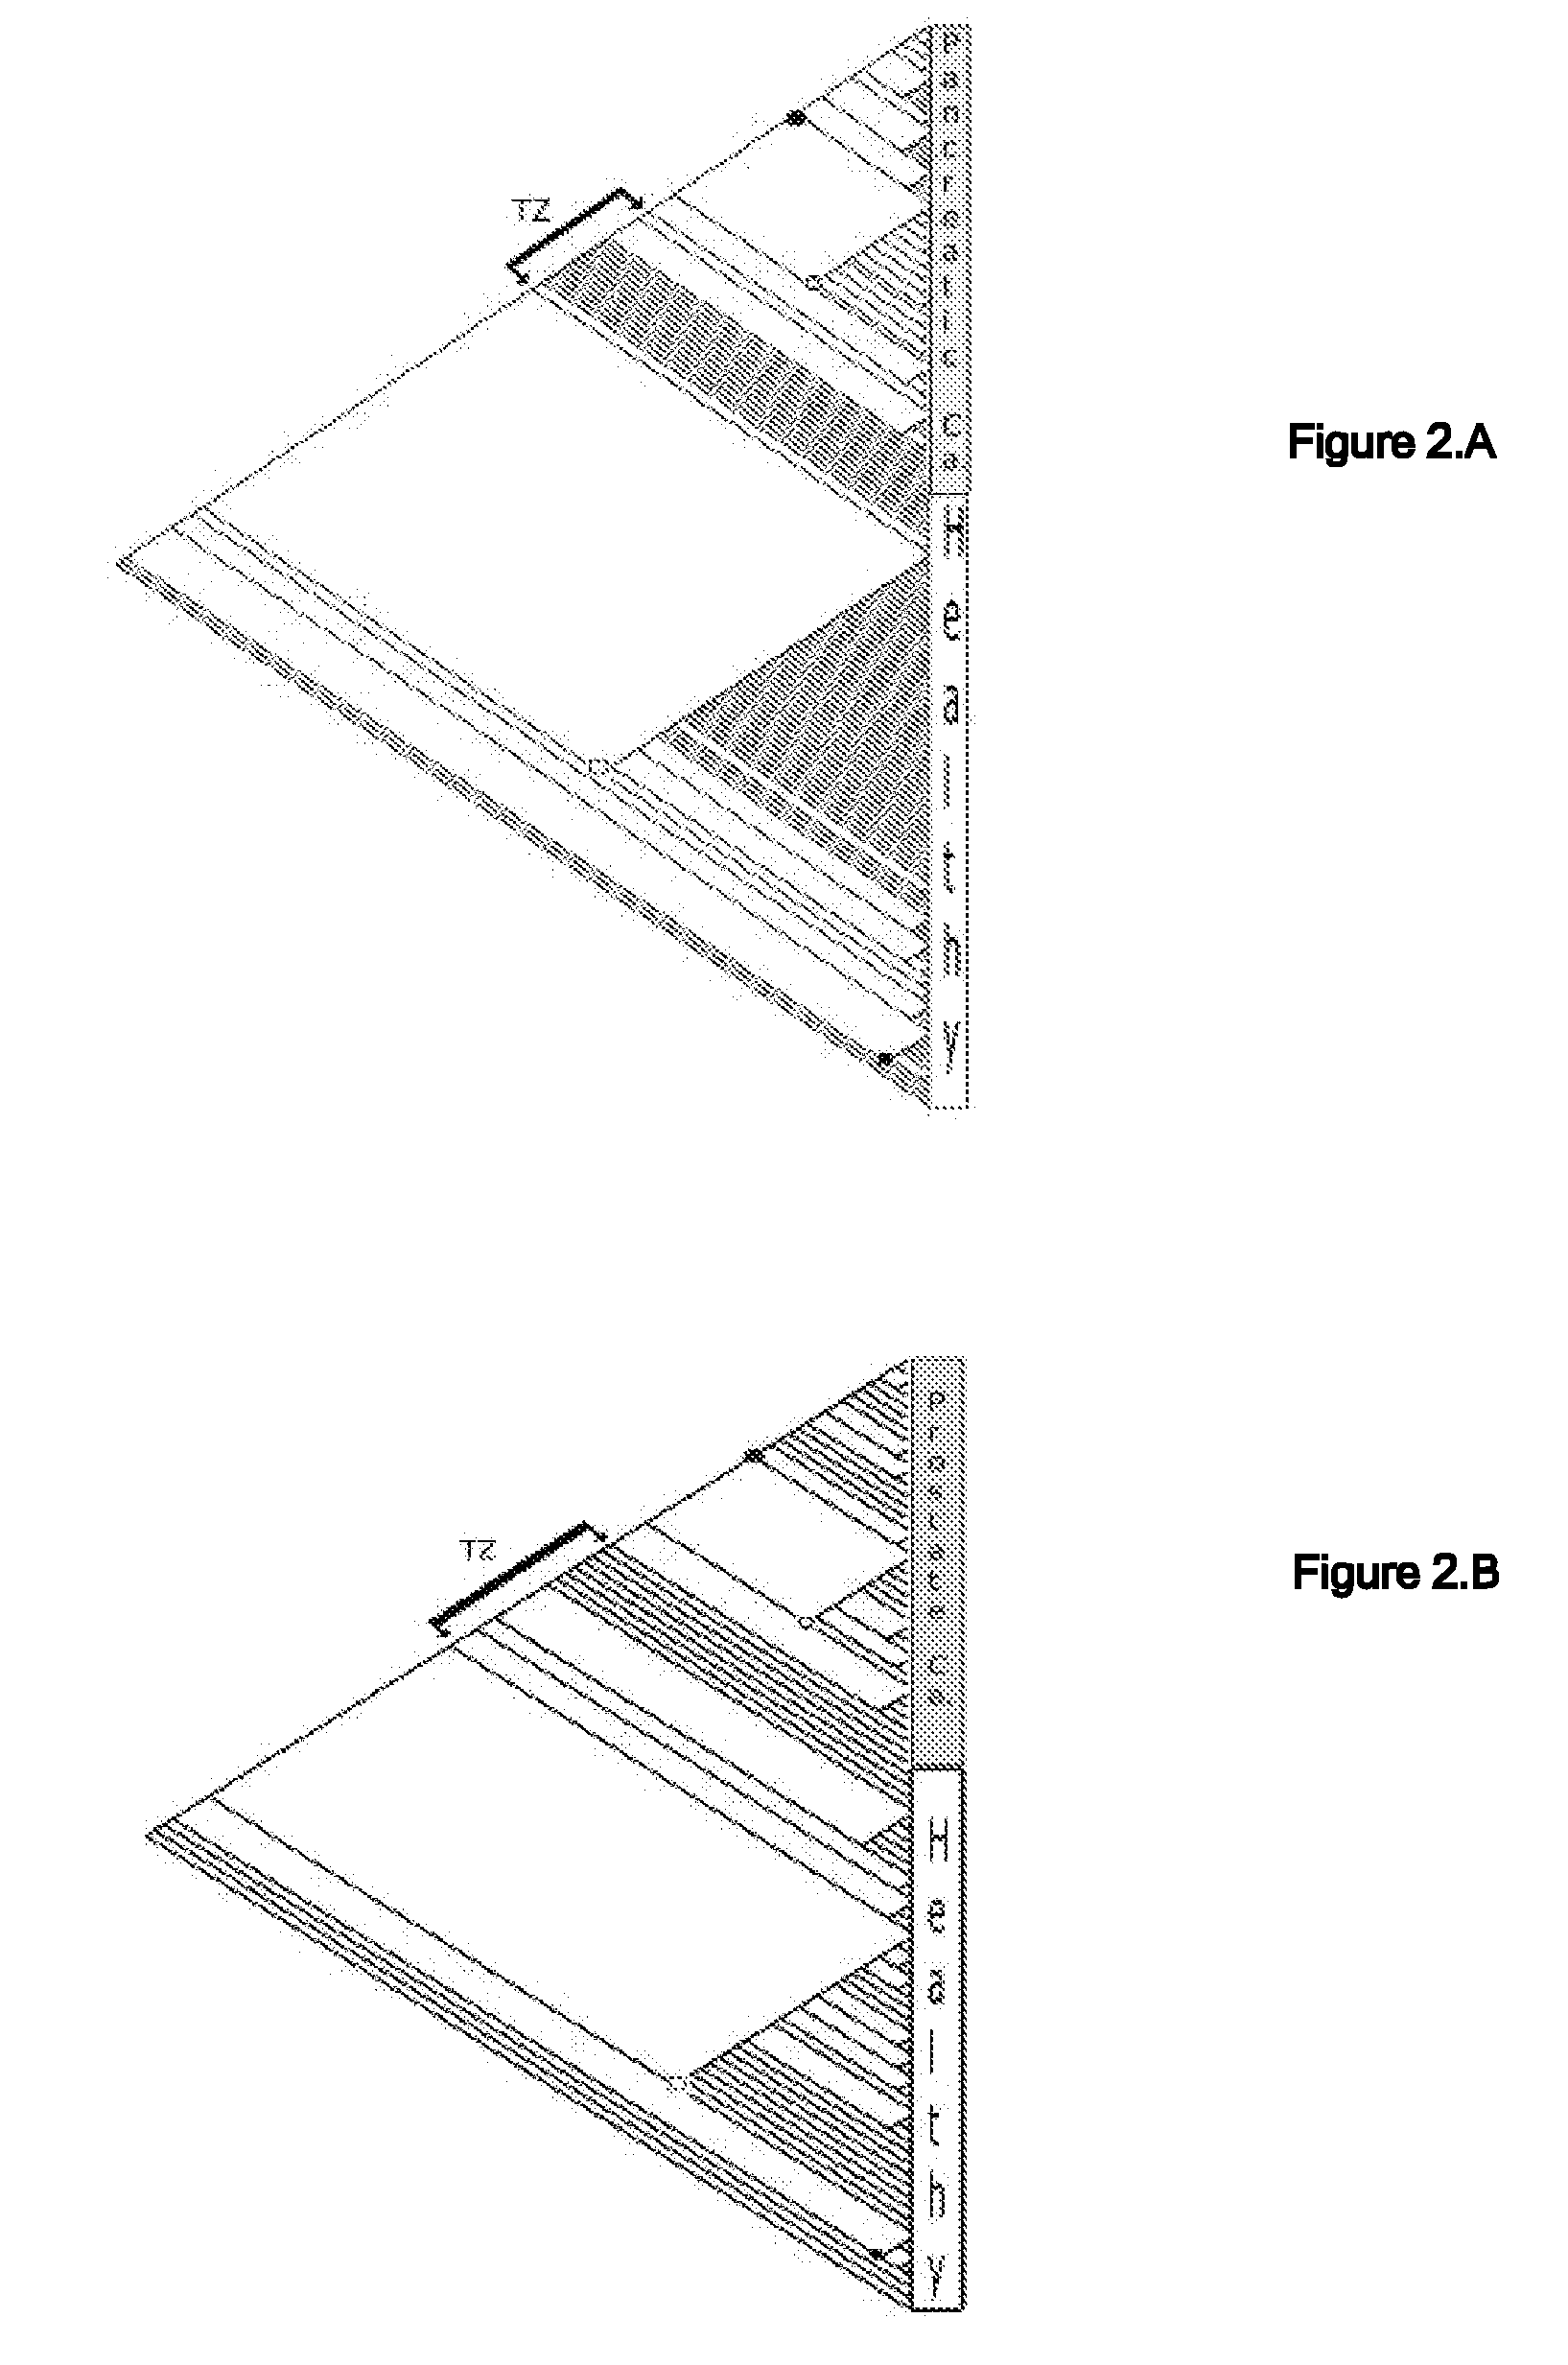
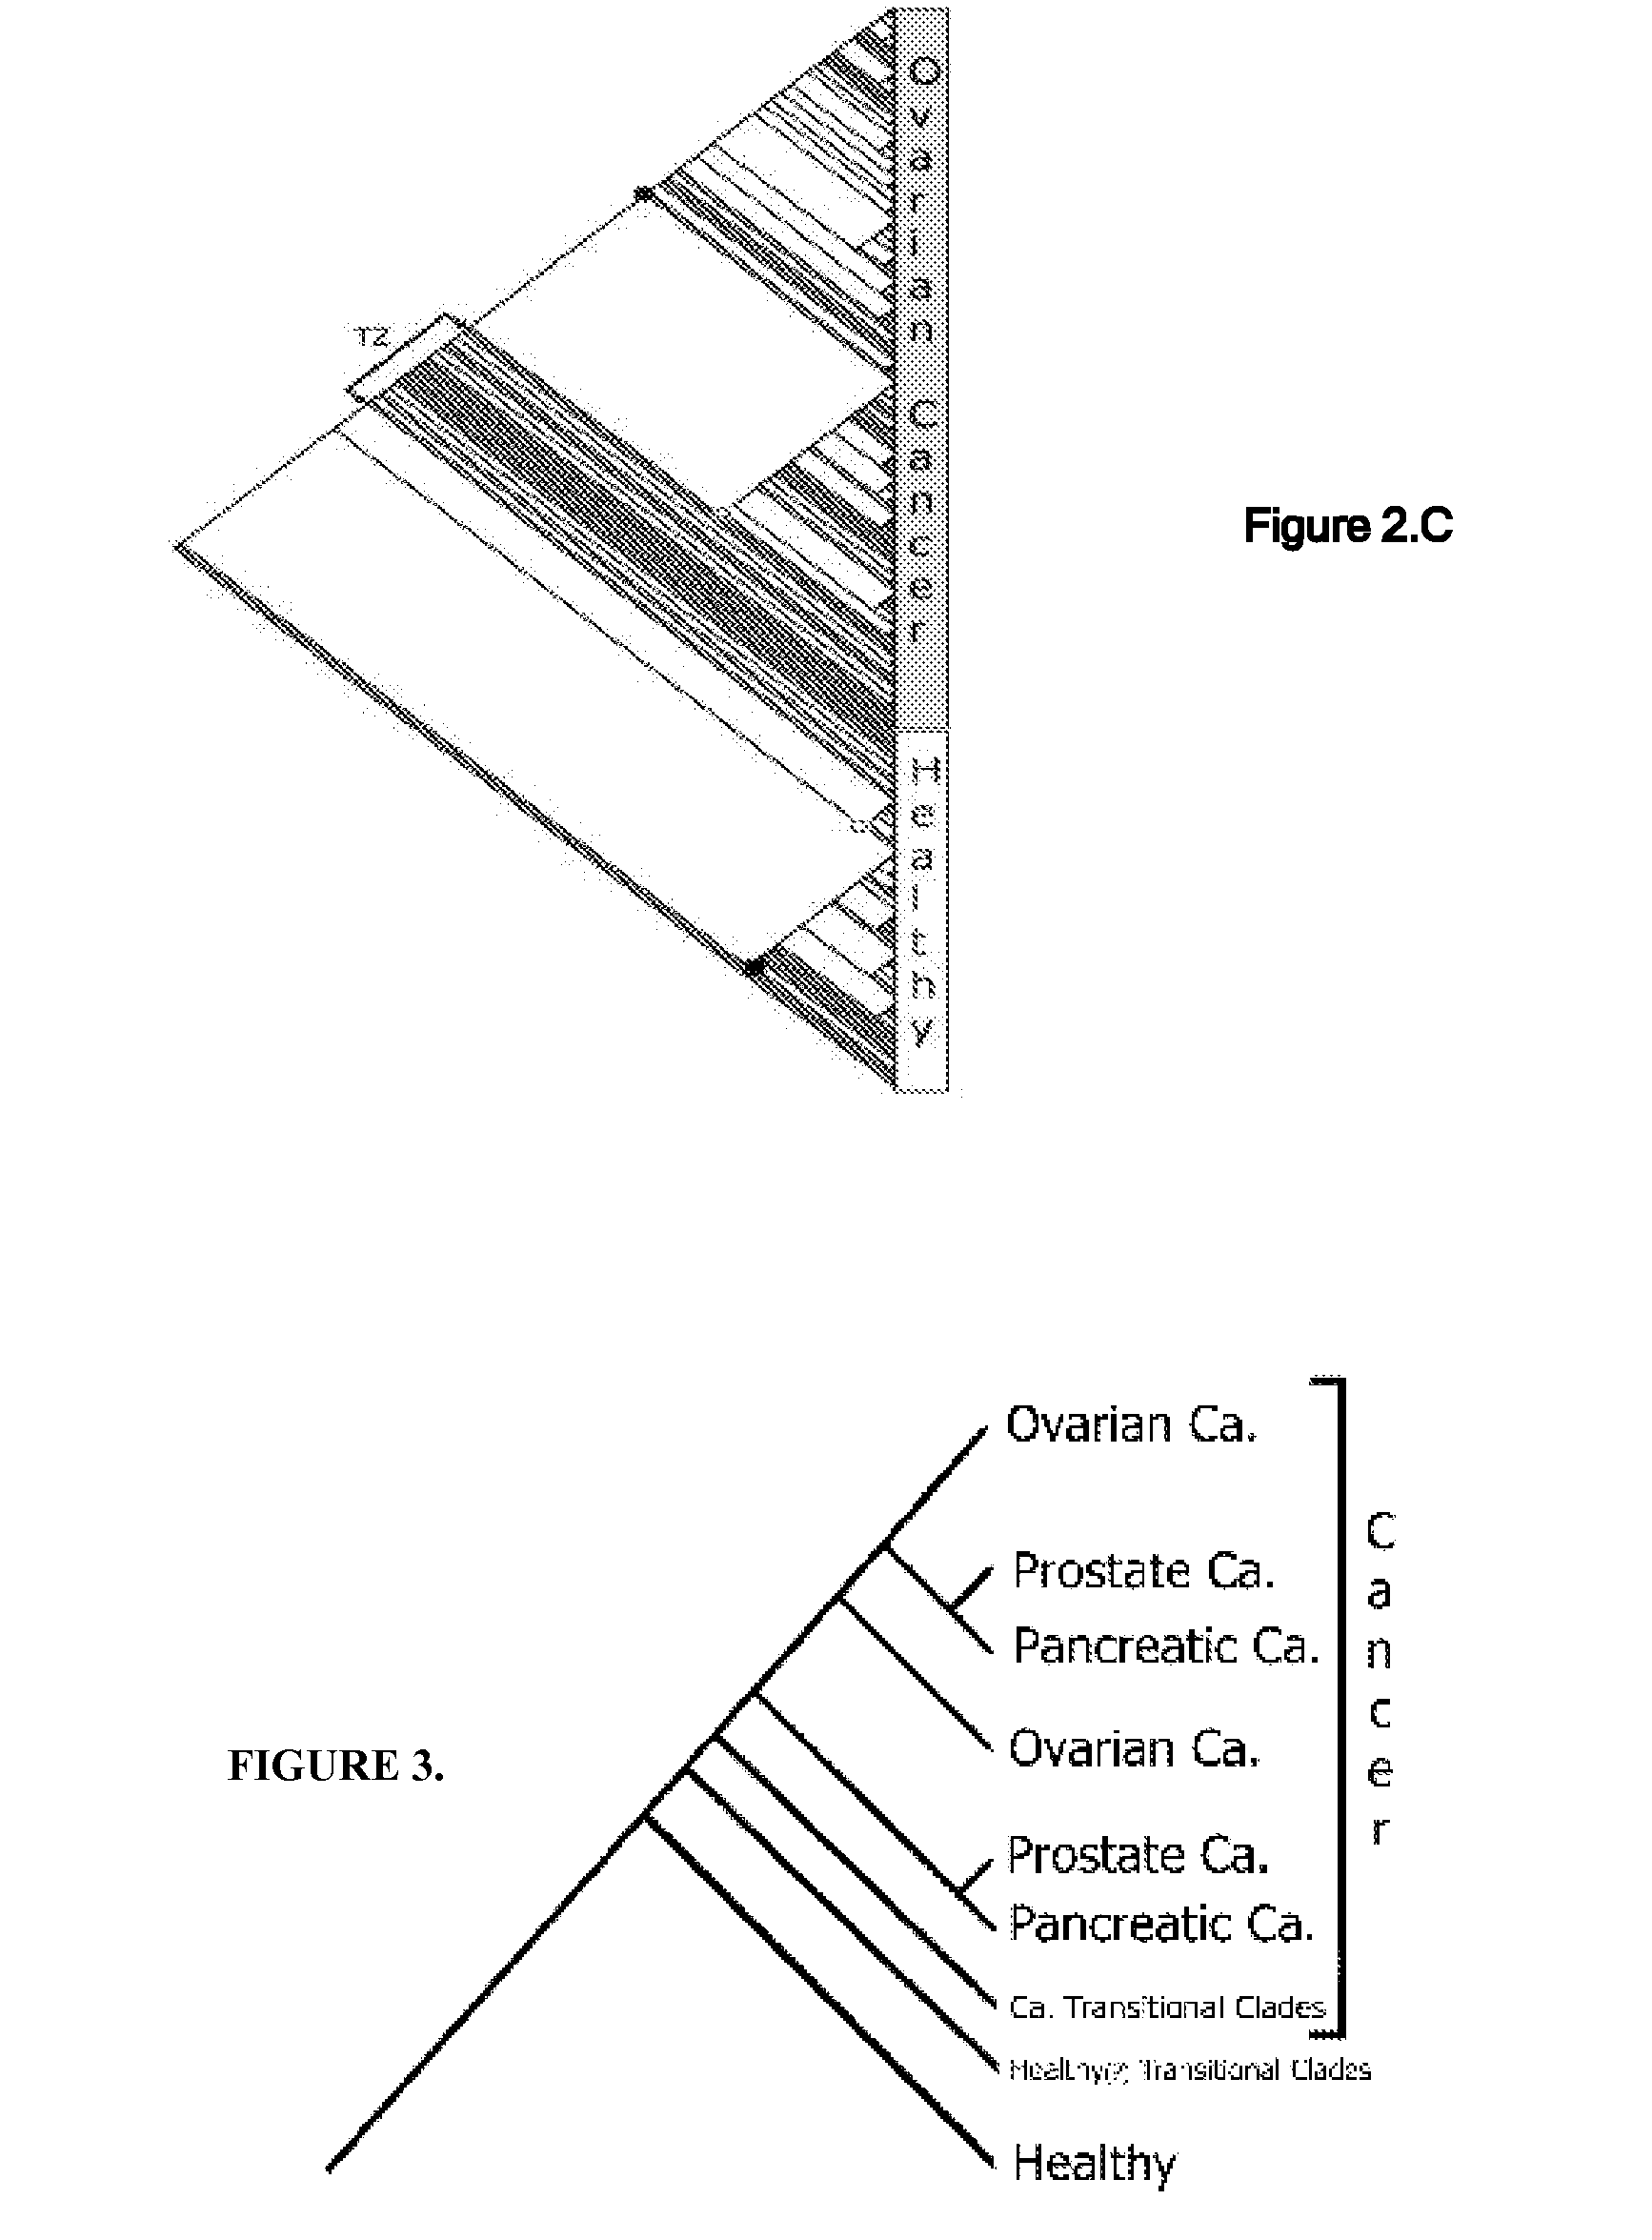
[0058] A phylogenetic tree termed cladogram that shows the hierarchical classification in a graphical format best illustrates the results of a phylogenetic analysis. Parsimony analysis produced one most parsimonious cladogram (requiring the least amount of steps in constructing a classification of specimens) for each of the pancreatic and prostate specimens (FIGS. 2A& B), 5 equally parsimonious cladograms for ovarian specimens (FIG. 2C shows only one), and several equa...

example 2

[0128] We used all the expression data points of all specimens in the analysis, except those marked as null. For polarity assessment (apomorphic [or derived] vs. plesiomorphic [or ancestral]), data was polarized with a customized algorithm (E-UNIPAL) written by the Applicants that recognized derived values of each gene when compared with the outgroups. Outgroups here are preferably composed of normal specimens only (i.e., those that have been determined to be healthy and / or normal). E-UNIPAL determines the polarity for every data point among the specimens via outgroup comparison, and then scores each value of the study group as derived (1) or ancestral (0). Ideally, the outgroup should be large enough to encompass the maximum variation within normal specimens. In a less preferred, alternate embodiment, the score can be a weighted score (preferably between 1 and 0) that can vary between data points to emphasize or de-emphasize particular values.

[0129] The phylogenetic analysis of th...

example 3

[0161] Recent data made available to us has further confirmed the results of the efficacy of the invention. Microarray data on prostate cancer tissues, both primary and metastatic (GDS1439), were obtained from http: / / www.ncbi.nlm.nih.gov / geo / and processed according to the invention. FIG. 7 shows a cladogram graphing the results of the primary and metastatic cancer using Applicant's E-UNIPAL algorithm and MIX. Metastatic cancer, which is generally more difficult to treat as the dedifferentiation in the tissue becomes more pronounced, is readily clustered together by the phylogenetic classification. The upper portion of the graph contains the metastatic delineated from the lower portion of the graph containing primary cancer specimens. In particular, the upper part of the cladogram (specimens in red lettering: GSM74890, GSM74891, GSM74888, GSM74889, GSM74892, GSM74893) are the metastatic prostate specimens; the part below it (specimens in black lettering: GSM74882, GSM74886, GSM74887...


PUM

PropertyMeasurementUnit
Volumeaaaaaaaaaa
Fractionaaaaaaaaaa
Fractionaaaaaaaaaa

Abstract

A universal data-mining platform capable of analyzing mass spectrometry (MS) serum proteomic profiles and/or gene array data to produce biologically meaningful classification; i.e., group together biologically related specimens into clades. This platform utilizes the principles of phylogenetics, such as parsimony, to reveal susceptibility to cancer development (or other physiological or pathophysiological conditions), diagnosis and typing of cancer, identifying stages of cancer, as well as post-treatment evaluation. To place specimens into their corresponding clade(s), the invention utilizes two algorithms: a new data-mining parsing algorithm, and a publicly available phylogenetic algorithm (MIX). By outgroup comparison (i.e., using a normal set as the standard reference), the parsing algorithm identifies under and/or overexpressed gene values or in the case of sera, (i) novel or (ii) vanished MS peaks, and peaks signifying (iii) up or (iv) down regulated proteins, and scores the variations as either derived (do not exit in the outgroup set) or ancestral (exist in the outgroup set); the derived is given a score of “1”, and the ancestral a score of “0”—these are called the polarized values. Furthermore, the shared derived characters that it identifies are potential biomarkers for cancers and other conditions and their subclasses.

Description

CROSS REFERENCE TO RELATED APPLICATIONS [0001] This application claims the benefit of U.S. Provisional Application 60 / 796,351, filed Apr. 28, 2006, which is incorporated herein by reference. BACKGROUND OF THE INVENTION [0002] 1. Field of the Invention [0003] The present invention relates a universal data-mining platform capable of analyzing mass spectrometry (MS) serum proteomic profiles and / or gene array data to produce biologically meaningful classification; i.e., group together biologically related specimens. This platform utilizes the principles of phylogenetics, such as parsimony, to analyze the genetic, physiological, and developmental processes where deviation from the normal conditions of the population need to be assessed, profiled, or defined as well as assessing the normal physiological pathways. This may be used, for example, to reveal susceptibility to cancer development, diagnosis and typing of cancer, identifying stages of cancer, as well as post-treatment evaluation....

Claims


Application Information

Patent Timeline
IPC IPC(8): C12Q1/68G06F19/00G16B10/00G16B25/10G16B40/10
CPCG06F19/24G01N33/4833G06F19/3431G06F19/3437G06F19/20G06F19/14G06F19/3443G16H50/30G16H50/50G16H50/70G16B25/00G16B40/00Y02A90/10G16B40/10G16B25/10G16B10/00
Inventor AMRI, HAKIMAABU-ASAB, MONESCHAOUCHI, MOHAMED
Owner AMRI HAKIMA
Why Eureka
Try Eureka