
Method for analysis of single pulse pressure waves

Inactive Publication Date: 2007-11-29
EIDE PER KRISTIAN
View PDF11 Cites 8 Cited by
  • Summary
  • Abstract
  • Description
  • Claims
  • Application Information

AI Technical Summary

Benefits of technology

[0040] According to the invention, a method is described for more optimum analysis of pressure signals from detection of single pressure waves by means of non-invasive pressure sensors. During short time sequences of pressure recordings (e.g. each 3 seconds) the single pressure wave parameters are computed. Between each of said time sequences a sensor-regulating device is modified by a regulator providing a control signal to the sensor-regulating device. Results of said analysis within the processing unit provide a control signal to the regulator that in turn provide another control signal to the sensor-regulating device. Thereby, the inventive method of single wave analysis may modify the function of the sensor device to give the most optimal single pressure wave detection. An example is described with regard to applanation tonomtery, though this represents no limitation of the scope of the invention. A pneumatic pump and bellow press the transducer array against the skin and tissue above the cavity wherein pressure is measured (e.g. artery), usually referred to as the hold down pressure. In some devices the monitor searches through a range of pressure values until it measures an optimal signal in order to determine optimal hold-down pressure. Determining single wave distribution is however not possible by these methods. The present invention enables optimum single pressure wave detection. Furthermore, according to the present invention, there is no need for calibration by an independent technique. With regard to monitoring of fontanel pressure in infants basically the same principles are used. In these cases, tonometry enables pressures to be measured non-invasively on neonates. None of the techniques of tonometry provides the opportunity for sampling of single pressure waves.

Problems solved by technology

There are several problems with the current strategies of assessing continuous pressure recordings.
This situation raises various problems, such as drift of zero pressure level during a period of recording.
Differences in absolute zero pressure levels may cause false or inaccurate differences in pressures between different pressure recordings, making it difficult to compare pressure curves.
Other causes of erroneous continuous pressure recordings are sensor failure, misplacement of pressure sensor, low quality of sensor signals related to movement of patient, and low signal-noise ratio of other reasons.
Whether the quality of pressure signals is good or bad may be difficult to decide according to current strategies of assessing continuous pressure signals.
Non-invasive pressure monitoring is partially established for blood pressure and ocular pressure monitoring, though no methods or devices allows for continuous single wave monitoring with identification of single wave distribution.

Method used


Image

  • Method for analysis of single pulse pressure waves
  • Method for analysis of single pulse pressure waves
  • Method for analysis of single pulse pressure waves

Examples


Embodiment Construction

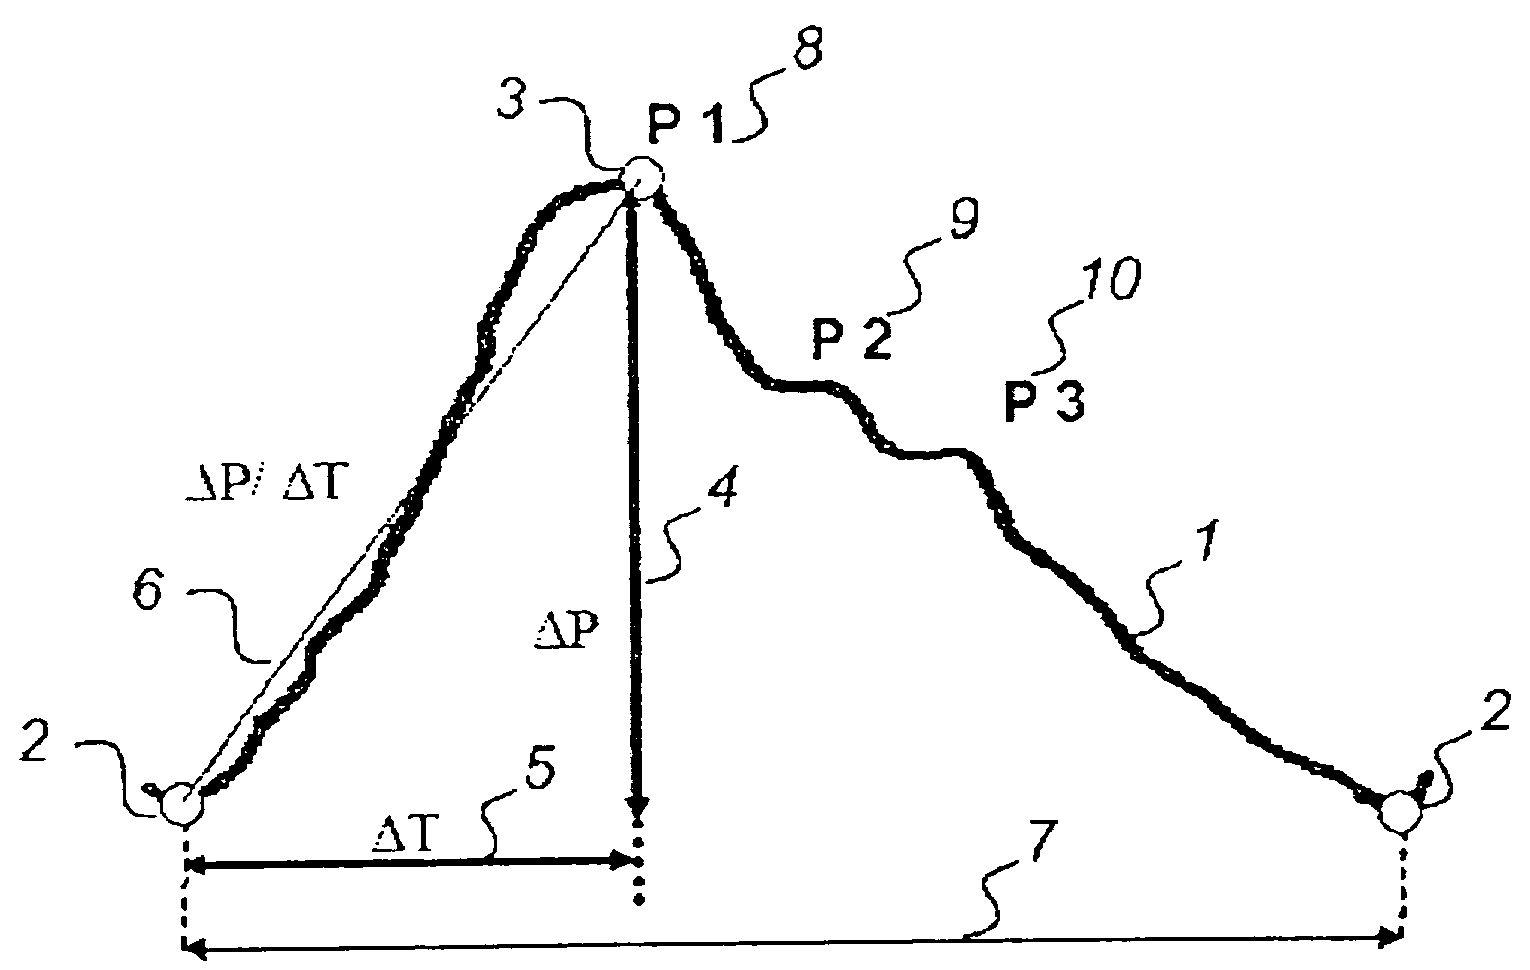
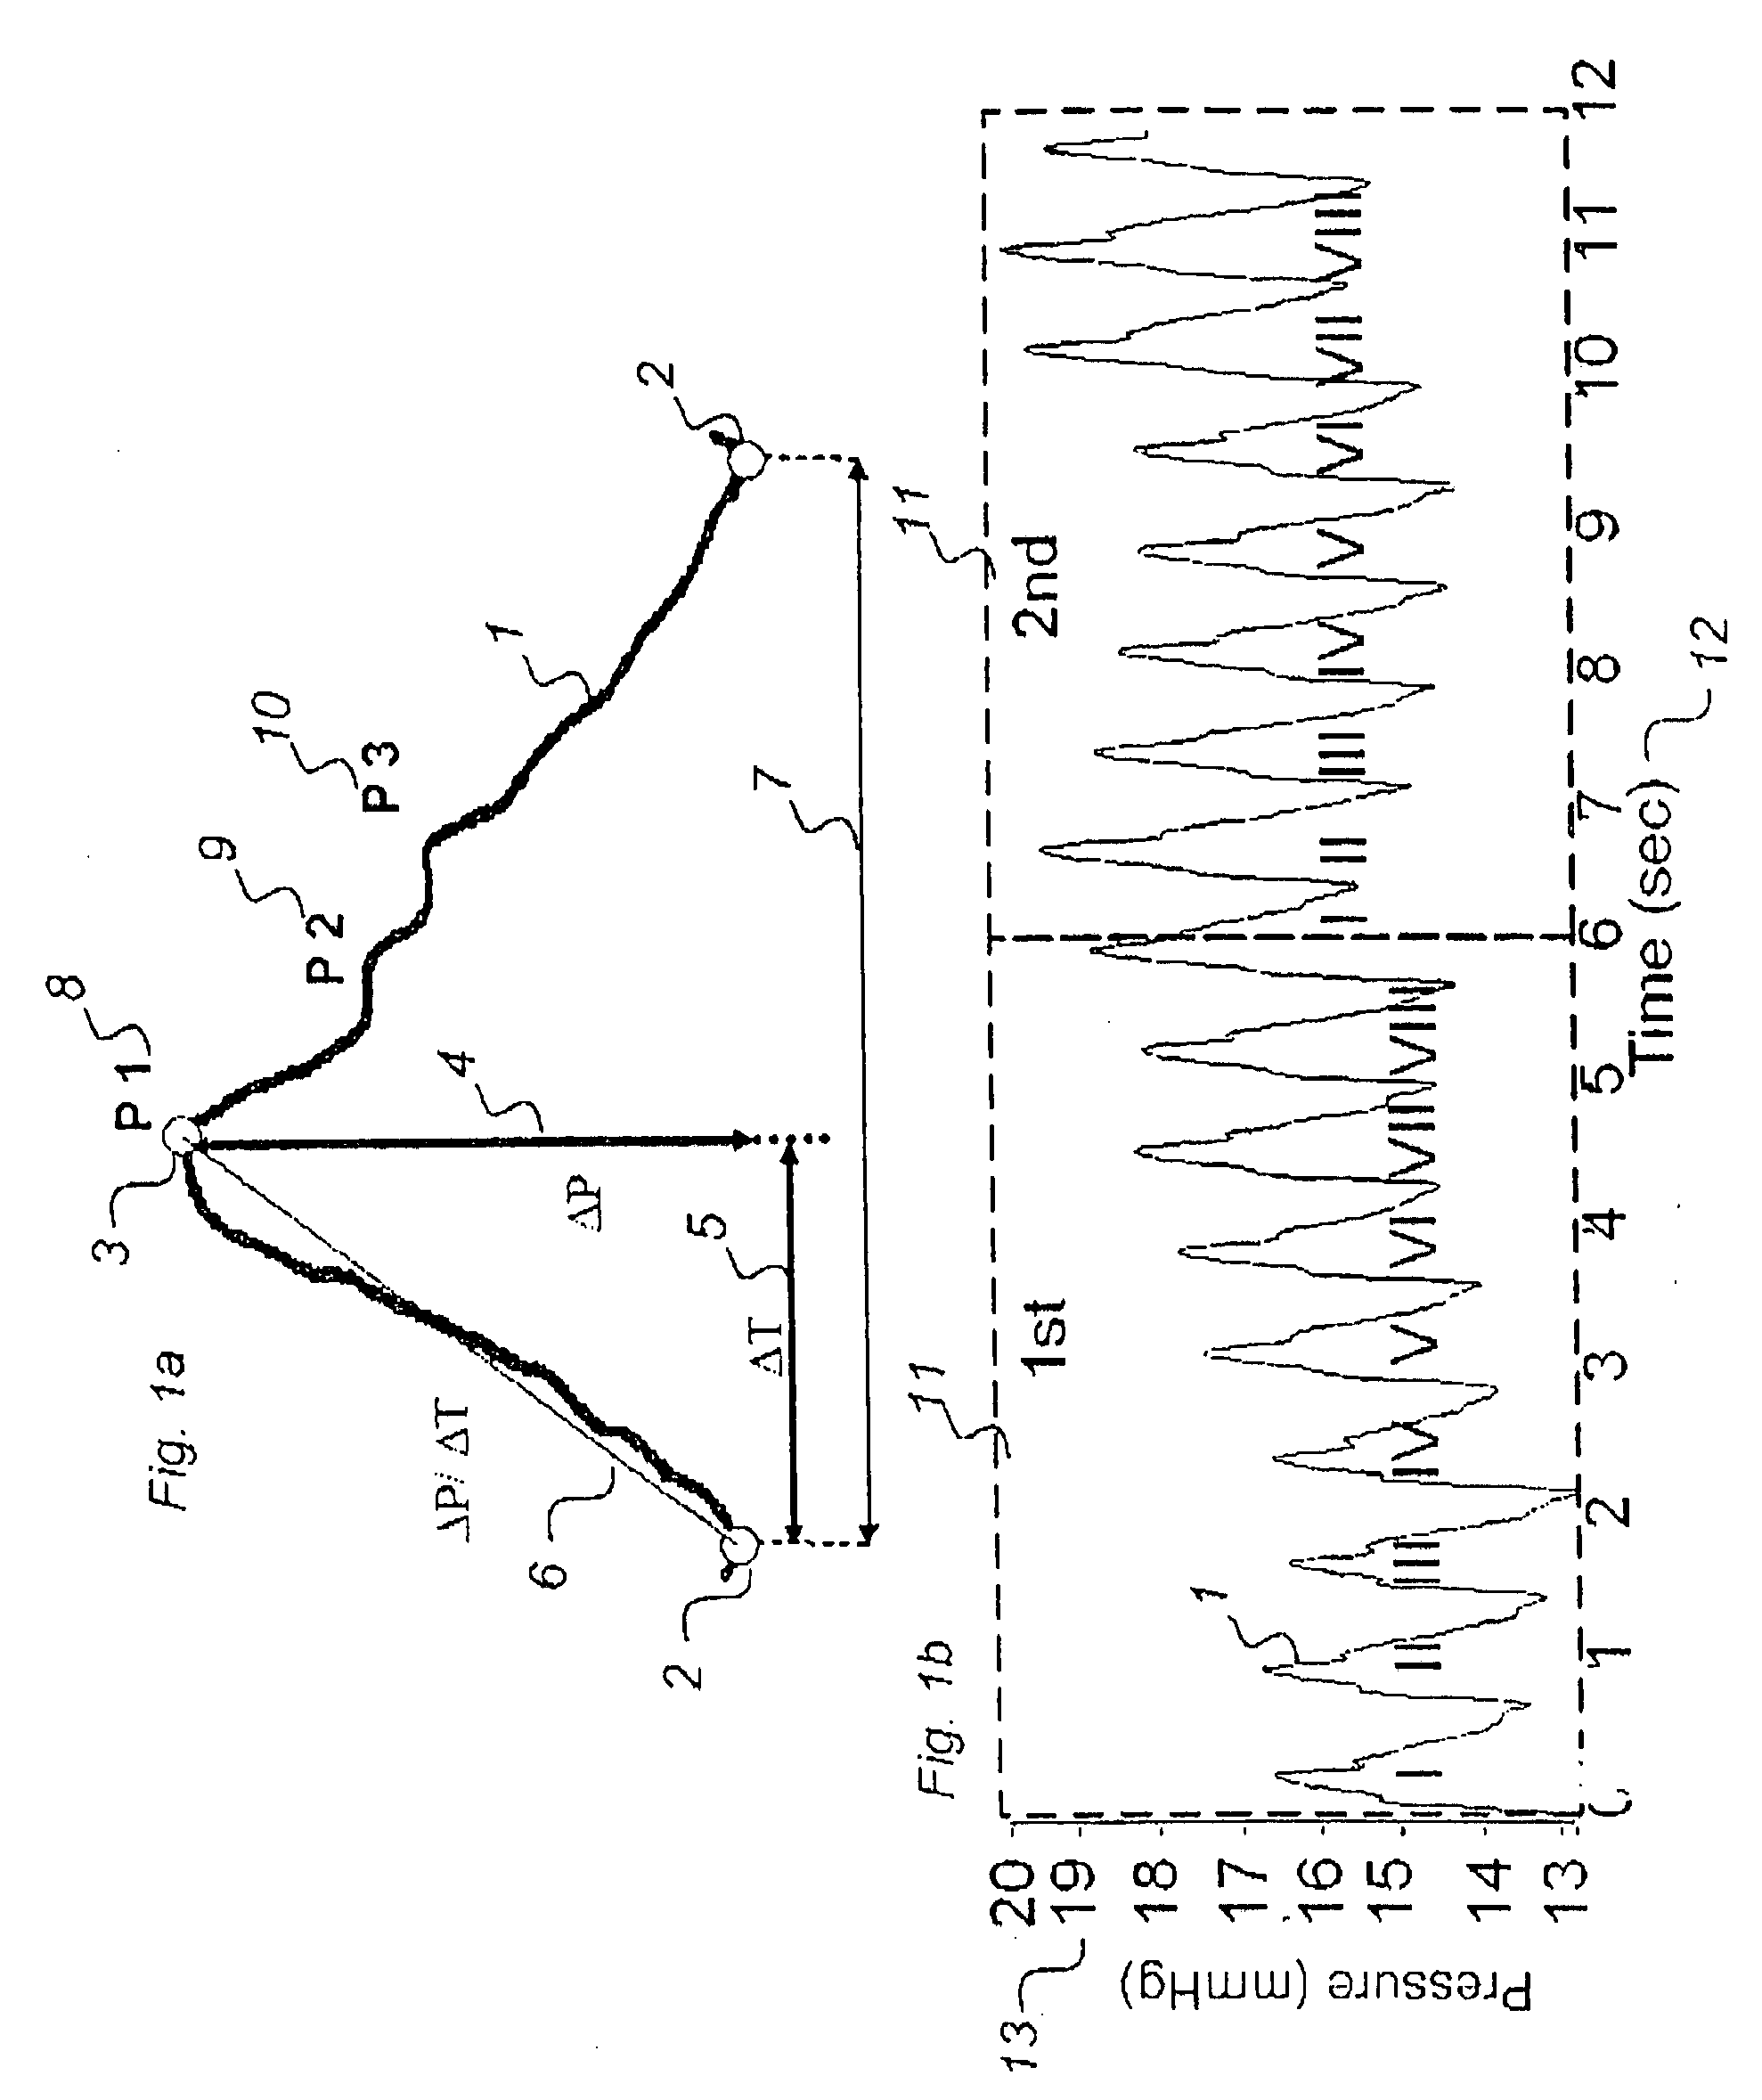
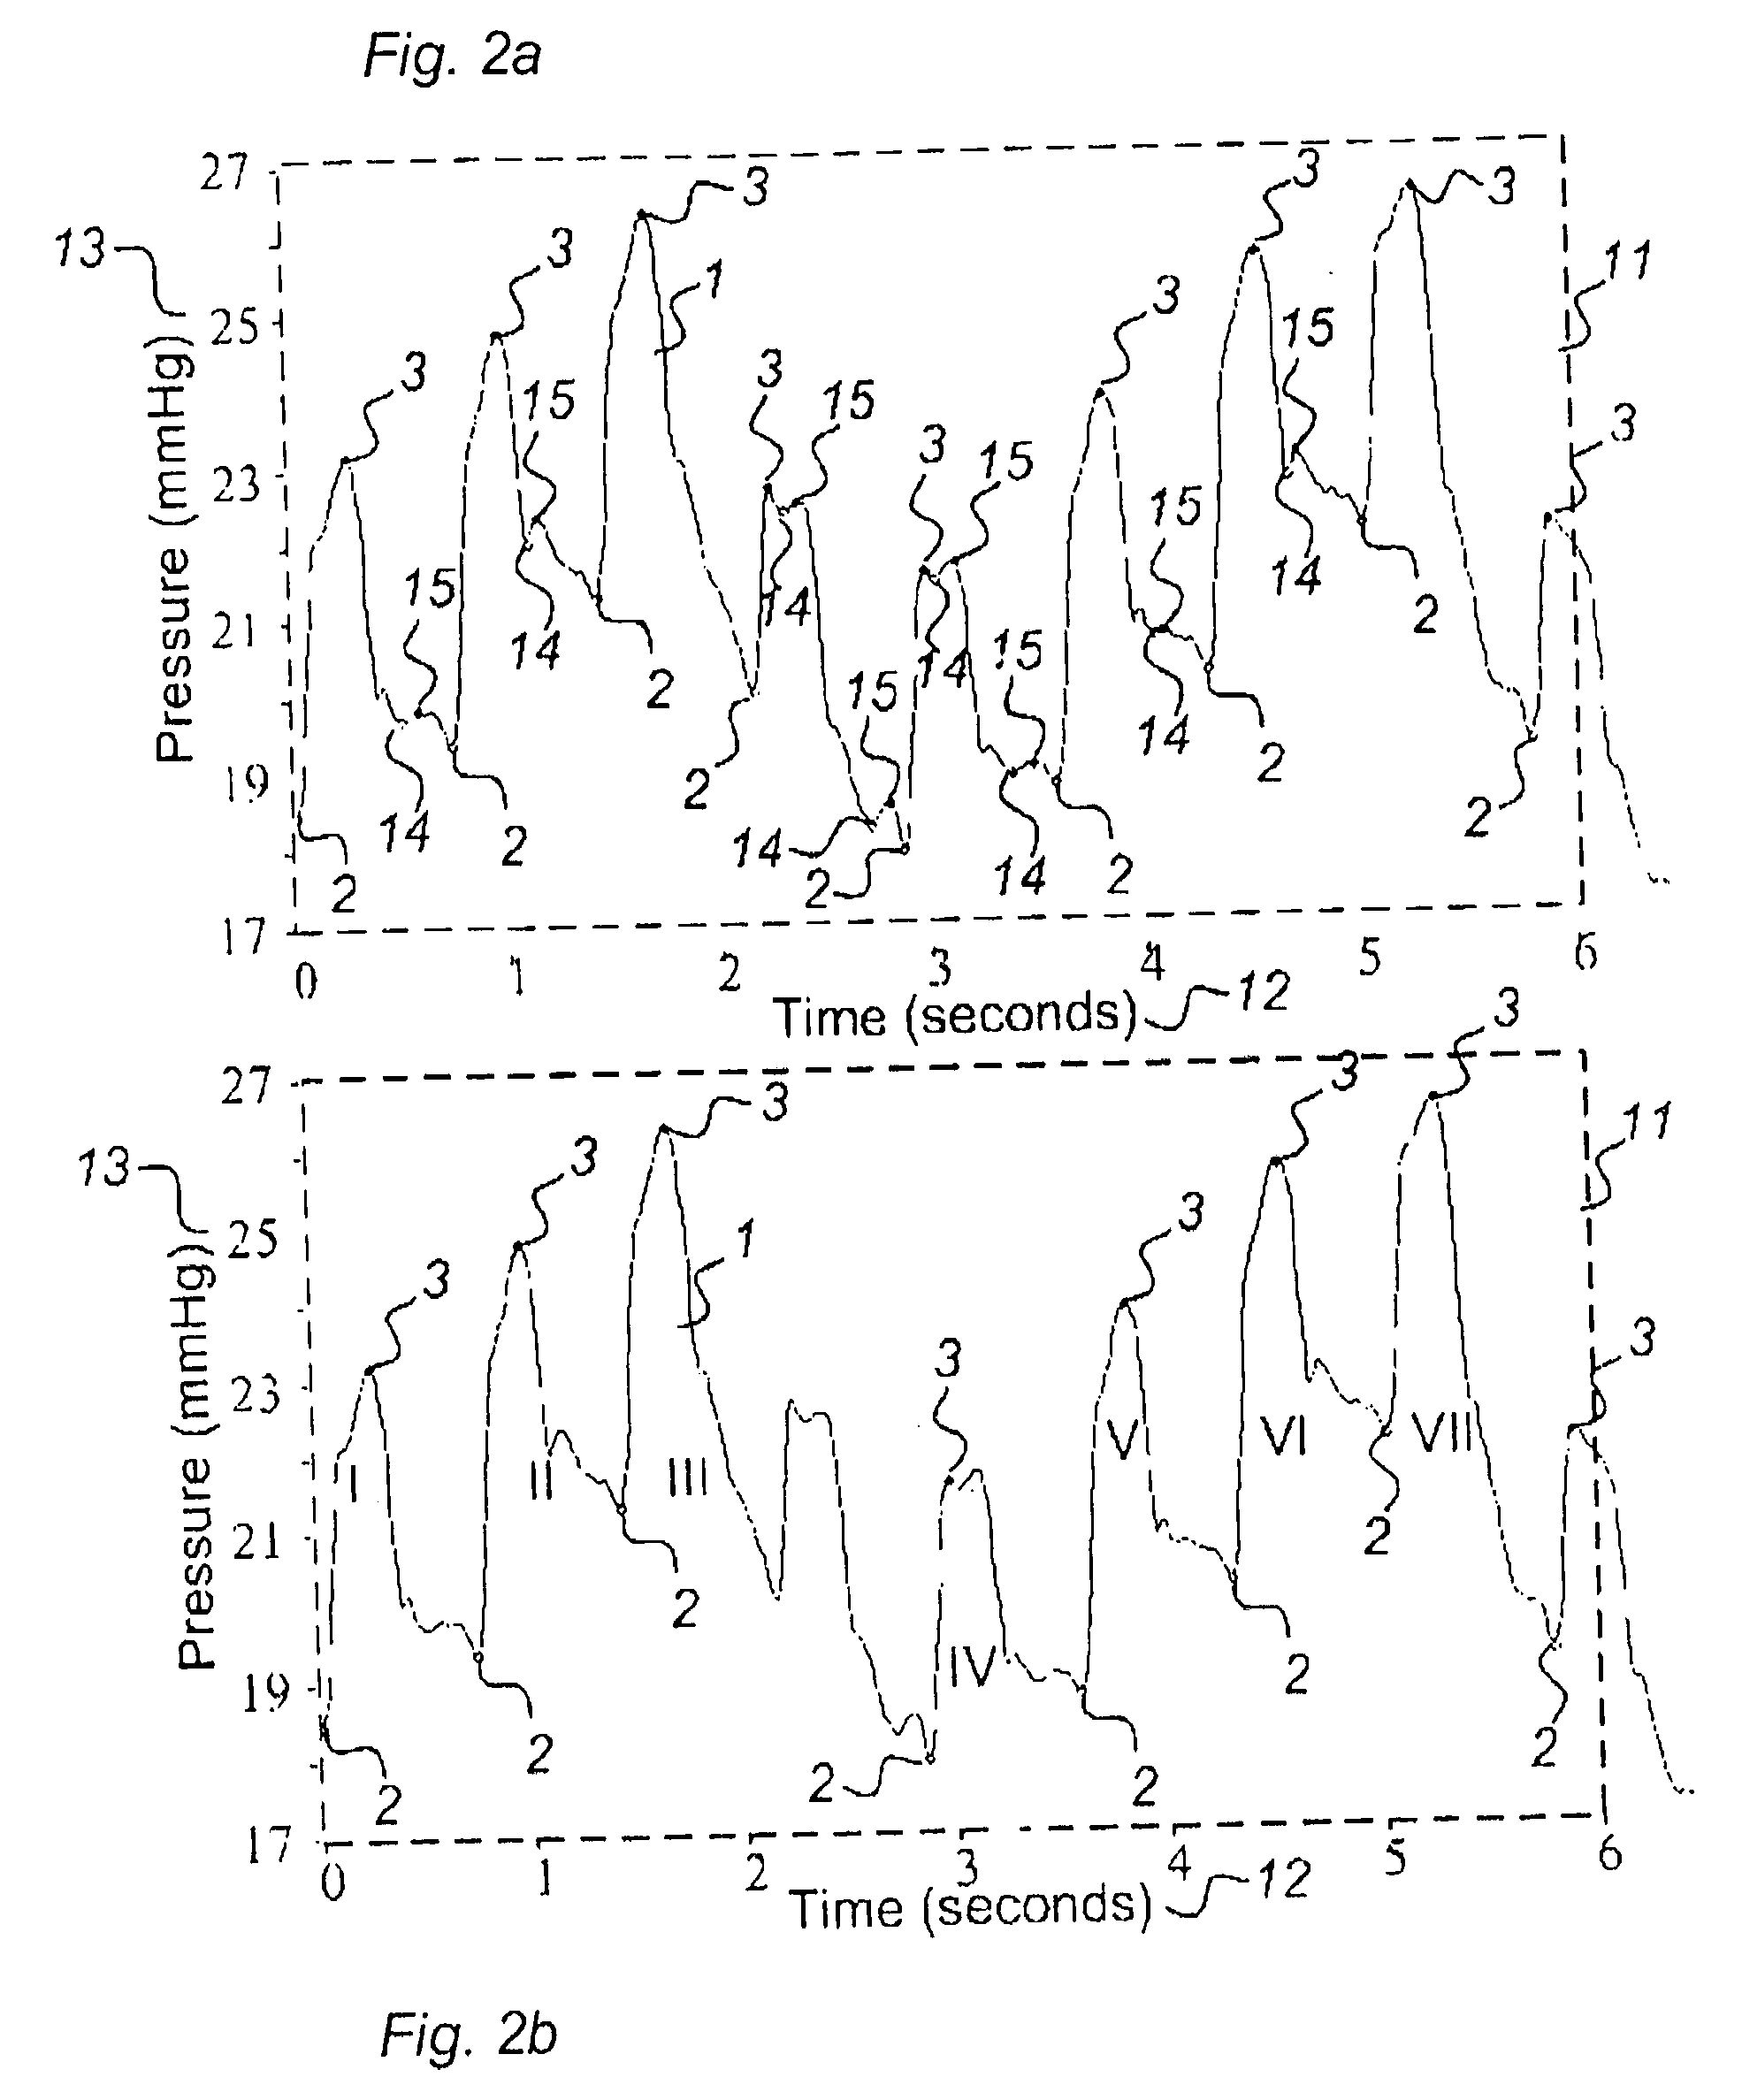
[0054] With regard to sampling, analysis and presentation of single pulse pressure waves 1, relative differences in pressures are computed, not related to a zero pressure level such as the atmospheric pressure. The invention provides measurement and analysis of the following parameters included in the time sequences (FIG. 1):

a) Minimum (Pmin) 2 is defined as the diastolic minimum pressure of the single wave, or as the valley of the wave. An individual single pressure wave starts and ends with a diastolic minimum (Pmin) value.

b) Maximum (Pmax) 3 is defined as the systolic maximum pressure of the single wave, or defined as the peak of the wave.

c) Amplitude (ΔP) 4 is defined as the pressure difference when pressures increase from diastolic minimum pressure (Pmin) to systolic maximum pressure (Pmax).

d) Latency (ΔT) 5 is defined as the time interval of the single wave when the pressures change from diastolic minimum pressure (Pmin) to systolic maximum pressure (Pmax).

e) Rise ti...


PUM


Abstract

This invention relates to a method for analysing pressure-signals derivable from pressure measurements on or in a body of a human being or animal, comprising the steps of identifying during given time sequences in a series of time sequences the single pressure waves, including related parameters [pressure amplitude ΔP, latency (ΔT), rise time coefficient (ΔP / ΔT)], determining numbers of single pressure waves with pre-selected combinations of two or more of said single pressure wave parameters during said time sequence. For the time sequences is further determined the balanced positions of single wave parameters. Two-dimensional values of balanced position may be presented as a one dimensional value after weighting of the matrix cells. The signal processing method may be used for more optimal detection of single pressure waves by means of non-invasive sensor devices.

Description

[0001] This application is a Divisional of co-pending application Ser. No. 10 / 613,122 filed on Jul. 7, 2003, and for which priority is claimed under 35 U.S.C. § 120; and this application claims priority of Application No. 60 / 422,111 filed in United States on Oct. 30, 2002 and Application No. PCT / NO03 / 00229 under 35 U.S.C. § 119; the entire contents of all are hereby incorporated by reference.BACKGROUND OF THE INVENTION [0002] 1. Field of the Invention [0003] Monitoring of pressures within human body cavities has an important role in diagnosis and management of a large number of diseases and clinical conditions. The present invention relates to a method for analyzing pressure signals derivable from pressure measurements on or in a body of a human being or animal, comprising the steps of sampling said signals at specific intervals, and converting the pressure signals into pressure-related digital data with a time reference. [0004] Further, the present invention relates to a system for...

Claims


Application Information

Patent Timeline
IPC IPC(8): A61B5/02
CPCA61B3/16A61B5/03A61B5/021A61B5/02108A61B5/02116
Inventor EIDE, PER KRISTIAN
Owner EIDE PER KRISTIAN
Learn More