

Detecting strain in birefringent materials using spectral polarimetry
- Summary
- Abstract
- Description
- Claims
- Application Information
AI Technical Summary
Benefits of technology
Problems solved by technology
Method used
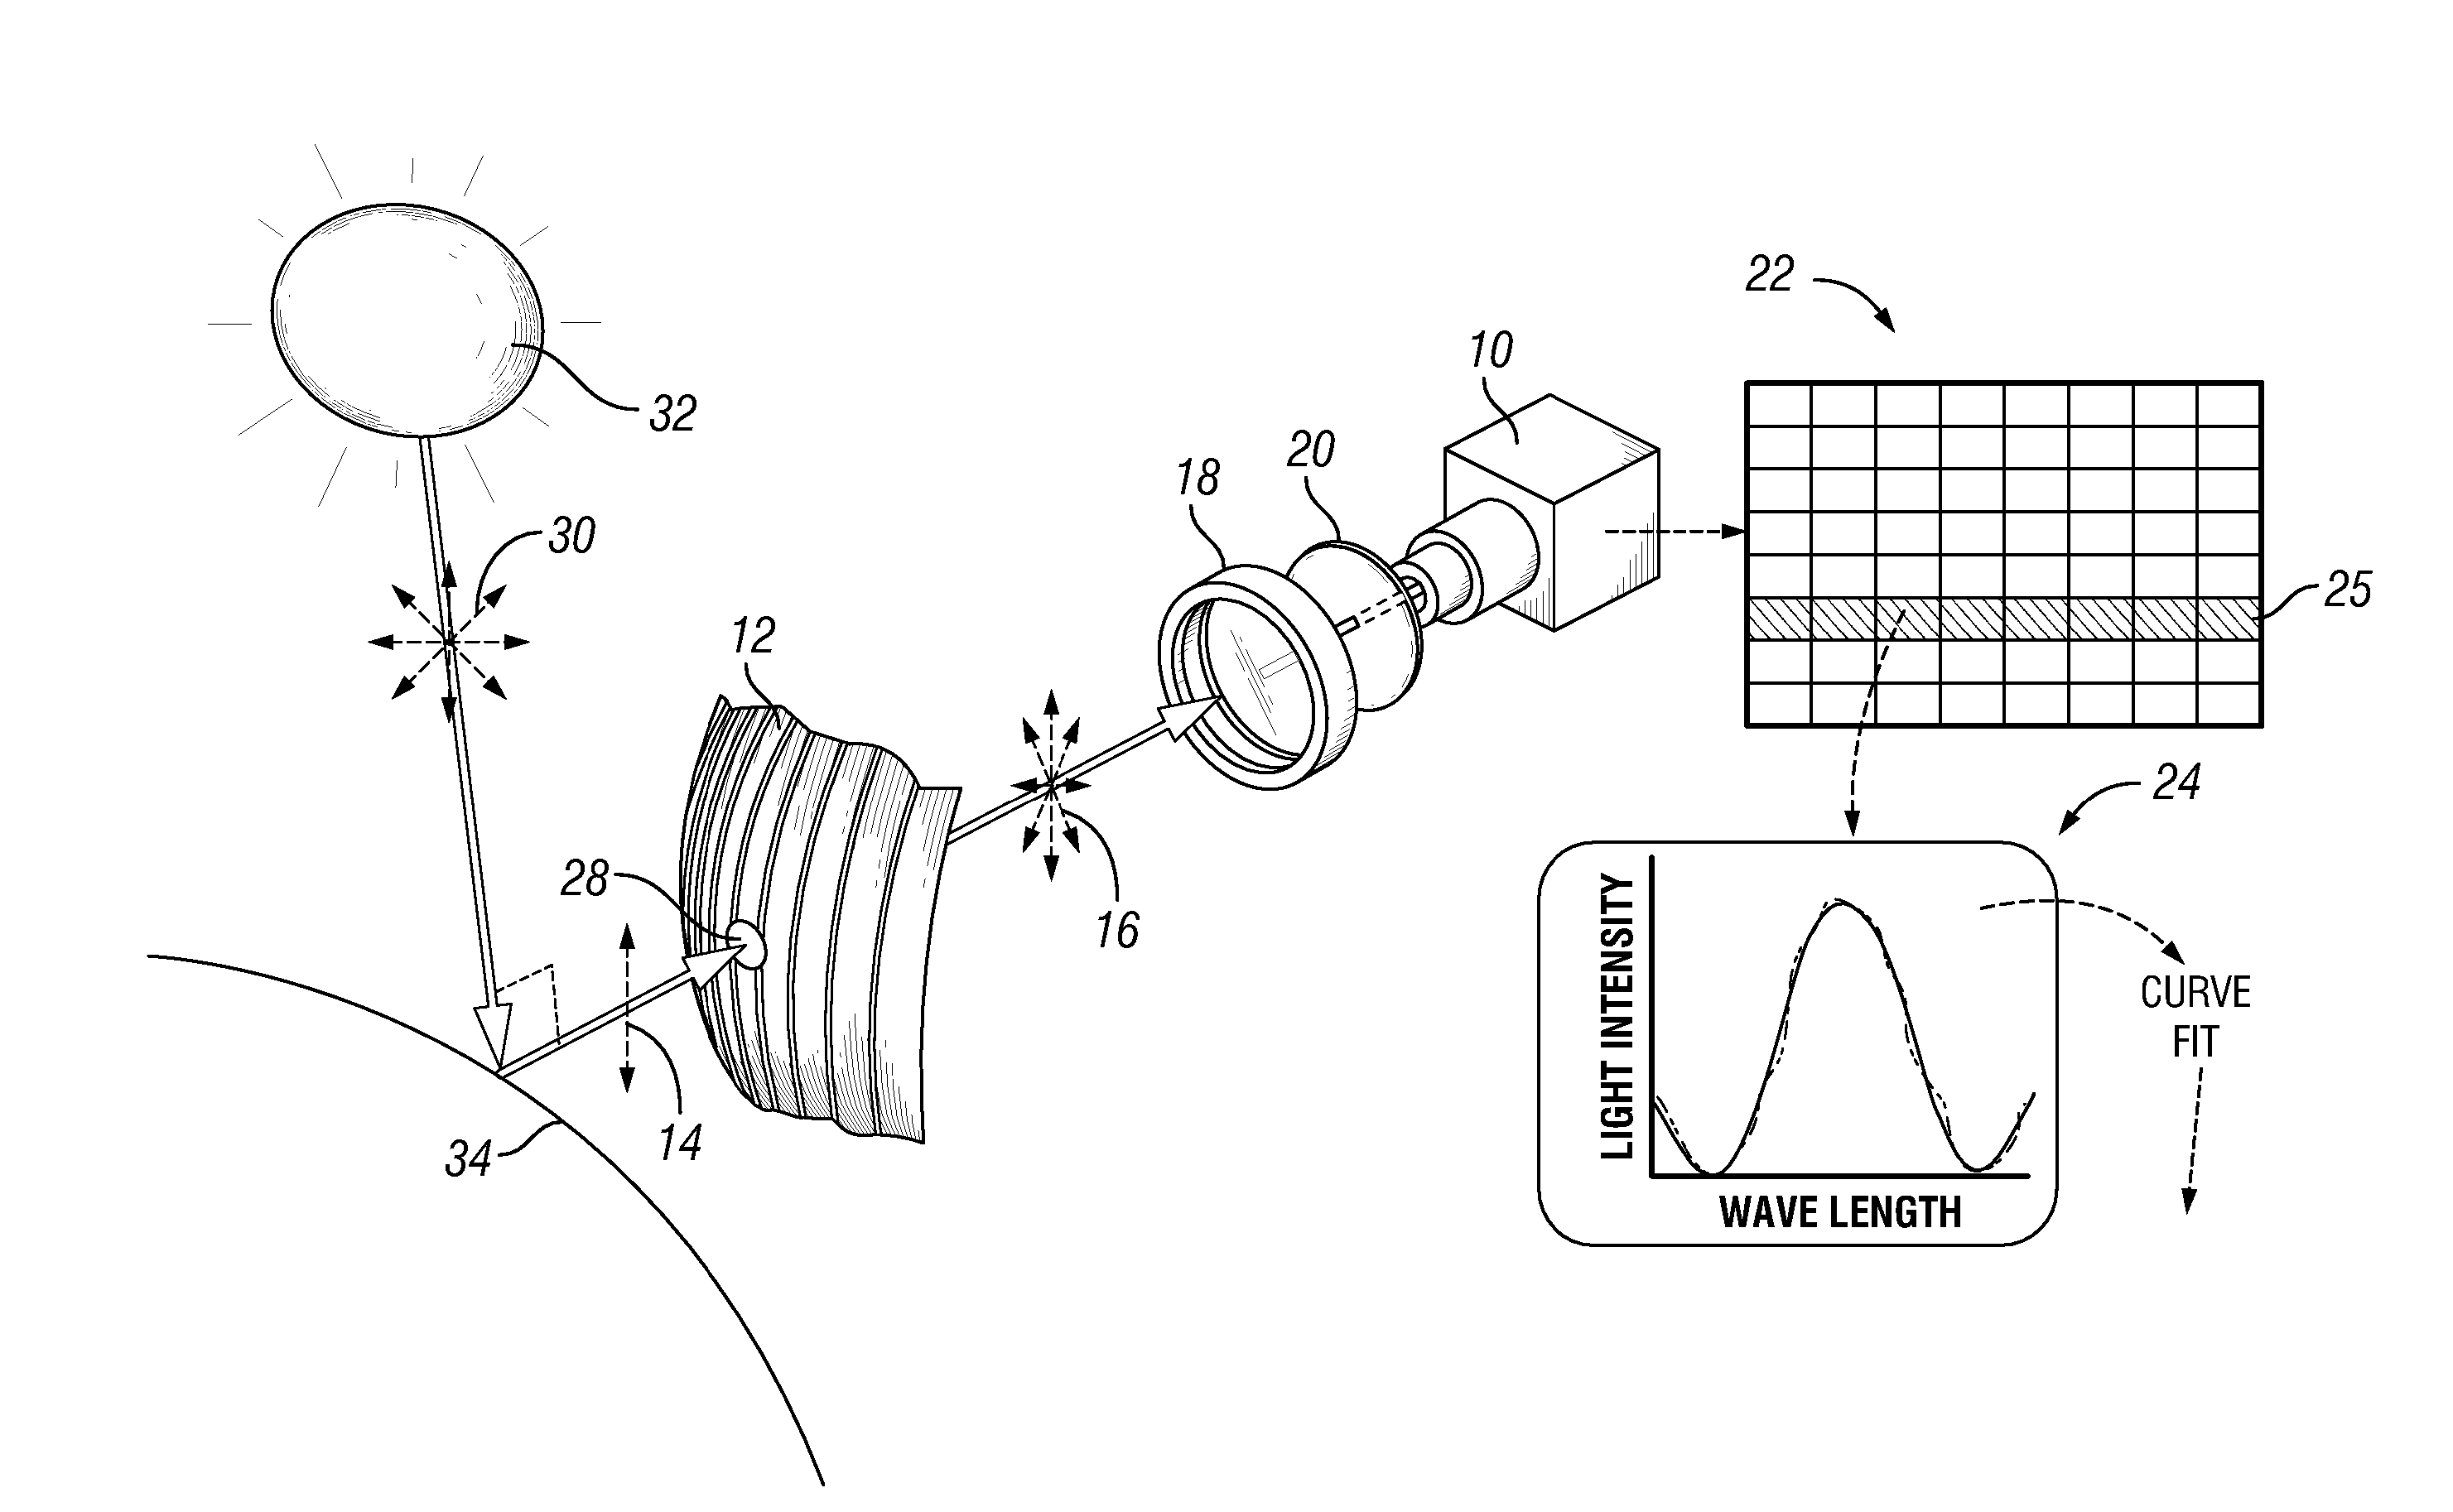
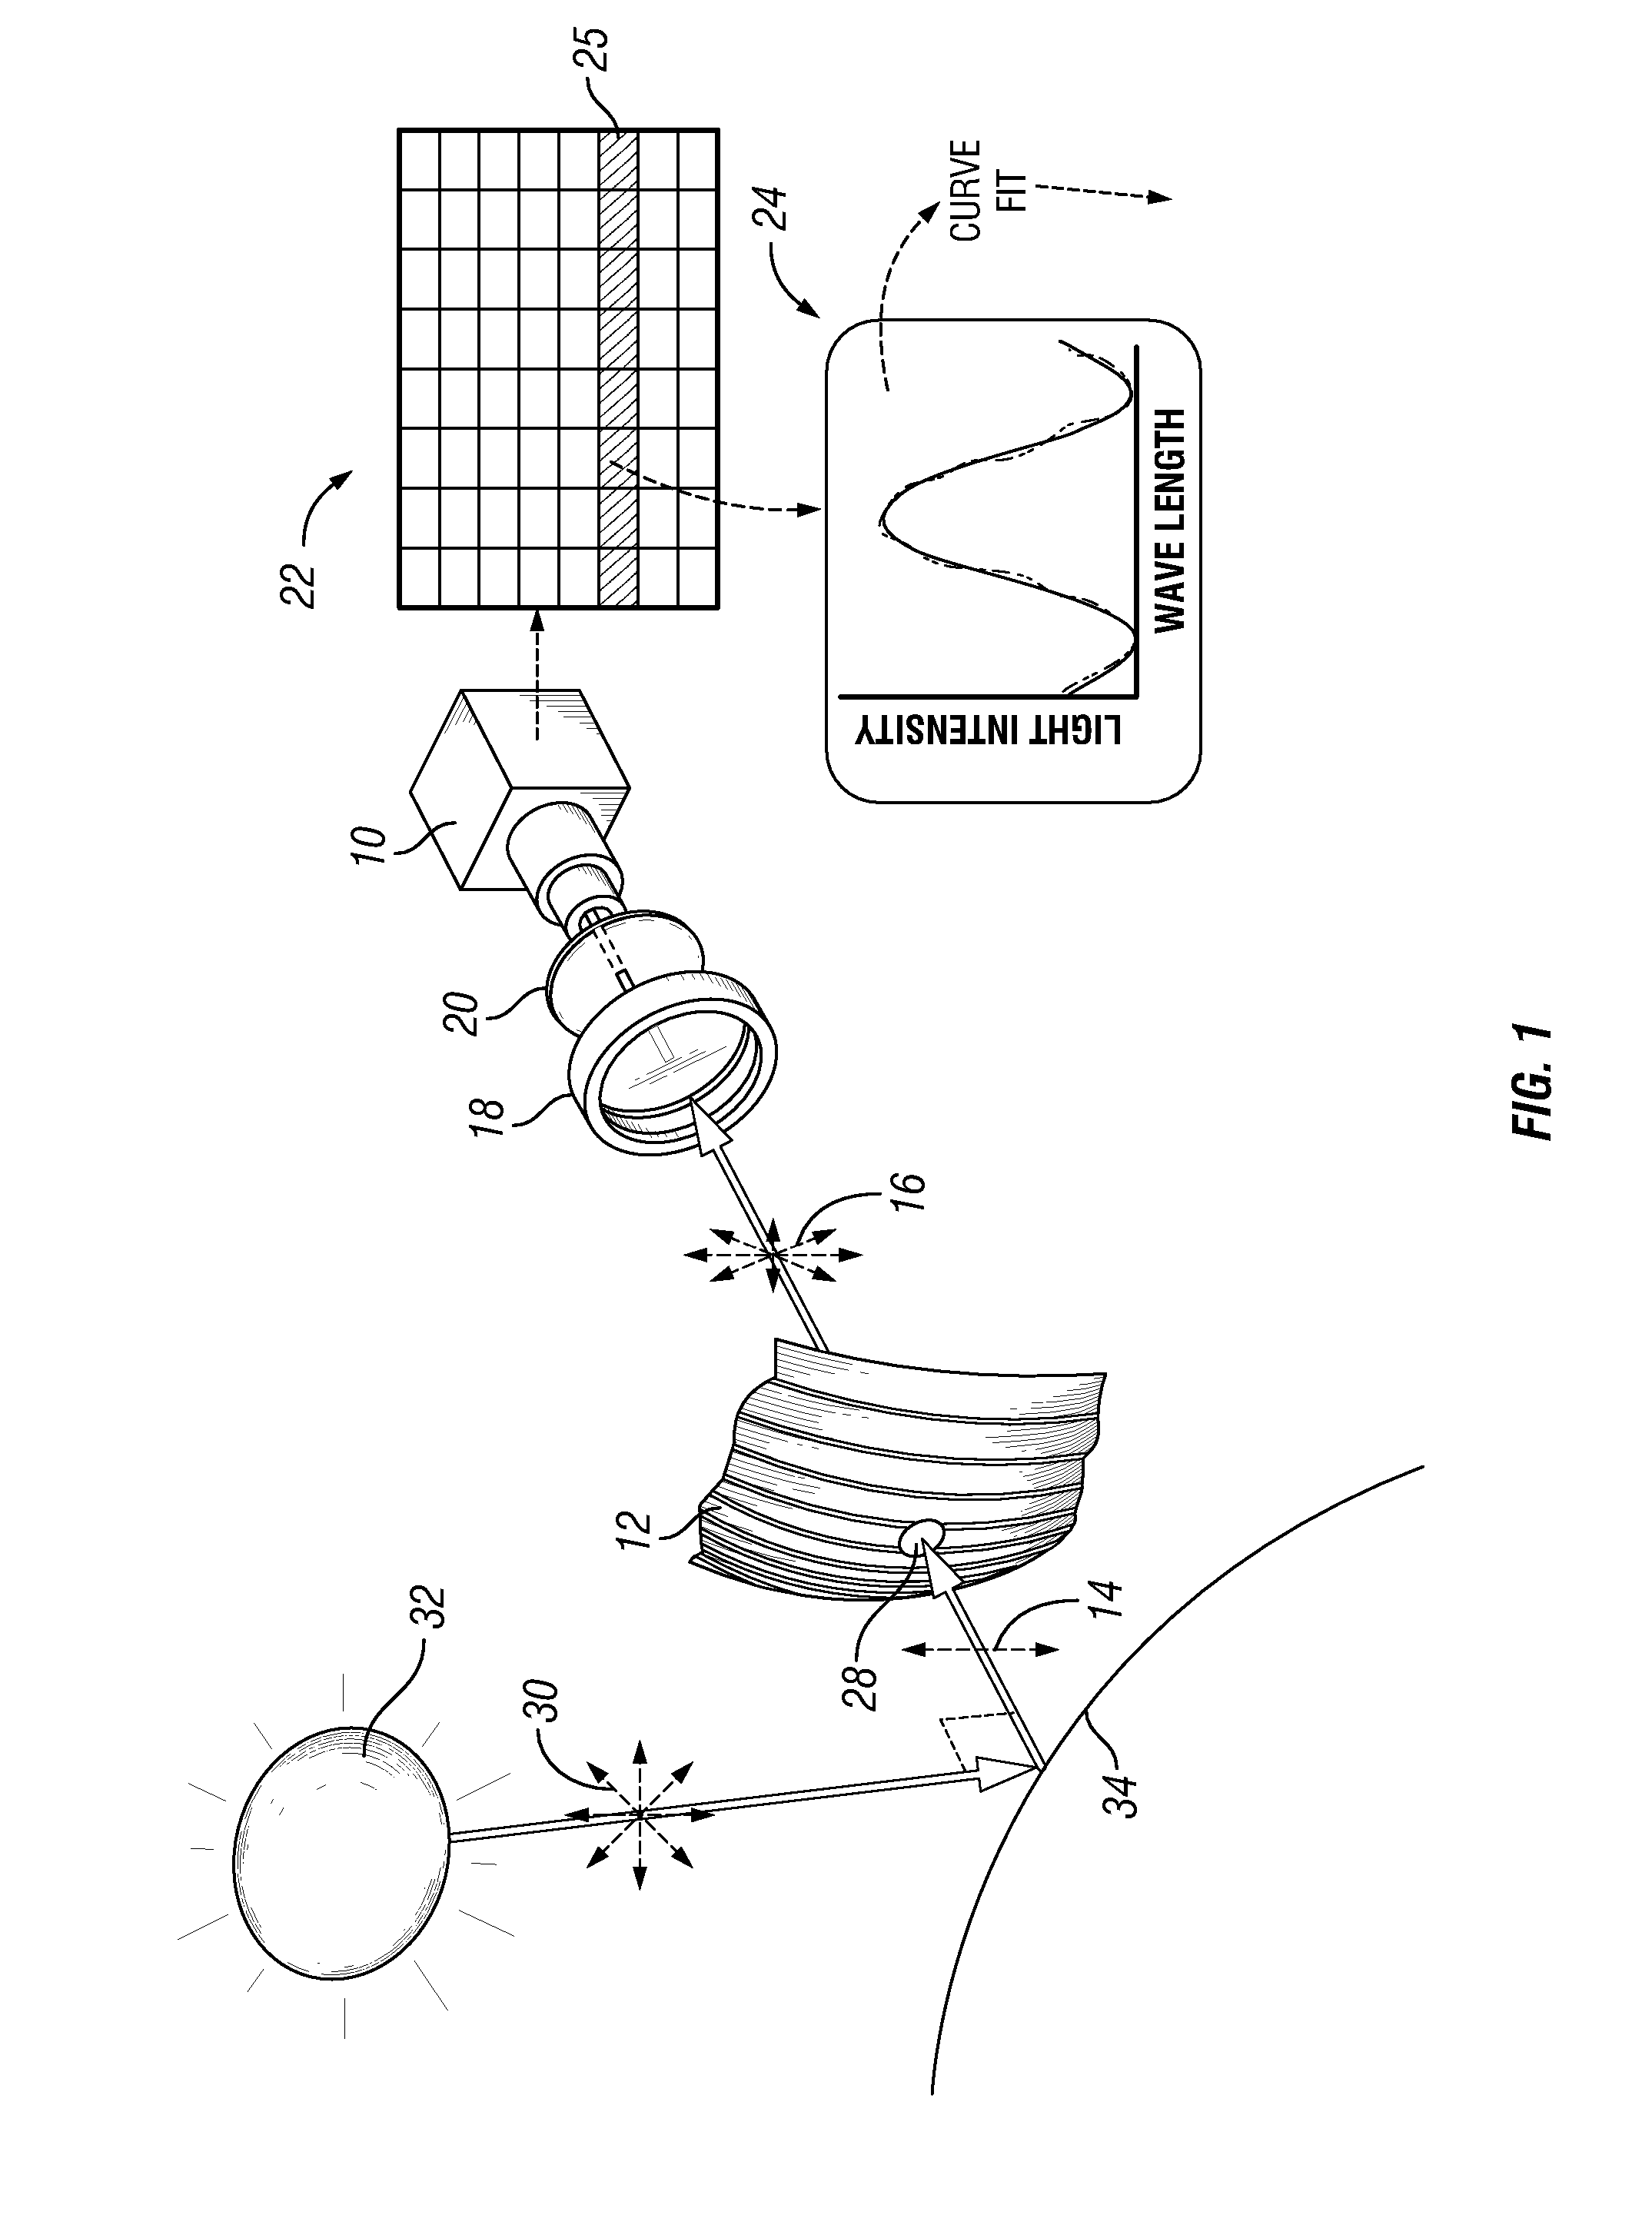
Image

Examples
example 1
Optical Retardation Maps
[0040] A series of tests were performed in which a polyethylene film sheet for a ULDB was uniaxially and incrementally strained a known and uniform amount using a film tensioning jig and the birefringence of the film was measured using the software methodology described above. The data from these tests is shown in FIGS. 3A-3P and FIGS. 4A-4P.
[0041] In the first set of plots shown in FIG. 3A, one pixel at the position of (100,100) near the center of the imaging region was arbitrarily chosen from the data cube for each strain value to indicate a representative recorded spectra and the automatic fit generated to determine optical retardation value. Most fits to the data appeared to be accurate and resulted in δ values that correlated well with expectation. Occasional fits deviated from the apparent best-fit, which added some noise to the resulting map of δ values. Often, this fitting deviation was the result of a localized intensity spike detected on the imagi...
example 2
Correlation between Optical Retardation and Strain
[0043] To determine the relation between physical strain and measured optical retardation, the average optical retardation fit value obtained over an entire map was plotted as a function of strain applied for the collection of all strain maps obtained from 0 to 15% strain, as shown in FIG. 5. Vertical error bars shown are the standard deviation in δ measured on each map and the horizontal error bars are defined by the uncertainty in relative inter-clamp distance in the film tensioner. Note that an increase of 1% strain corresponds to only a 0.005″ distance increase between the tensioner clamps. This distance was difficult to control and measure to mil accuracy using the thumb wheels on the tensioner and an external caliper.
[0044] From this plot, the strain-optic ratio determined is [retardation (nm) / % strain]=9.2±0.3. The apparent linear offset in the data was determined to be due to a measurement artifact, rather than residual str...
example 3
Film Strain Map
[0046] Calibrated strain maps, such as the one shown in FIG. 6, demonstrate the capability of the hyperspectral polarimeter to precisely measure complex film strain, as might be found in a ULDB. The film represented in this image was a narrow strip which was non-uniformly deformed in order to evaluate the HP. In the orientation displayed, one clamp was just above the top of the image. The strain was distributed in a pattern typically seen during previous calibration attempts in which edge effects would dominate the strain distribution. There was high strain near the center of the film with sharp strain spikes near the clamping surface. This explains the behavior seen earlier where apparent strain values far exceeded the average distributed strain applied to a film. This data strongly indicates that the HP is a feasible technology for the ULDB platform.
PUM
 Abstract
Description
Claims
Application Information