
Method and Apparatus for Computing User-Specified Cost Metrics in a Data Space Profiler

a data space profiler and cost metric technology, applied in computing, instruments, electric digital data processing, etc., can solve the problems of microprocessor costs, processor costs, and high cost of central processing units, and achieve the effect of reducing the overall cost of many computer systems and reducing the cost of microprocessors

Active Publication Date: 2008-05-29
ORACLE INT CORP
View PDF20 Cites 125 Cited by
  • Summary
  • Abstract
  • Description
  • Claims
  • Application Information

AI Technical Summary

Benefits of technology

[0021]In some embodiments, the computed values of the custom cost metric for each event may be returned along with a respective profiling object identifier value of the event and may be used for analysis of the performance of the software applications. Sort criteria may be applied to the results, to sort it according to a specified ascending value order, a descending value order, an aggregation formula, a number of

Problems solved by technology

This central processing unit (CPU) was very costly.
Profiling associated processor costs with processor instructions and the source representation of those instructions (e.g., functions and line numbers.)
By the mid-1990s, the acquisition costs of microprocessors comprised a small fraction of the overall cost of many computer systems.
The bulk of the system cost was the memory subsystem and the peripherals.
Typically, code instrumentation techniques impose overhead on original program code so instrumented and, unfortunately, the insertion of instructions into the instruction stream may itself alter the behavior of the program code being profiled.
However, in the majority of cases, data movement constrains achievable gain.
Traditional performance characterization focuses on the instruction pipeline and fails to address the crux of scalability, i.e., the majority of time is usually spent in data motion.
However, these tools tend to perturb the application's behavior and, more importantly, may fail to capture the dynamic nature of the program under test.
Therefore, traditional profiling tools fail to detect bottlenecks related to the memory systems of these modern systems, and do not addresses application scalability development for large-thread-count systems.
Traditional profiling tools also fail to provide a mechanism to operate on context specific data and costs, including data related to the hardware and software execution context of an application to be profiled.

Method used


Image

  • Method and Apparatus for Computing User-Specified Cost Metrics in a Data Space Profiler
  • Method and Apparatus for Computing User-Specified Cost Metrics in a Data Space Profiler
  • Method and Apparatus for Computing User-Specified Cost Metrics in a Data Space Profiler

Examples


Embodiment Construction

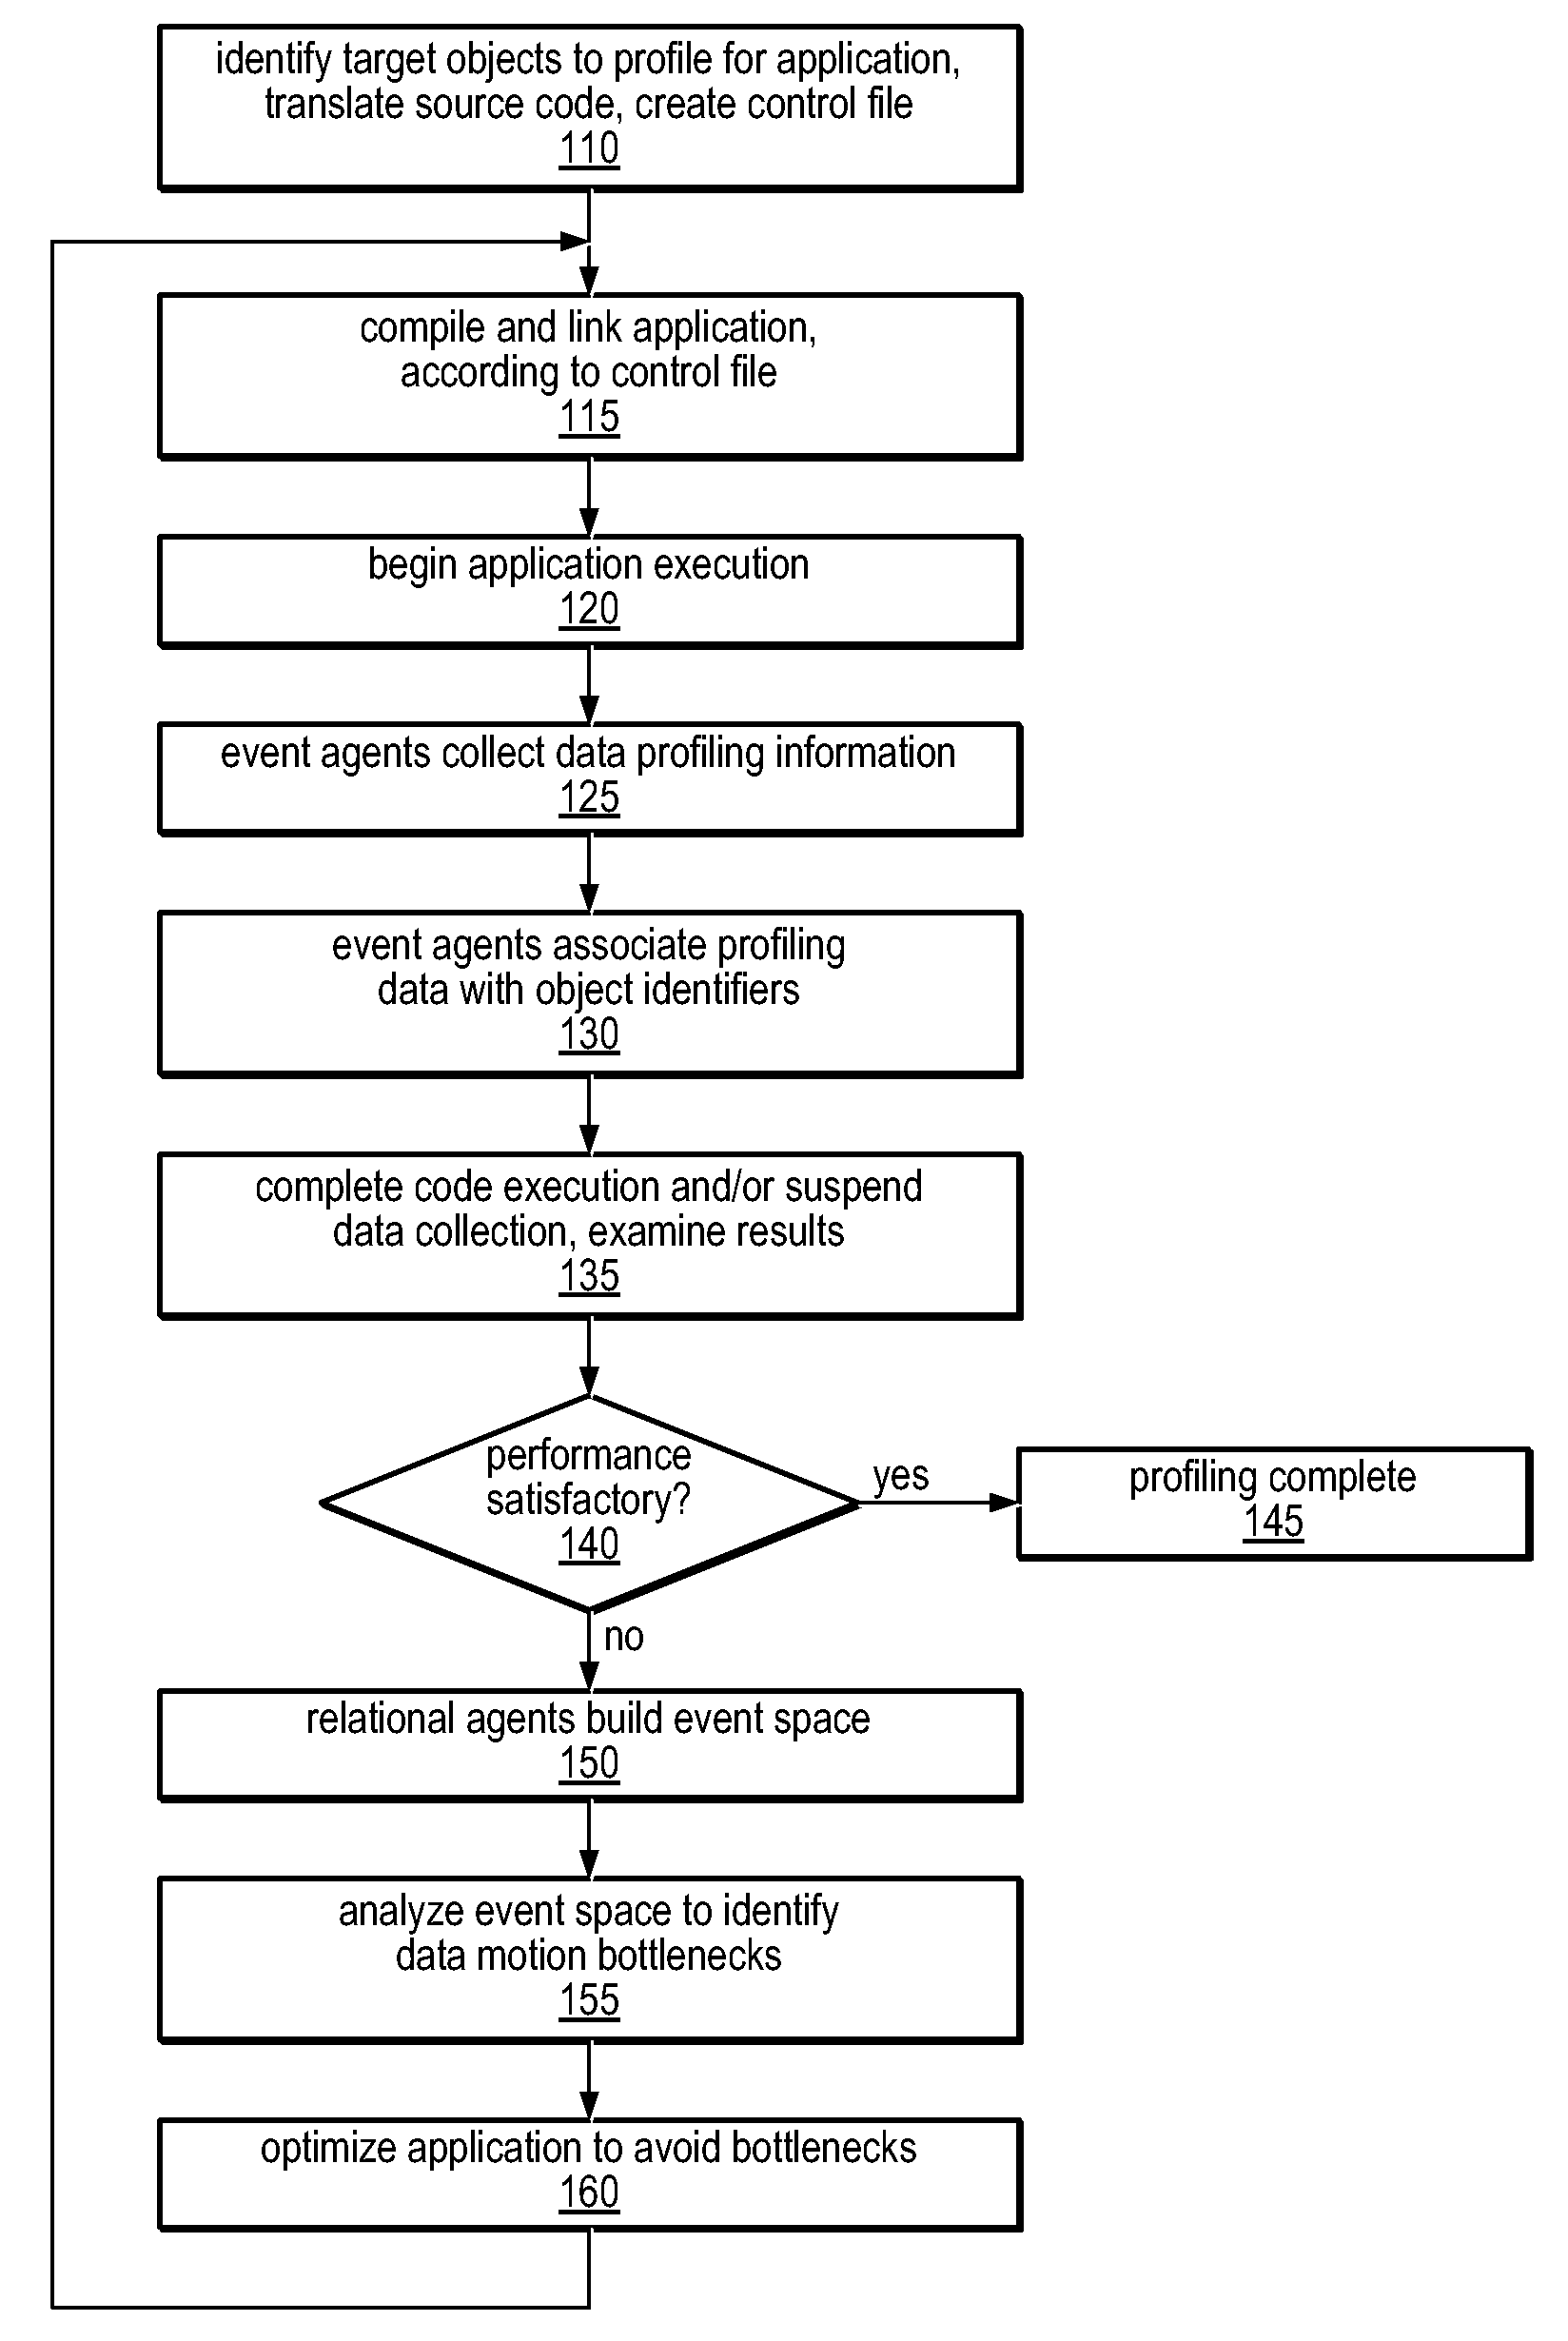
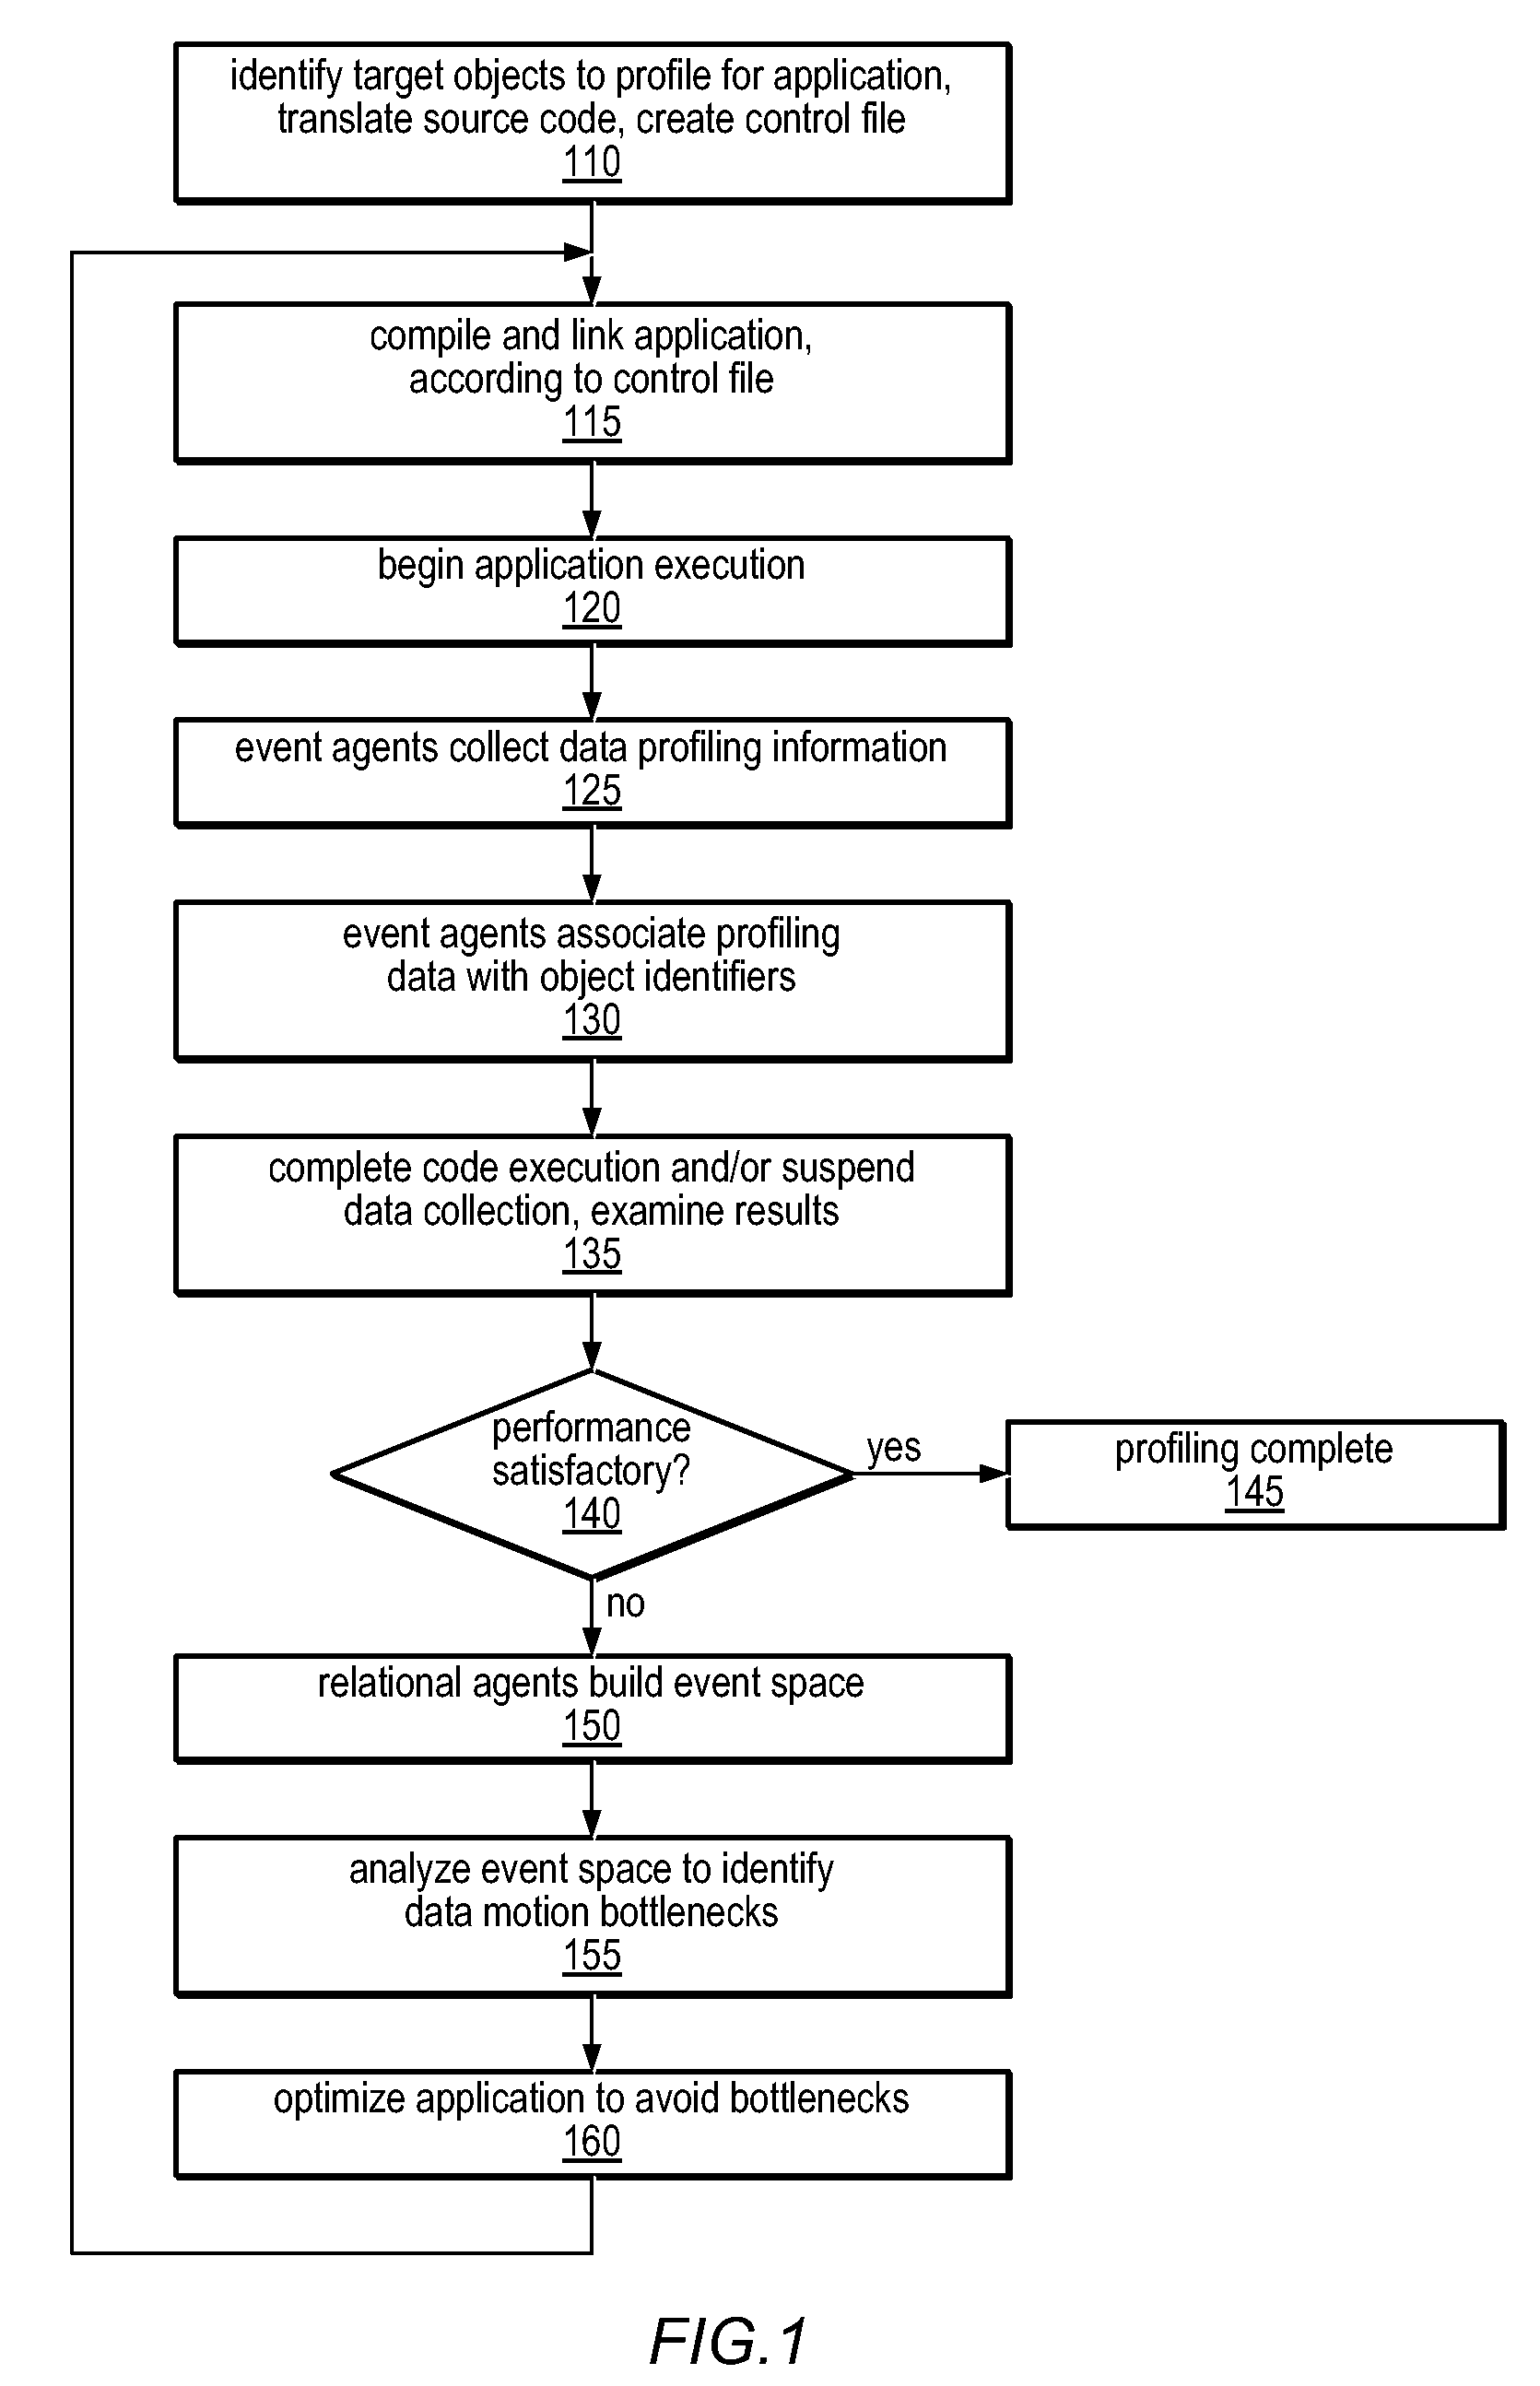
[0053]Modern computer systems are using increasing numbers of ever-faster processors to solve larger and larger problems. However, performance of those processors may be limited by the need to supply data to them at ever increasing rates. In some systems, a hierarchy of caches between the processors and main memory may be used to improve performance. In these systems, the processors may run at full speed when using data from the caches closest to the processors, but may be frequently stalled loading data from or storing data to the primary caches through secondary or tertiary caches and, ultimately, to or from main memory. Understanding how an application's data is structured in memory and how it passes from memory through the cache hierarchy may facilitate understanding and improving the performance of applications on these systems.

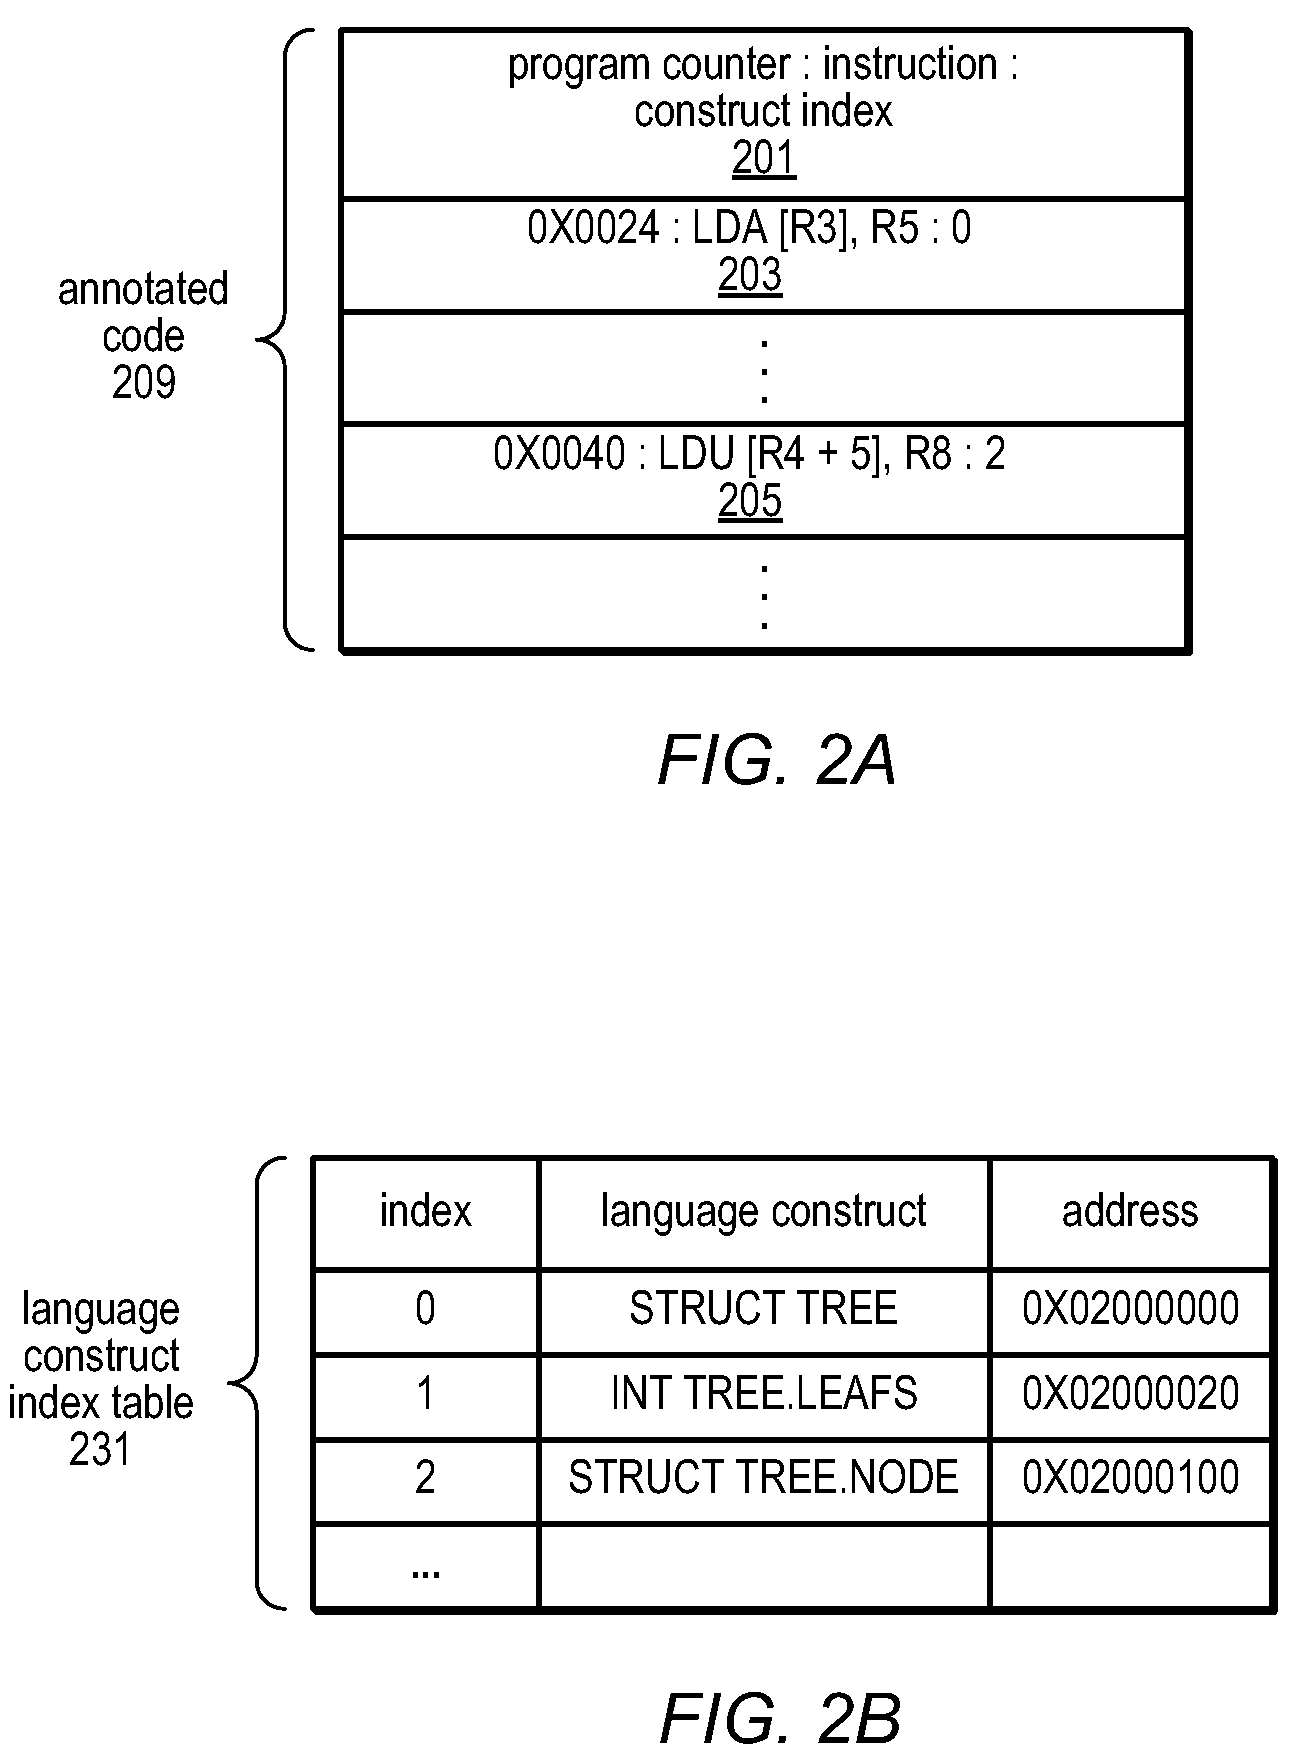
[0054]The data space profiler described herein may provide per-instruction details of memory accesses in the annotated disassembly, and may provide data...


PUM


Abstract

A system and method for profiling a software application may include means for defining a custom cost metric that includes a cost metric identifier and a cost function. The cost function may apply a mathematical formula to data extracted from an event set to calculate a respective cost metric value for each of one or more events in the event set. The data extracted from the event set may include one or more respective profiling object identifiers and one or more other respective costs associated with each of the one or more events. A cost associated with an event in the event space may be associated with a function or basic block of instructions. The cost function may include a distribution formula for attributing at least a portion of the cost associated with a function or basic block to each of the instructions comprising the function or basic block.

Description

BACKGROUND OF THE INVENTION[0001]1. Field of the Invention[0002]This invention relates to computing systems and more specifically to observing and optimizing costs of various system events through data space profiling.[0003]2. Description of the Relevant Art[0004]Computer systems originally contained a central processing unit encompassing many boards (and sometimes cabinets), and random access memory that responded in the same cycle time as the central processing unit. This central processing unit (CPU) was very costly. Initially, bulbs attached to wires within the CPU aided programmers in the identification of program behavior. These were among the earliest system profiling tools.[0005]Computer languages, such as FORTRAN and COBOL, improved programmer productivity. Profiling libraries were developed to break down the costs associated with the most precious resource on the system, i.e., CPU cycles. Profiling associated processor costs with processor instructions and the source repre...

Claims


Application Information

Patent Timeline
IPC IPC(8): G06F9/45
CPCG06F8/443
Inventor KOSCHE, NICOLAITRACTON, KENNETH
Owner ORACLE INT CORP
Learn More