Gene expression profiling based identification of genomic signature of high-risk multiple myeloma and uses thereof

a multiple myeloma and gene expression technology, applied in the field of cancer research, can solve the problems of inability to identify lesions that promote aggressive clinical course, inability to detect lesions, etc., and achieve the effect of high degree of correlation

Inactive Publication Date: 2008-08-07
THE BOARD OF TRUSTEES OF THE UNIV OF ARKANSAS
View PDF10 Cites 11 Cited by
  • Summary
  • Abstract
  • Description
  • Claims
  • Application Information

AI Technical Summary

Benefits of technology

[0016]FIGS. 4A-4B show that 70-Gene risk score at diagnosis and relapse predicts post-relapse survival. FIG. 4A shows 70-gene risk score in paired diagnostic (blue) and relapse (red) samples of 51 cases from the training cohort. The gene expression risk score is indicated to the left. Sample pairs are order from left to right based on lowest baseline score. FIGS. 4B shows Kaplan-Meier plots of post-relapse survival of the three groups defined by low-risk both at diagnosis and relapse (Low-Low), low-risk at diagnosis and high-risk at relapse (Low-High) and high risk at both time points (High-High).
[0017]FIGS. 5A-5B show event-free and overall survival in risk groups defined by the 17-gene model in the test set. The 181 newly diagnosed MM cases were predicted into high-risk (16.6%) and low-risk (83.4%) groups. Kaplan-Meier estimates of survival in low-risk and high-risk myeloma showed 2-year actuarial probabilities of event-free survival (FIG. 5A) of 88% for the high risk (red) versus 50% for low risk (blue) (P<0.0001) and overall survival (FIG. 5B) of 91% for the high-risk (red) versus 54% for the low-risk (blue) (P<0.0001).
[0018]FIG. 6 shows relationship between high- and low-risk defined by the 70-gene supervised model and the 7-subgroup unsupervised classifier (9). Data are presented as a stacked bar-view of the number of high-risk (red) and low-risk cases (blue) in each of the 7 subtypes, including the group of cases with the so-called myeloid signature (MY) (far left).
[0019]FIGS. 7A-7C related the 70 gene model-defined high-risk with molecular features. FIG. 7A shows a scatter plot of gene expression-based proliferation index (x-axis) by 70-gene risk score in 351 cases of the training cohort. Low-risk cases (blue) and high-risk cases (red) defined by the 70-gene model (see text) are indicated. The two variables show a substantial degree of correlation (r=0.73; P<0.001). To evaluate the influence of the two variables on outcome, the population was divided into 4 subgroups using a PI of cut point of 5 and a high-risk cut-point of 0.66. The groups are defined by the intersection of the two green lines. The upper left quadrant contains cases with high PI/low-risk, the upper right quadrant cases with high PI/high-risk, the lower left quadrant contains cases with low PI/low-risk and the lower right quadrant contains cases with low PI/high-risk. The line represents the linear trend in the data. FIG. 7B shows Kaplan-Meier plots of overall surviva

Problems solved by technology

Although, many of the genetic and molecular lesions associated with disease initiation are known, the lesions that promote an aggressive clinical course have remained elusive.
Additionally, it was demonstrated that gains of 1q21 acquired in symptomatic myel

Method used


Image

  • Gene expression profiling based identification of genomic signature of high-risk multiple myeloma and uses thereof
  • Gene expression profiling based identification of genomic signature of high-risk multiple myeloma and uses thereof
  • Gene expression profiling based identification of genomic signature of high-risk multiple myeloma and uses thereof

Examples


example 1

Patients

[0041]Purified plasma cells were obtained from normal healthy subjects and from patients with monoclonal gammopathy of undetermined significance (MGUS) and with overt myeloma requiring therapy. Patient characteristics of training (n=351) and validation groups (n=181) have been previously described.9 Of 351 cases in the training group, 51 also had samples taken at relapse. Both protocols utilized induction regimens, followed by melphalan-based tandem autotransplants, consolidation chemotherapy and maintenance treatment.

example 2

Gene Expression Profiling

[0042]Plasma cell purifications and GEP, using the Affymetrix U133Plus2.0 microarray, were performed as previously described [9,16]. Microarray data and outcome data on the 532 patients used in this study have been deposited in the NIH Gene Expression Omnibus under accession number GSE2658.

example 3

Statistical and Microarray Analyses

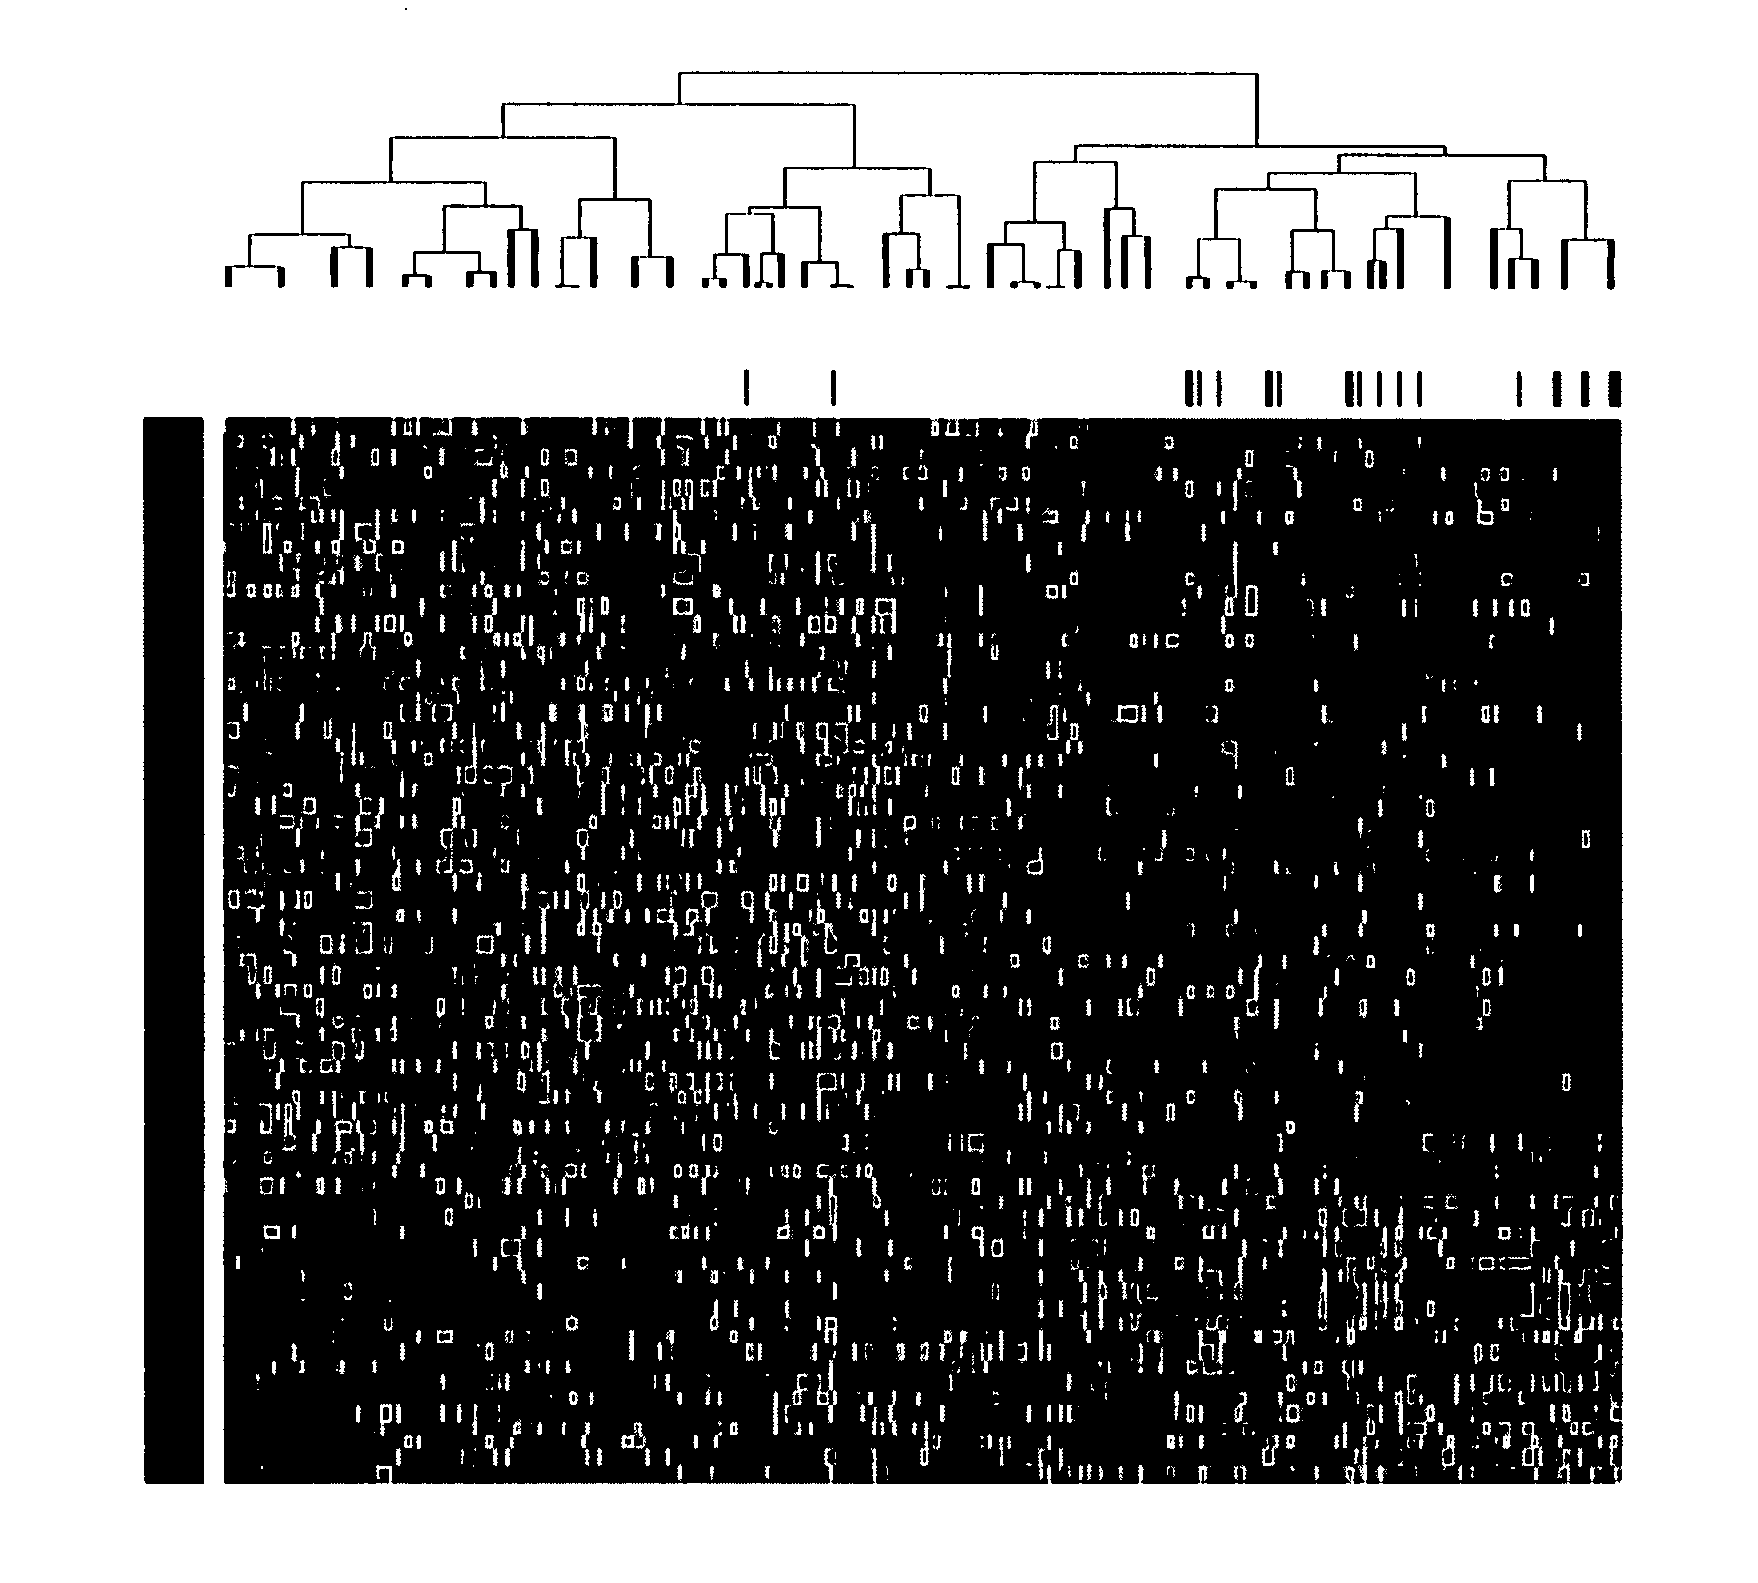
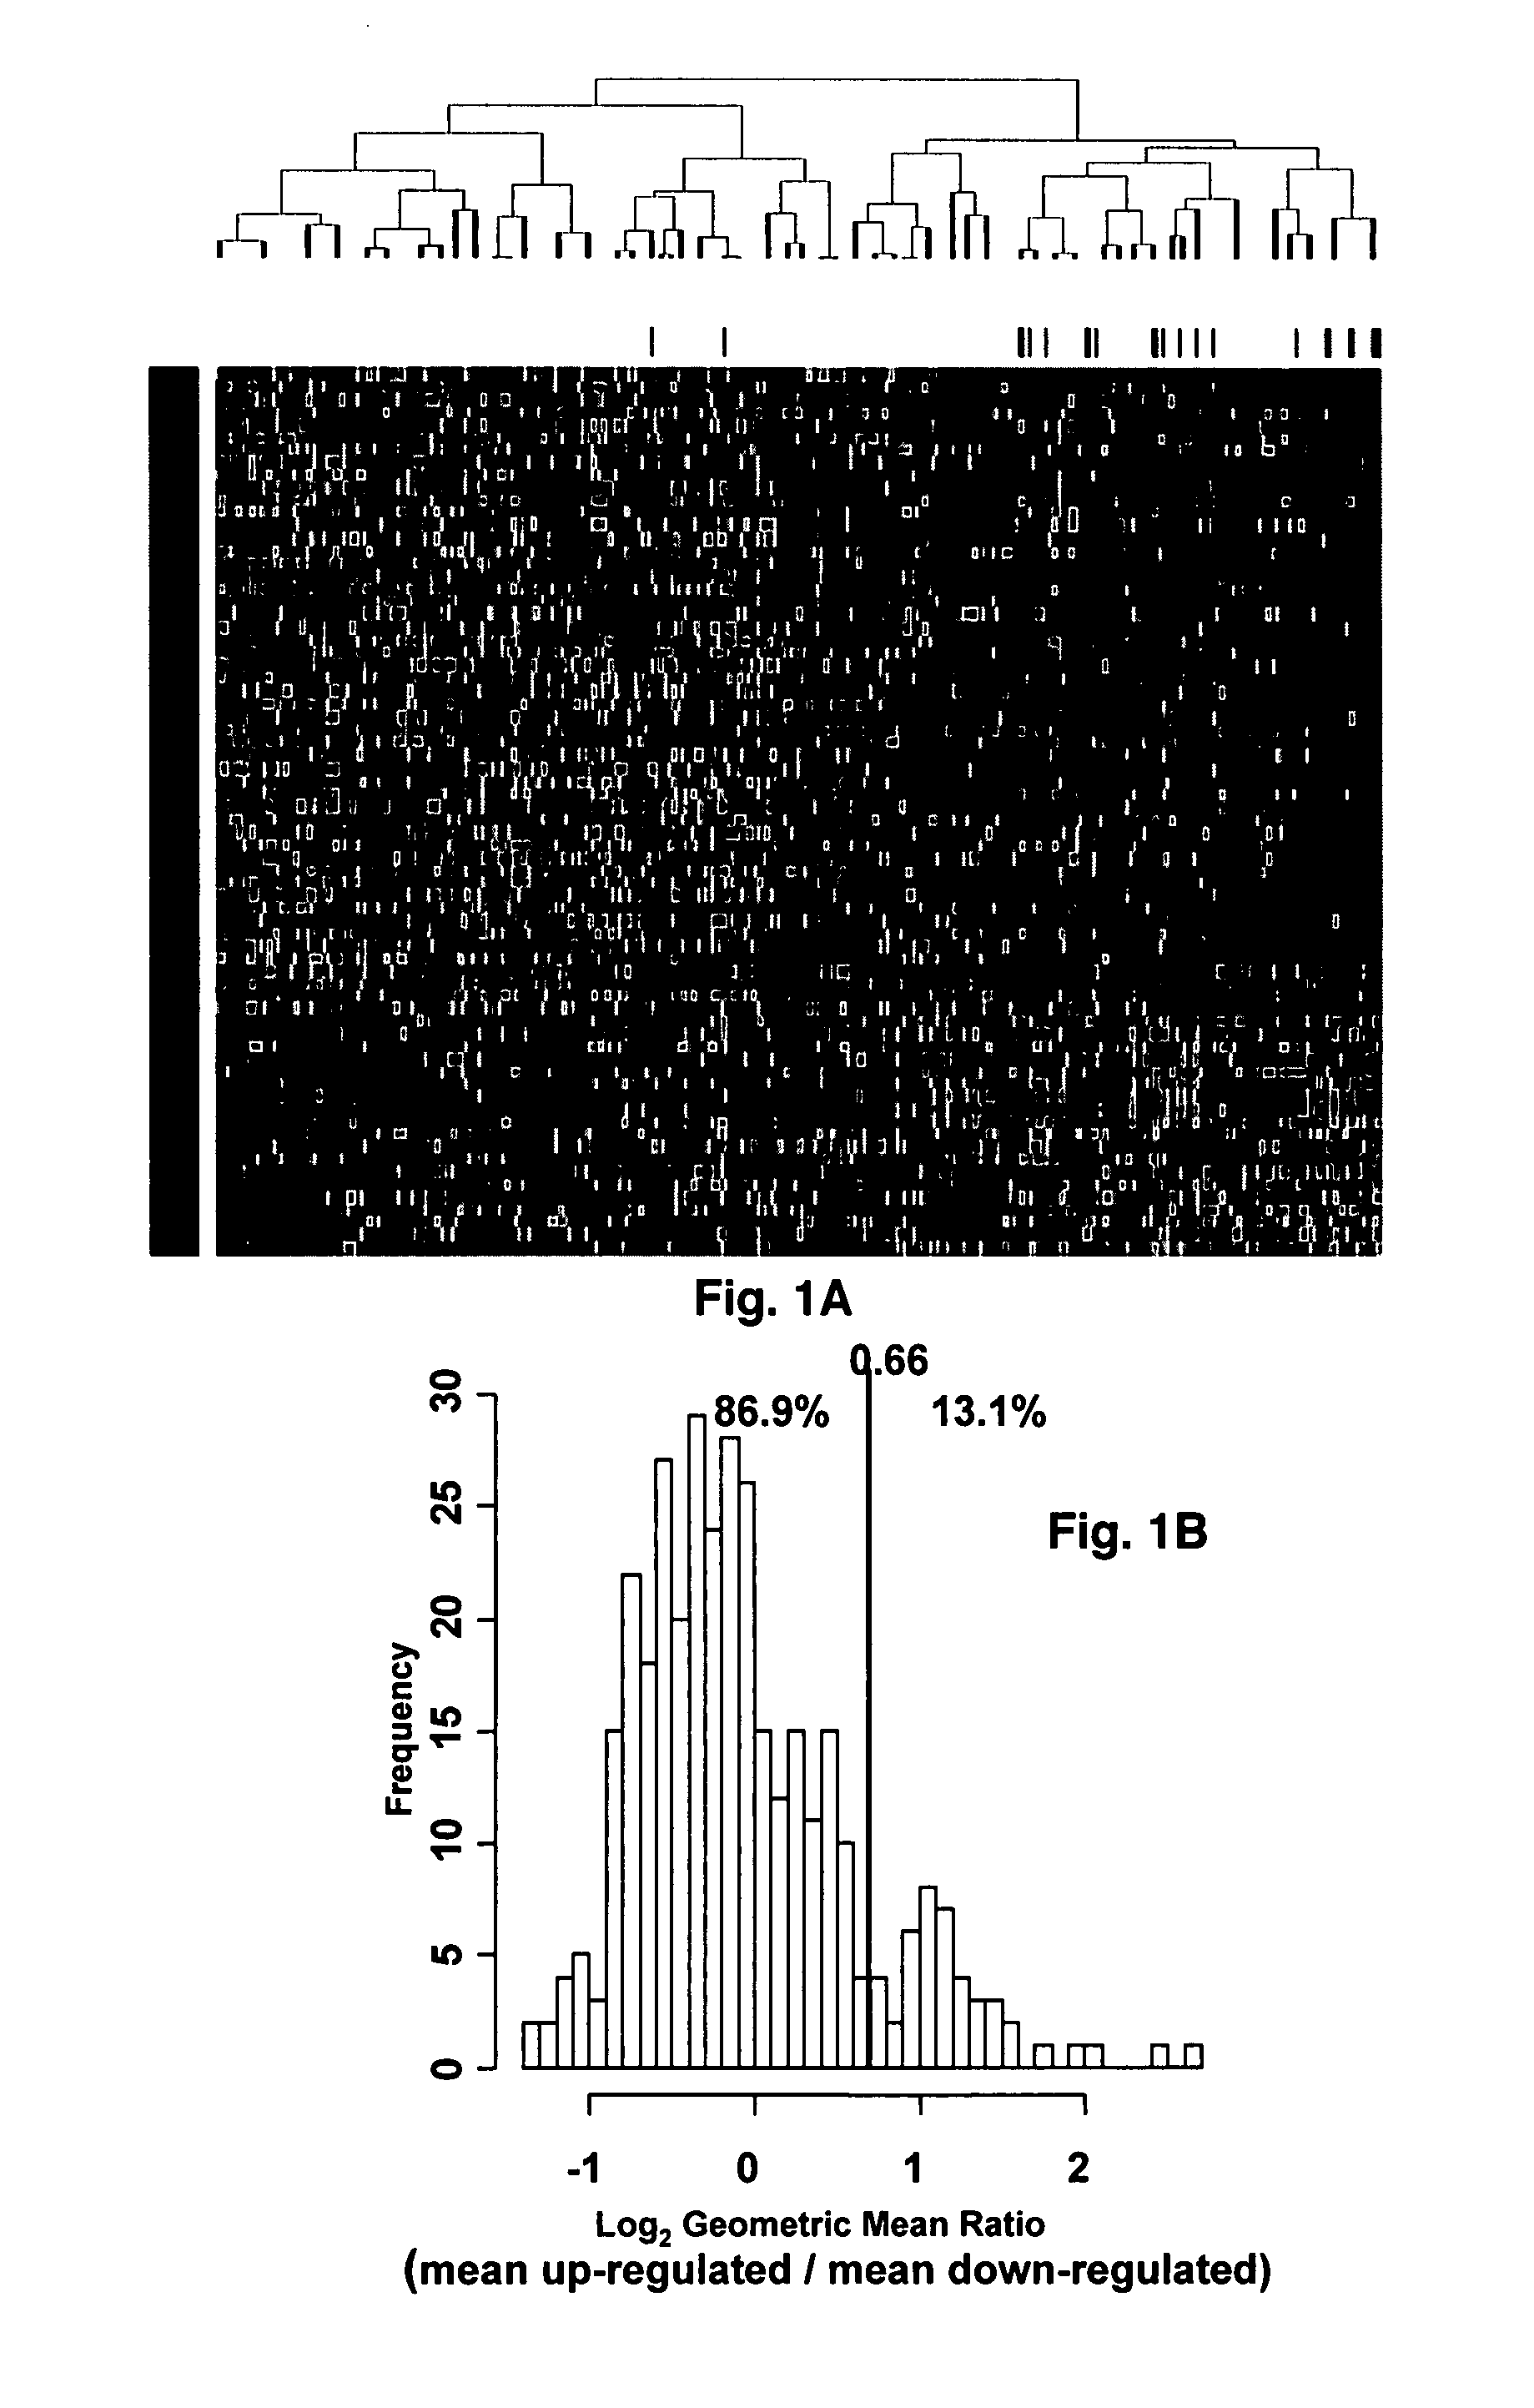
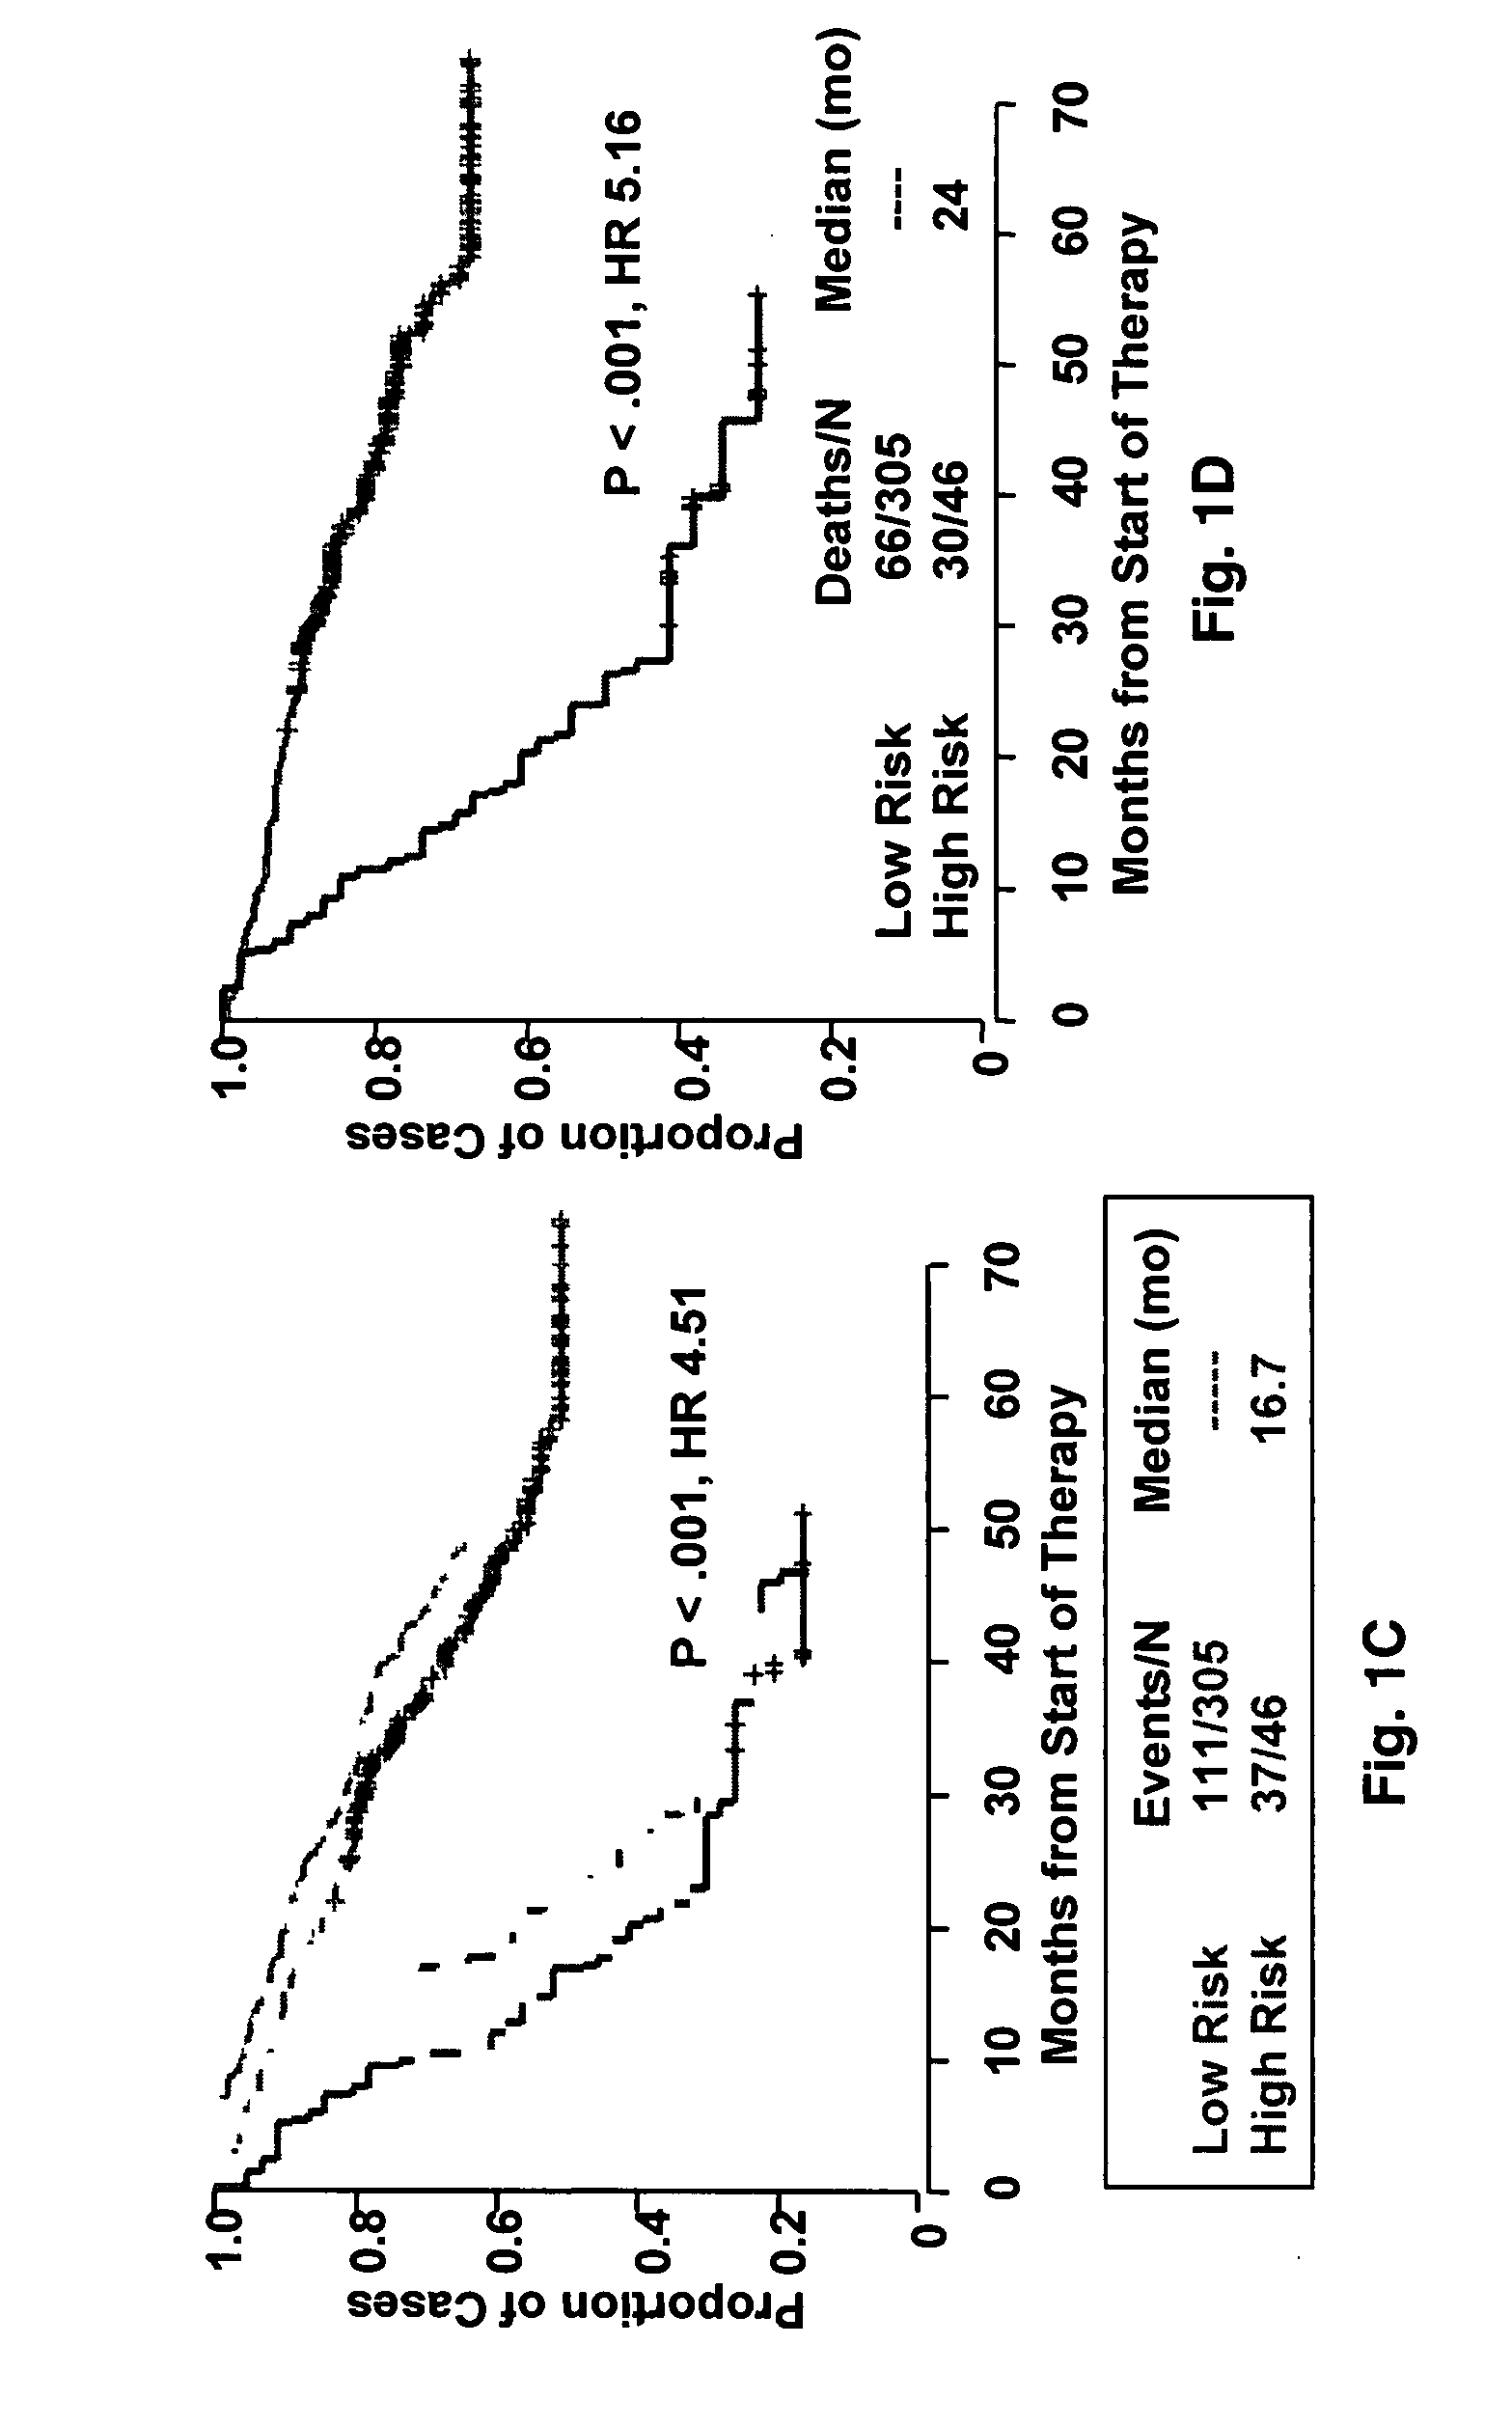
[0043]Affymetrix U133Plus2.0 micro-arrays were preprocessed using GCOS1.1 software and normalized using conventional GCOS1.1 scaling. Log rank tests for univariate association with disease-related survival were performed for each of the 54,675‘Signal’ summaries. Specifically, log rank tests were performed for quartile 1 (Q1) vs. quartiles 2-4 (Q2-Q4) and quartile 4 (Q4) vs. quartiles 1-3 (Q1-Q3) in order to identify under- and over expressed prognostic genes, respectively. A false discovery rate cut-off of 2.5% was applied to each list of log-rank P-values [17] yielding 19 under- and 51 over expressed probe sets. Heat-map-column dendrograms were computed with hierarchical clustering using Pearson's correlation distances between patient pairs' log2-scale expression. Column-dendrogram branches were sorted left-to-right based upon each patient's difference between average log2-scale expression of the 51 up-regulated and the 19 down-regulated genes: th...


PUM

PropertyMeasurementUnit
Massaaaaaaaaaa
Volumeaaaaaaaaaa
Volumeaaaaaaaaaa

Abstract

The present invention discloses a method of gene expression profiling to identify genomic signatures linked to survival specific for a disease and a kit that can be used for performing such a method. Also disclosed herein is the use of such a method in classifying the disease into subsets, predicting clinical outcome and survival of an individual, selecting treatment for an individual suffering from a disease, predicting post-relapse risk and survival of an individual, correlating molecular classification of a disease with genomic signature defining the risk group or a combination thereof.

Description

CROSS REFERENCE TO RELATED APPLICATION[0001]This non-provisional application claims benefit of provisional application U.S. Ser. No. 60 / 857,456 filed on Nov. 7, 2006, now abandoned.FEDERAL FUNDING LEGEND[0002]This invention was created, in part, using funds from the federal government under National Cancer Institute grant CA55819 and CA97513. Consequently, the U.S. government has certain rights in this invention.BACKGROUND OF THE INVENTION[0003]1. Field of the Invention[0004]The present invention generally relates to the field of cancer research. More specifically, the present invention relates to the use of gene expression profiling to identify genomic signatures specific for high-risk multiple myeloma useful for predicting clinical outcome and survival.[0005]2. Description of the Related Art[0006]Multiple myeloma (MM), a malignancy of terminally differentiated plasma cells homing to and expanding in the bone marrow, is characterized by a tremendous heterogeneity in outcome followi...

Claims


Application Information

Patent Timeline
IPC IPC(8): C12Q1/68
CPCC12Q1/6886C12Q2600/158C12Q2600/118
Inventor SHAUGHNESSY, JOHN D.ZHAN, FENGHUANGBARLOGIE, BARTBURINGTON, BART E.
Owner THE BOARD OF TRUSTEES OF THE UNIV OF ARKANSAS
Why Eureka
Try Eureka