System and Method for Rating the Nutritional Quality of Food Items
a nutritional quality and system technology, applied in the field of nutritional quality ratings, can solve the problems of inability to accurately evaluate and rate inability to accurately identify the nutritional quality of food items, and inability to meet the nutritional quality requirements of consumers, etc., to achieve the effect of evaluating and grading the nutritional quality of individual food items with thoroughness and accuracy
- Summary
- Abstract
- Description
- Claims
- Application Information
AI Technical Summary
Benefits of technology
Problems solved by technology
Method used
Image
Examples
example 1
Rating the Nutritional Quality of a Walnut
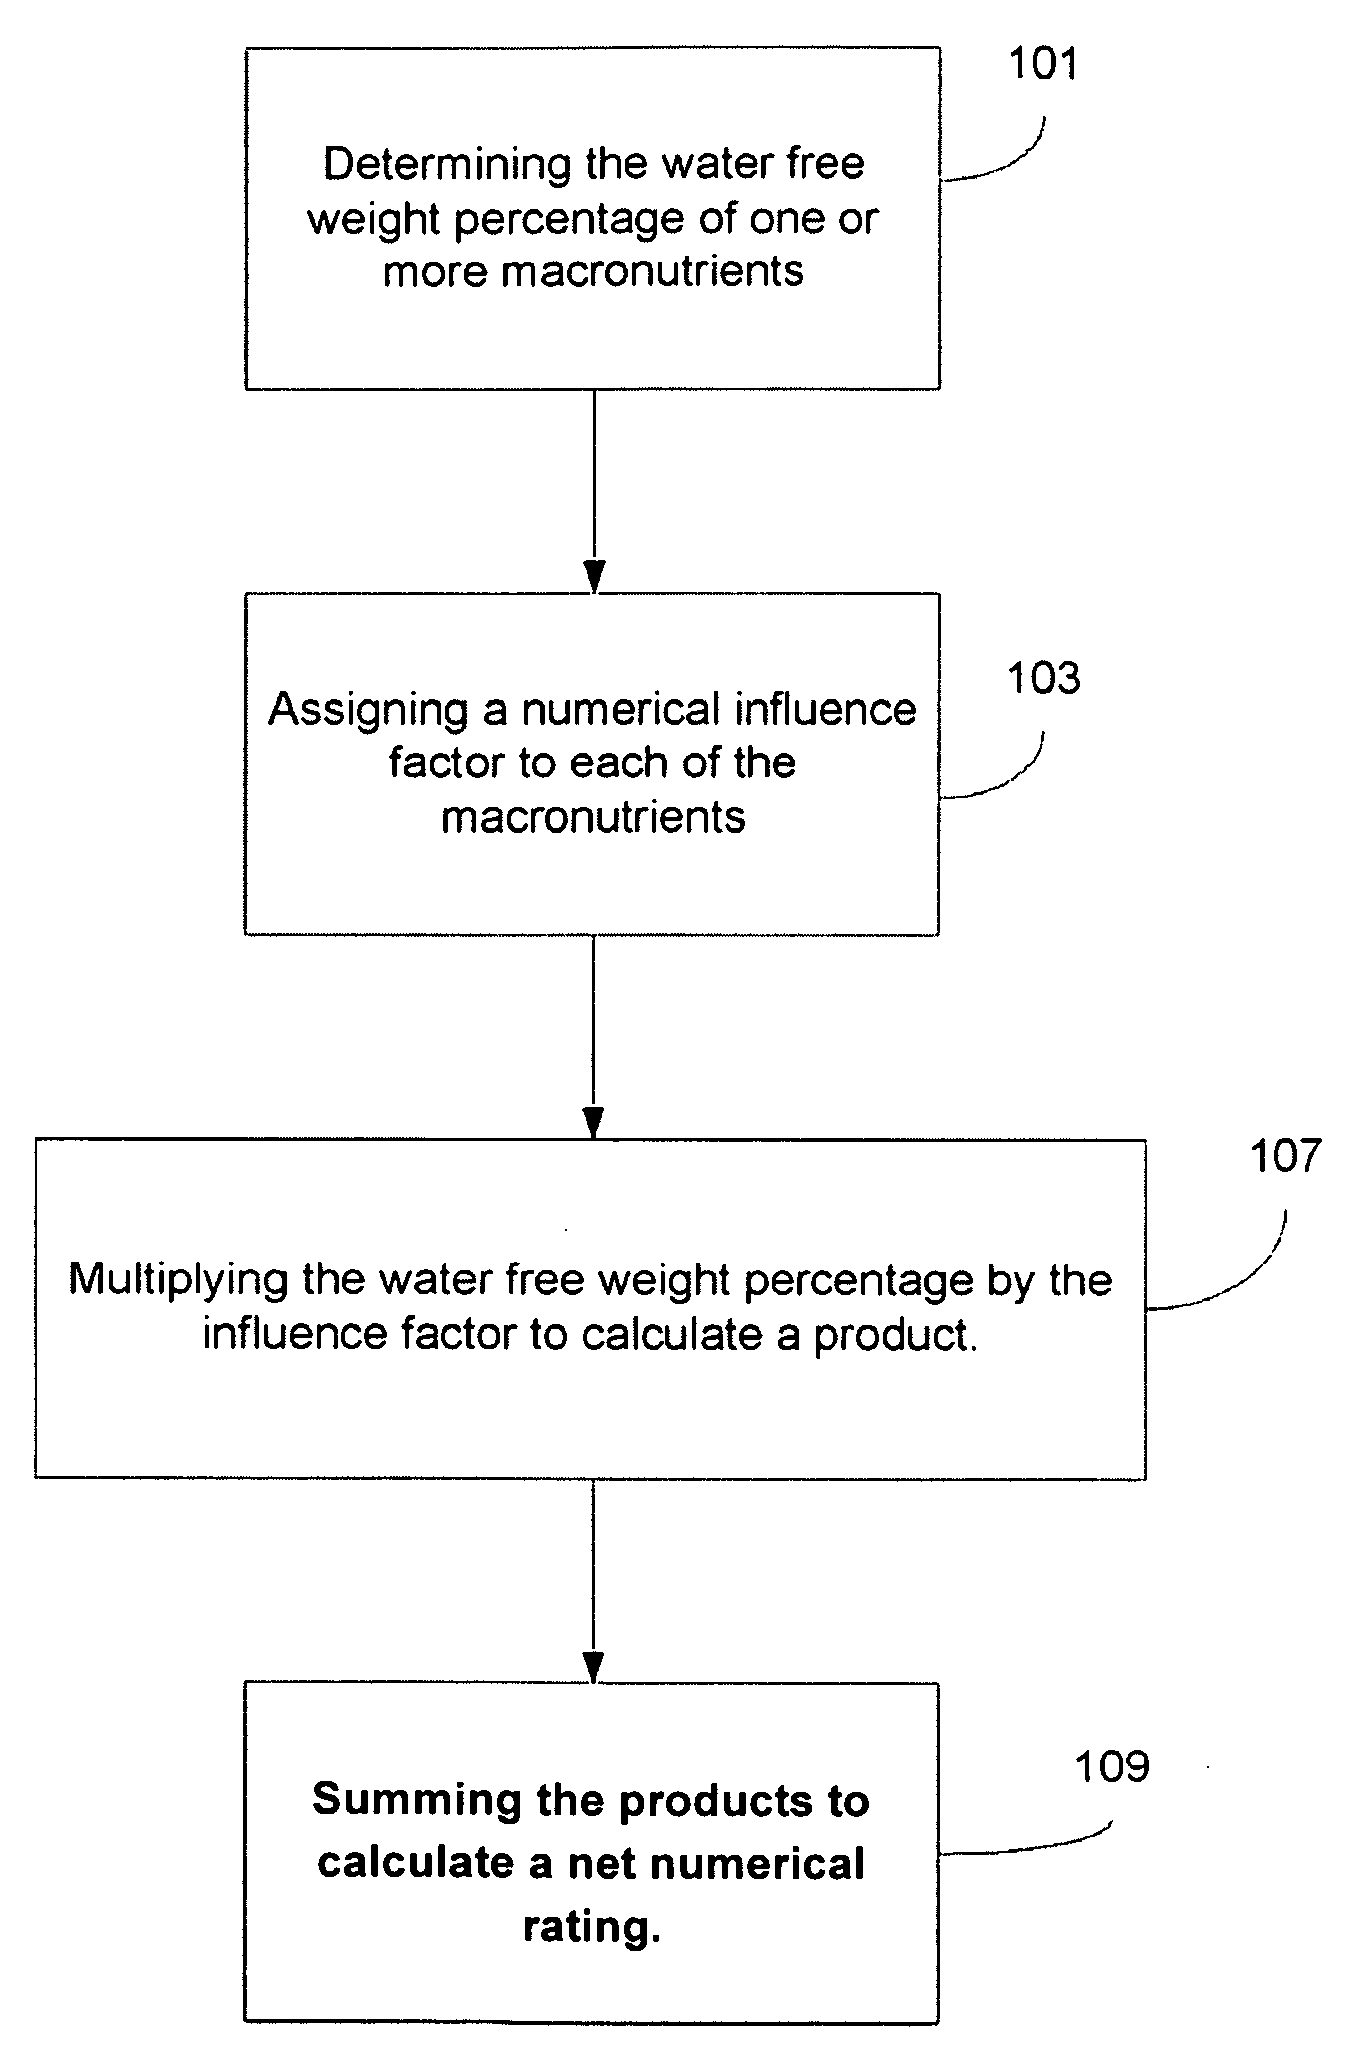
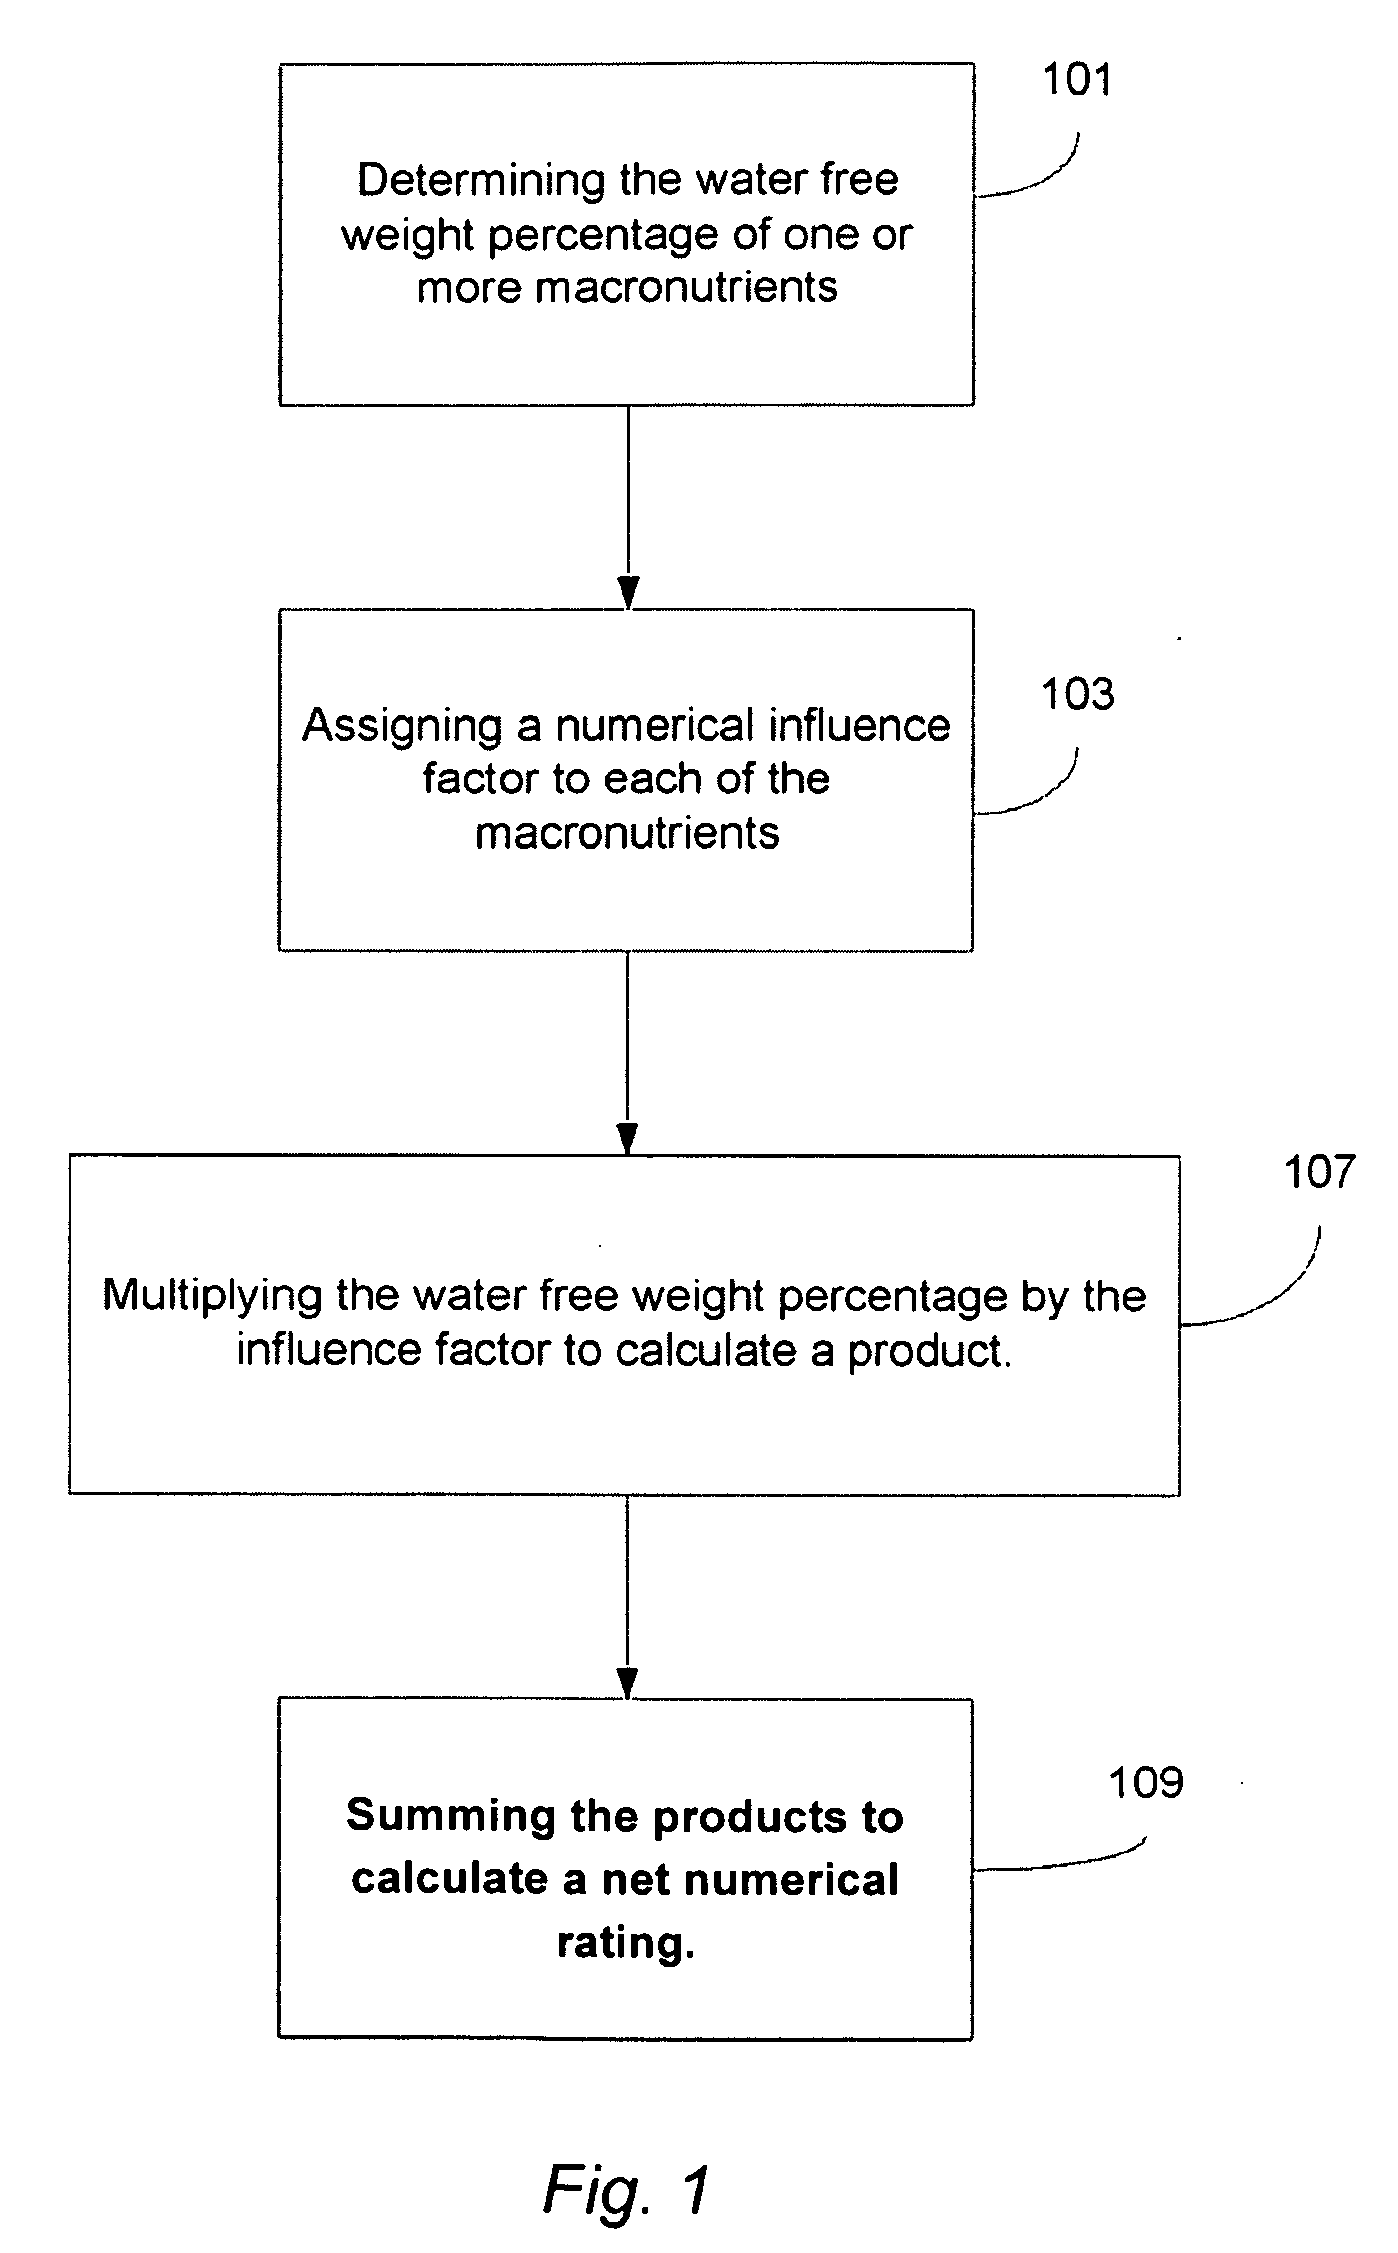
[0054]The nutritional quality of a walnut was determined using the macronutrient content of 100 grams of walnuts. The macronutrient content was determined to be as follows:
[0055]Total weight=100 grams
[0056]Water weight=6.0 grams
[0057]Saturated fats (SFA)=6.4 grams
[0058]Monounsaturated fat (MUFA)=9.4 grams
[0059]Linoleic acid (LA)=39.9 grams
[0060]Alpha Linoleic acid (ALA)=9.5 grams
[0061]Fiber=6.7 grains
[0062]Non-fiber carbohydrates (NFC)=7.0 grams
[0063]Protein=15.1 grams
[0064]The water free weight percentage of the macronutrients was determined by subtracting the weight of the water from the total weight as follows:
100 g−6 g=94 g of water-free weight
[0065]Next, the respective weight of each macronutrient is divided by the water free weight (94 grams) to determine the percentage of water free weight due to each macronutrient:
NutrientSFAMUFALAALAFiberNFCProteinWeight %6.8%10.0%42.4%10.1%7.1%7.4%16.1%
[0066]Next, the numerical influence factors we...
example 2
Rating the Nutritional Quality of Yellowfin Tuna
[0069]The nutritional quality of yellowfin tuna was determined using the macronutrient content of 100 grams of tuna. The macronutrient content, influence factor, and nutrient and influence factor products were determined to be as follows:
Nutrient andPercentageInfluenceWeightwater-freeInfluenceFactorNutrient(grams)weightfactorProductSFA.2350.95%−.24−.23MUFA.1540.62+.12+.07LA.0080.03−.18−.01ArA.0280.11−4.0−.44ALA.0120.05+.80+.04EPA.0370.15+3.0+.45DHA.1810.73+3.0+2.19Cholesterol.0450.18−.50−.09NFC00−.070Fiber00+.400Protein23.495.51+.07+6.69Calcium.016.06+.50+.04Magnesium.050.20+.50+.10Sodium.037.15−.50−.08Potassium.4441.80+.25+.45Total24.65+9.15 (Score)
[0070]Next, the numerical rating was adjusted based on the level of mercury in the tune. The average ppm of mercury in tuna of 0.34 was multiplied by the numerical influence factor of −15 and the total was subtracted from the rating:
(0.34 ppm×−15)+9.15=−5.1+9.15=4.05 rating.
[0071]Next, the ...
PUM
| Property | Measurement | Unit |
|---|---|---|
| size | aaaaa | aaaaa |
| weight | aaaaa | aaaaa |
| caloric density | aaaaa | aaaaa |
Abstract
Description
Claims
Application Information
 - R&D
- Intellectual Property
- Life Sciences
- Materials
- Tech Scout
- Unparalleled Data Quality
- Higher Quality Content
- 60% Fewer Hallucinations
Browse by: Latest US Patents, China's latest patents, Technical Efficacy Thesaurus, Application Domain, Technology Topic, Popular Technical Reports.
© 2025 PatSnap. All rights reserved.Legal|Privacy policy|Modern Slavery Act Transparency Statement|Sitemap|About US| Contact US: help@patsnap.com


