Quantitative test to detect disease progression markers of epithelial ovarian cancer patients
a technology of epithelial ovarian cancer and quantitative test, which is applied in the direction of microbiological testing/measurement, biochemistry apparatus and processes, etc., can solve the problem of no reliable clinical factors that can properly stratify patients, and achieve the effect of avoiding technical bias
- Summary
- Abstract
- Description
- Claims
- Application Information
AI Technical Summary
Benefits of technology
Problems solved by technology
Method used
Image
Examples
example 1
Materials and Methods
[0109]Patients and tissue specimens. Serous tumor samples from 177 chemotherapy naïve patients were collected and banked in liquid nitrogen following appropriate consent from patients undergoing surgery within the Division of Gynaecologic Oncology at the Centre hospitalier de l'Université de Montreal (CHUM) from 1995 to 2004. An independent pathologist scored tumor grade and a gynecologist oncologist scored tumor stage and residual disease according to criteria from the International Federation of Gynecology and Obstetrics (FIGO). Clinical data on survival and progression-free interval were defined according to Response Evaluation Criteria in Solid Tumors Criteria (RECIST) 5) criteria. Good quality RNA samples from the bank, as monitored by 2100 Bioanalyzer™ (Agilent Technologies, Mississauga, ON, Canada) were used for this analysis. Subject survival was calculated from the time of diagnosis until the first progression. For the microarray study, RNA was purified...
example 2
Identification of Candidate Genes Related to Disease Progression
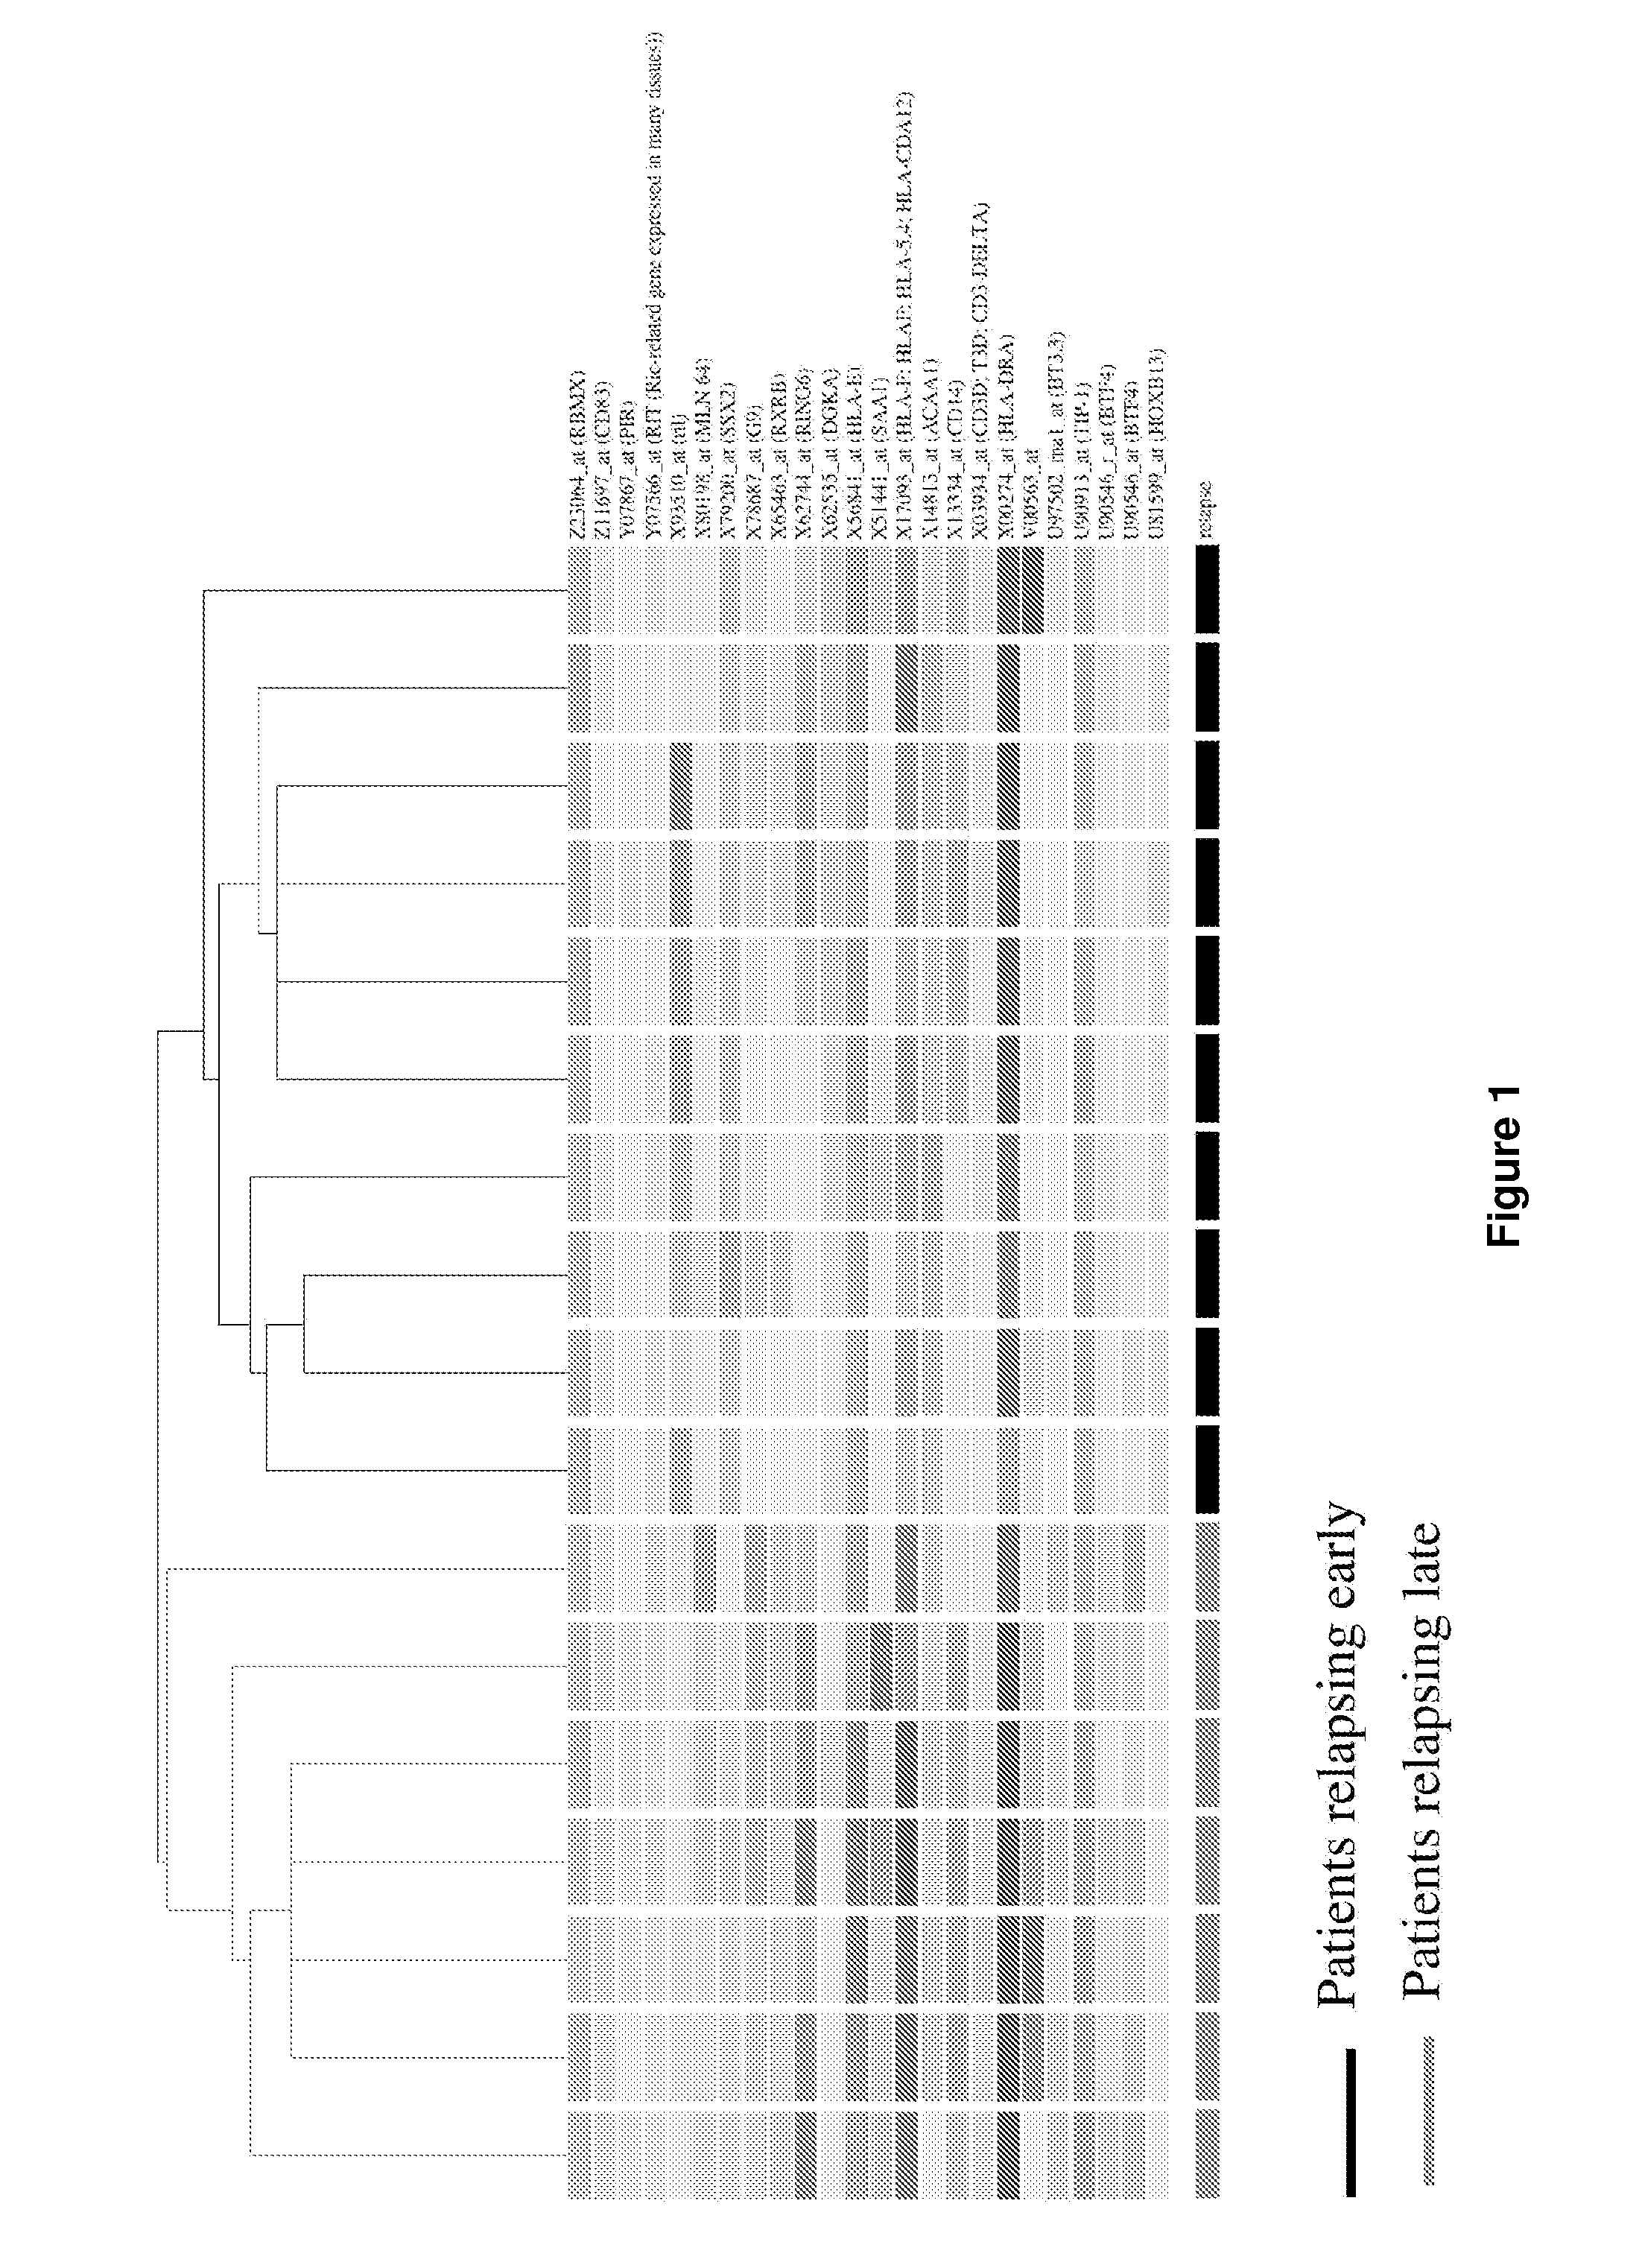
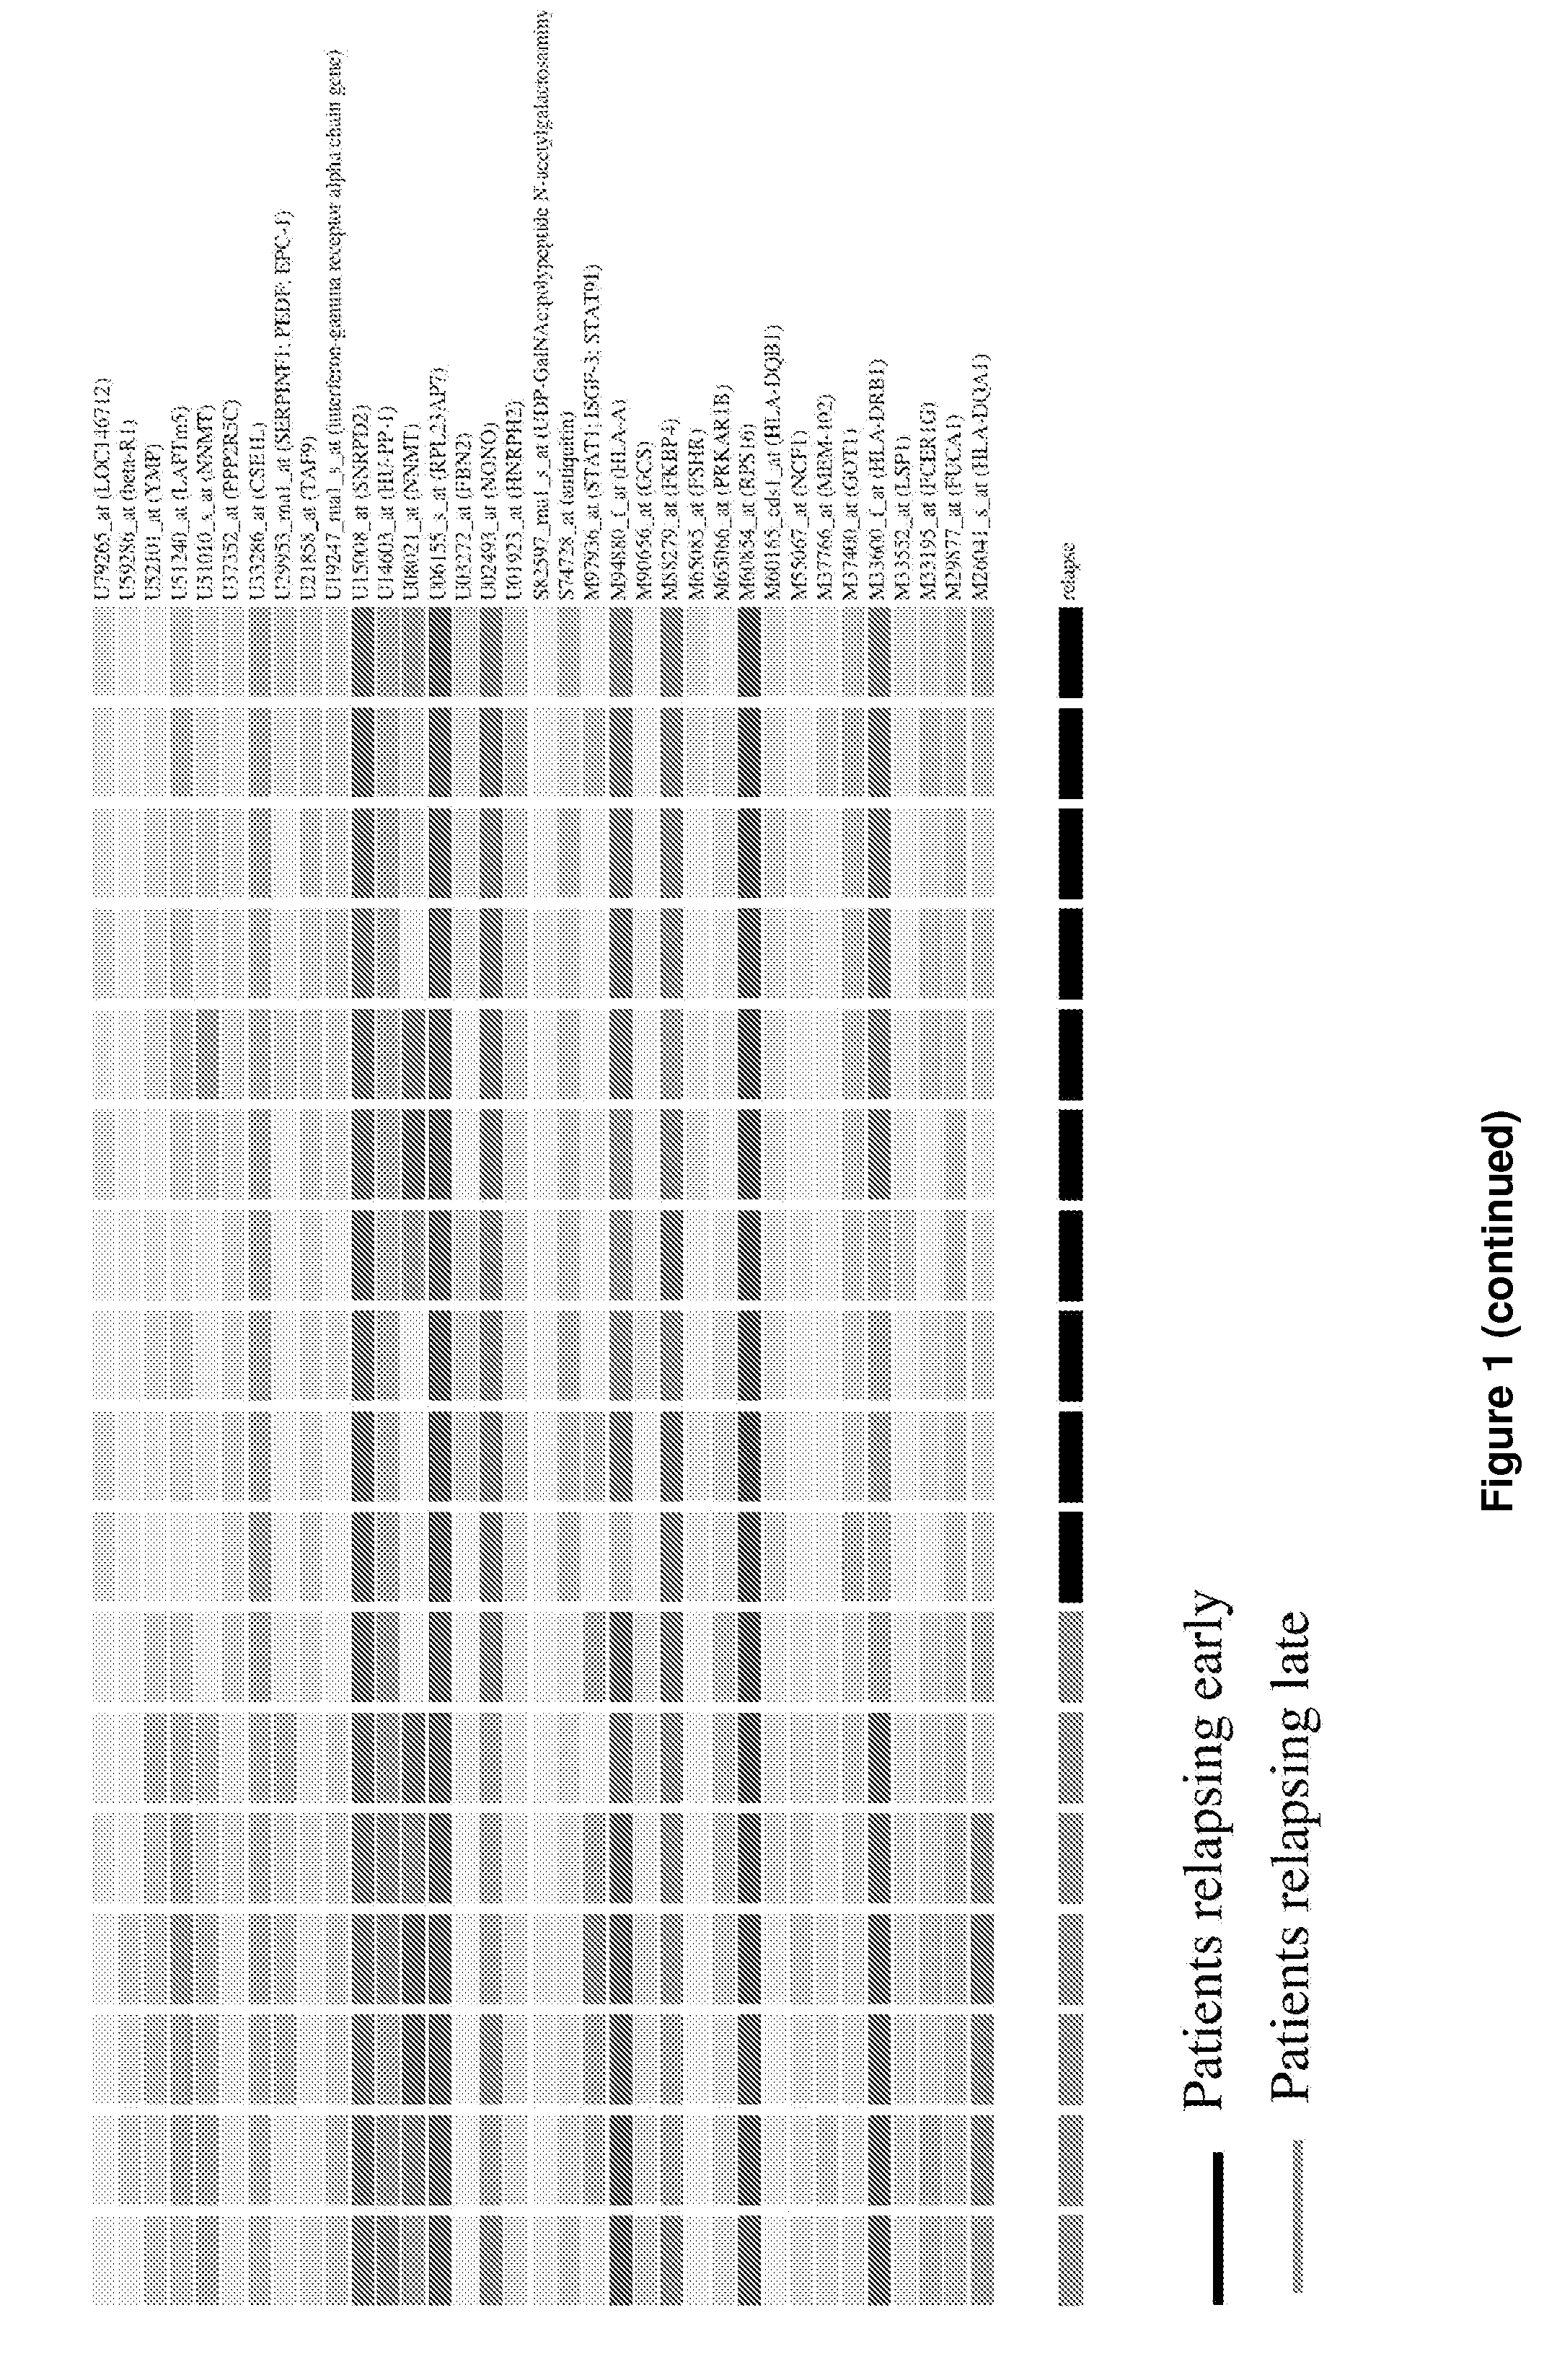
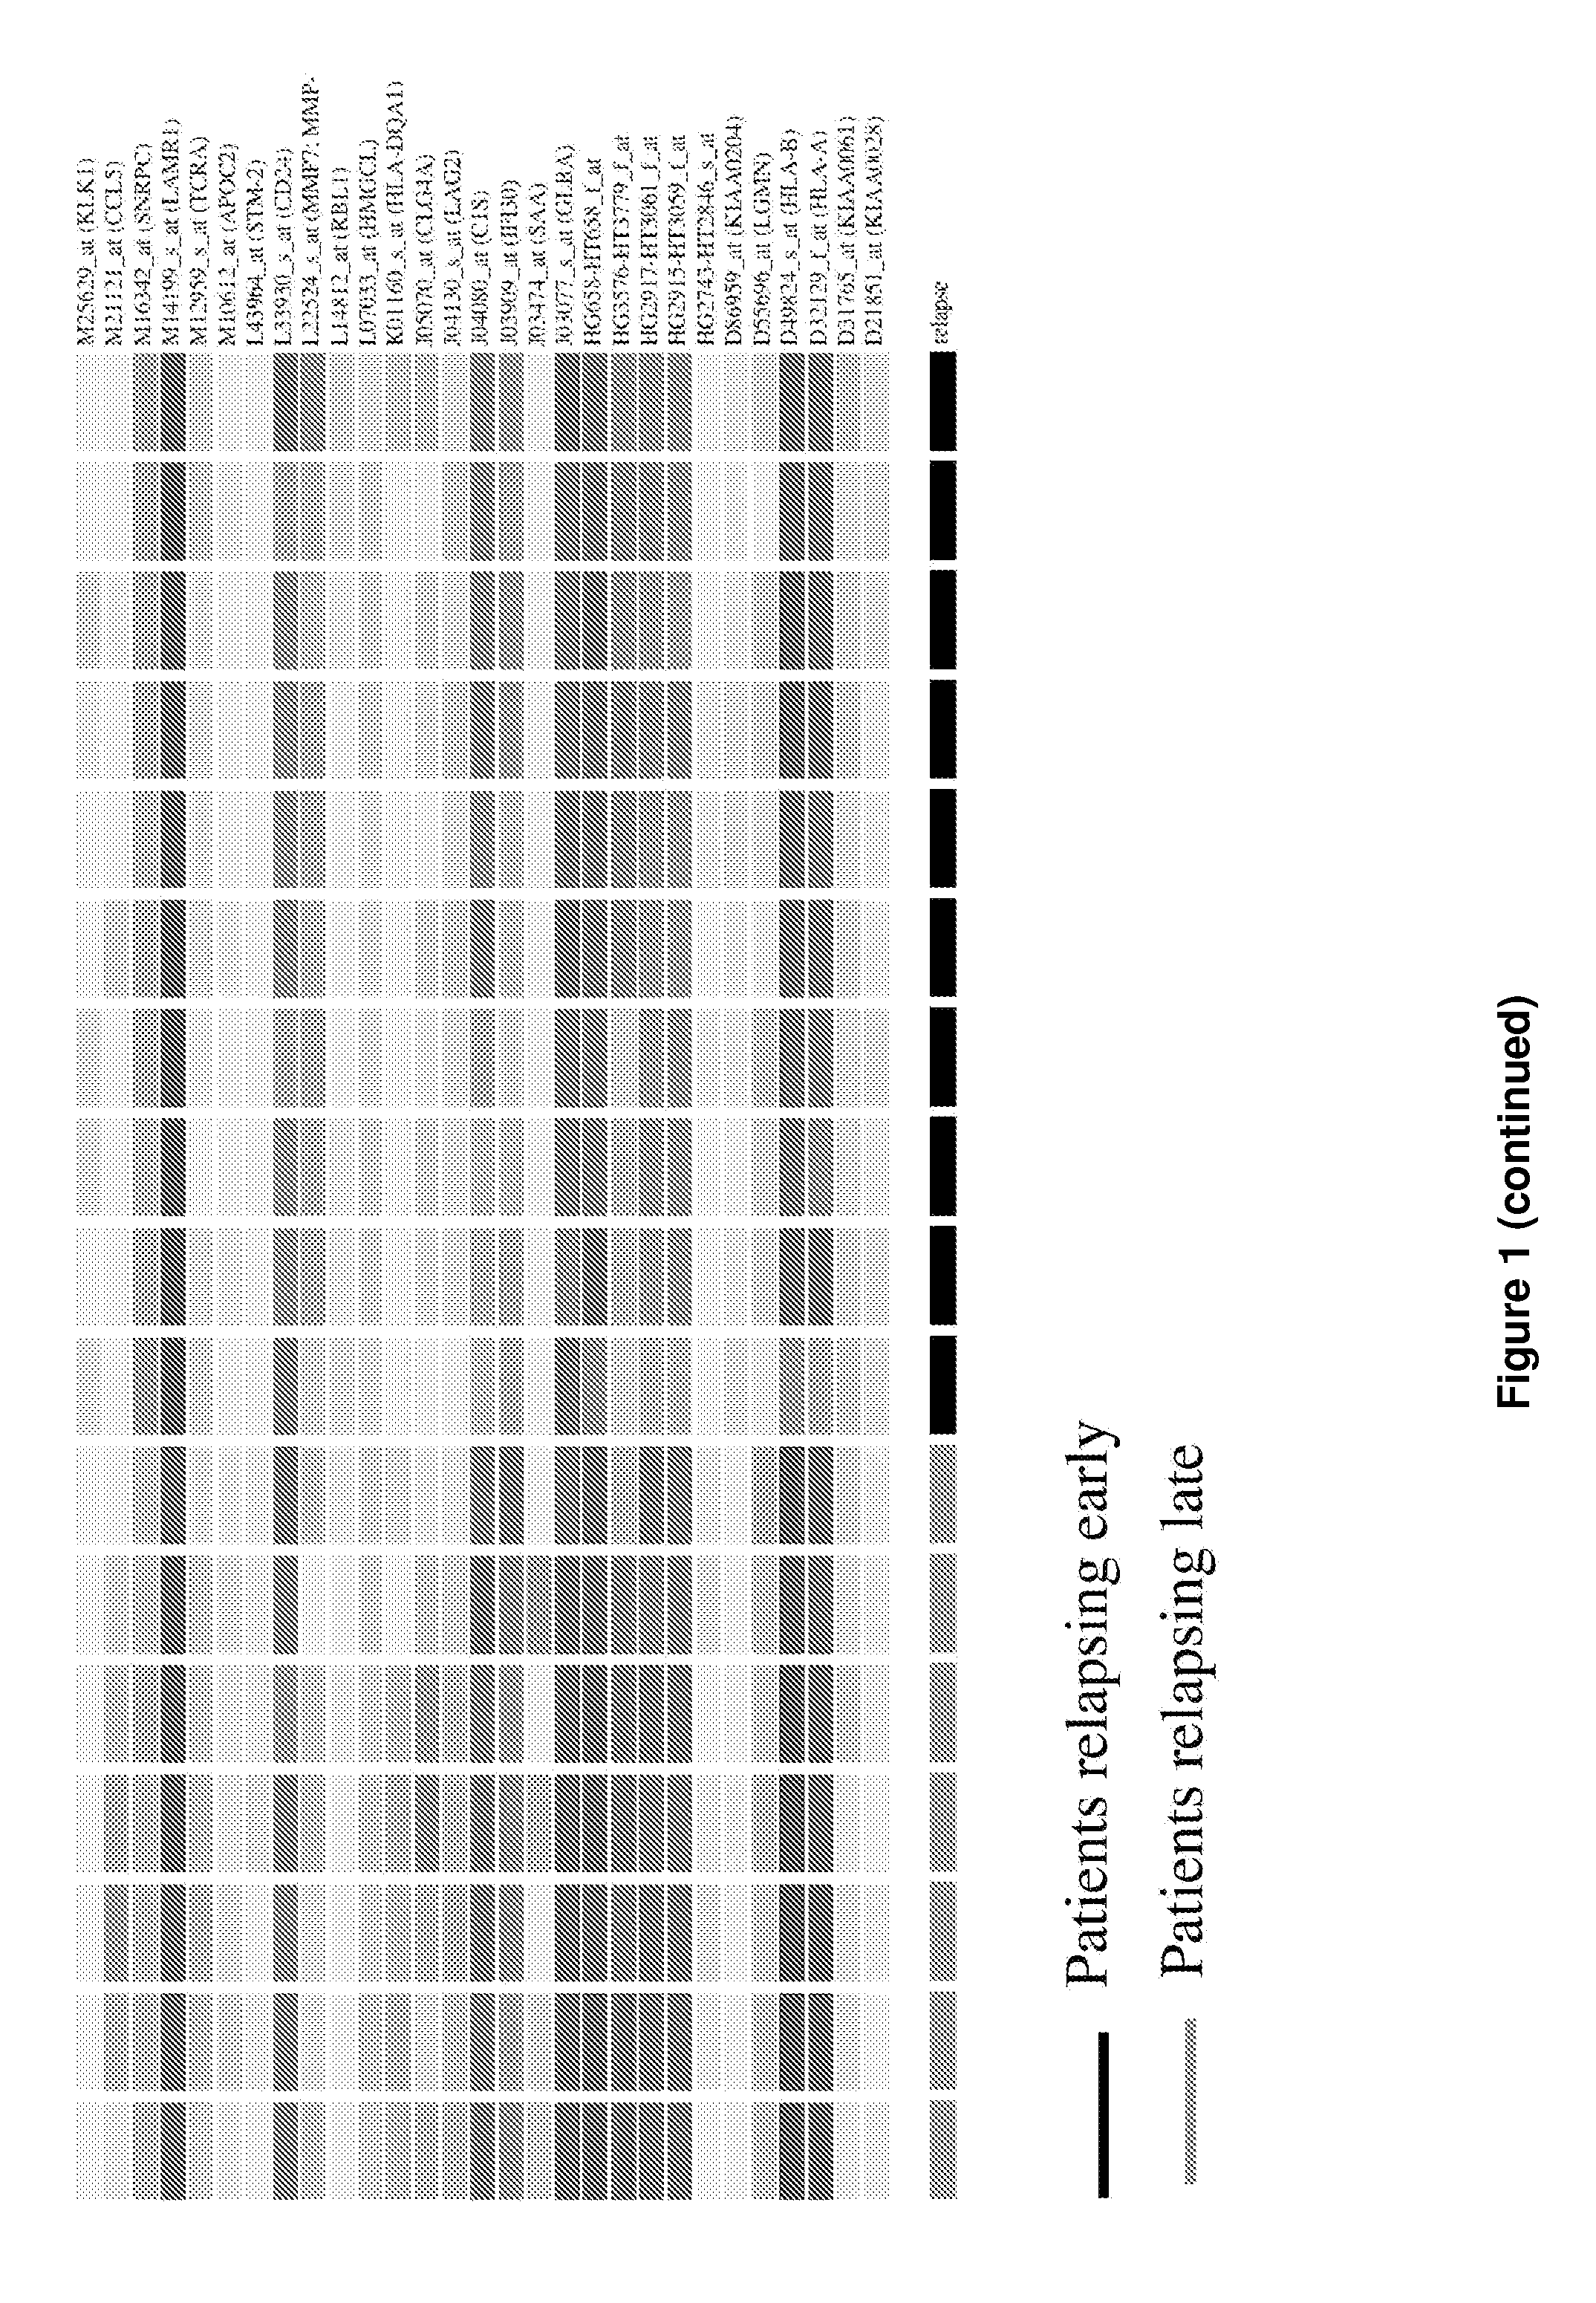
[0117]To identify potential genes whose expression could be used as prognosis markers, a supervised microarray analysis was performed using expression profiles generated from serous tumors from ten patients showing early disease progression (within 18 months after surgery) and seven patients who showed no disease progression prior to two years. Using three different statistical methods, a total of 88 differentially expressed genes were identified distinguishing these two groups. In a further analysis, the expression profiles of these 88 genes were used to perform a hierarchical clustering which showed that they correctly separated the two groups of patients (FIG. 1). Using the k-nearest neighbour algorithm, the expression profile of the 88 genes allowed the proper classification of 16 samples (94% accuracy), while one sample exhibiting later relapse unclassified. Since an objective prognosis of ovarian patients based on...
example 3
Validation of Candidates by Real-Time Quantitative PCR
[0118]To validate the microarray results by a quantitative technique for RNA measurement, an RT-q-PCR analysis was performed on linearly amplified RNA corresponding to the 17 samples included in the microarray analysis. Statistically significant (p<0.05, U-test) overexpression of BTF4, NNMT, CMHE1 and HLA-DRbeta1 was observed between the two groups (FIG. 2). SSX2 showed expression in only two samples and no FUCA1 expression was detectable by RT-quantitative-PCR. Only the genes presenting significant differential expression or a trend towards significance were chosen for further analysis.
PUM
| Property | Measurement | Unit |
|---|---|---|
| Level | aaaaa | aaaaa |
Abstract
Description
Claims
Application Information
 - R&D
- Intellectual Property
- Life Sciences
- Materials
- Tech Scout
- Unparalleled Data Quality
- Higher Quality Content
- 60% Fewer Hallucinations
Browse by: Latest US Patents, China's latest patents, Technical Efficacy Thesaurus, Application Domain, Technology Topic, Popular Technical Reports.
© 2025 PatSnap. All rights reserved.Legal|Privacy policy|Modern Slavery Act Transparency Statement|Sitemap|About US| Contact US: help@patsnap.com


