Method and apparatus for spectrum estimation

a spectrum estimation and spectrum technology, applied in the field of spectrum estimation, can solve the problems of data missing in the common place, and data missing in the routine of dft and

Active Publication Date: 2009-08-27
WELCH ALLYN INC
View PDF4 Cites 16 Cited by
  • Summary
  • Abstract
  • Description
  • Claims
  • Application Information

AI Technical Summary

Benefits of technology

[0029]In yet another embodiment, the digital data representative of the operation of a heart includes data missing one or more data elements in a time series.

Problems solved by technology

However, DFT and FFT routines perform poorly where points are missing in time or where data sampling does not occur with uniform spacing.
In many fields of data collection, data points can be occasionally missing or can occur at non-uniform periods in time.
Also, in astronomical studies, it is common place for data to be missing due to signals falling below detection levels or signals lost in noise.
Because interpolation techniques “manufacture” missing data points or apply mathematical processes to move data points to uniform time spacings in order to apply an FFT or DFT routine, they can unintentionally create a data set that does not produce an accurate result in the frequency domain.
Unfortunately, the LST requires a large number of mathematical operations and therefore fast processing speeds.
There has been some success in producing streamlined methods for the LST (analogous to how the FFT streamlines DFT calculations), however the streamlined LST techniques are still computationally intensive.
Off-line transformations are generally less suitable for “real-time” signal processing.

Method used


Image

  • Method and apparatus for spectrum estimation
  • Method and apparatus for spectrum estimation
  • Method and apparatus for spectrum estimation

Examples


example 1

[0054]Randomly Varying Sample Time Interval: The first example provides an illustration of spectrum estimation performance in a situation where the time interval between samples varies randomly as multiple of the basic time quantization, 1 / fs. I use the following sinusoidal signal:

r(t)=∑i=-(M-1) / 2(M-1) / 2aij2πfit+v(t)(I-3)

with M+1 frequencies, fi, and corresponding amplitudes, ai, which may be complex numbers. ν(t): N(0,σ2) is a normally distributed, zero mean additive random noise.

[0055]For the simulation of example 1, I chose a1=a−1=a2=a−2, a3=a−3=a4=a−4=1, and f1=10, f−1=−10 f2=20, f−2=−20, f3=100, f−3=100, f4=200, f−4=200 Hz, and standard deviation of ν(t) is σ=0.01. All other parameters are equal to zero. Let fs=512 and sample the signal at discrete times.

tn=3n+⌊z+0.5⌋fs(I-4)

[0056]where z is a random number uniformly distributed between −1.5 and 1.5. The offset of 0.5 causes the “floor function”,

└z┘=max{nεZ|n≦z}  (I-5)

to round (versus truncate). The sample time interval varies r...

example 2

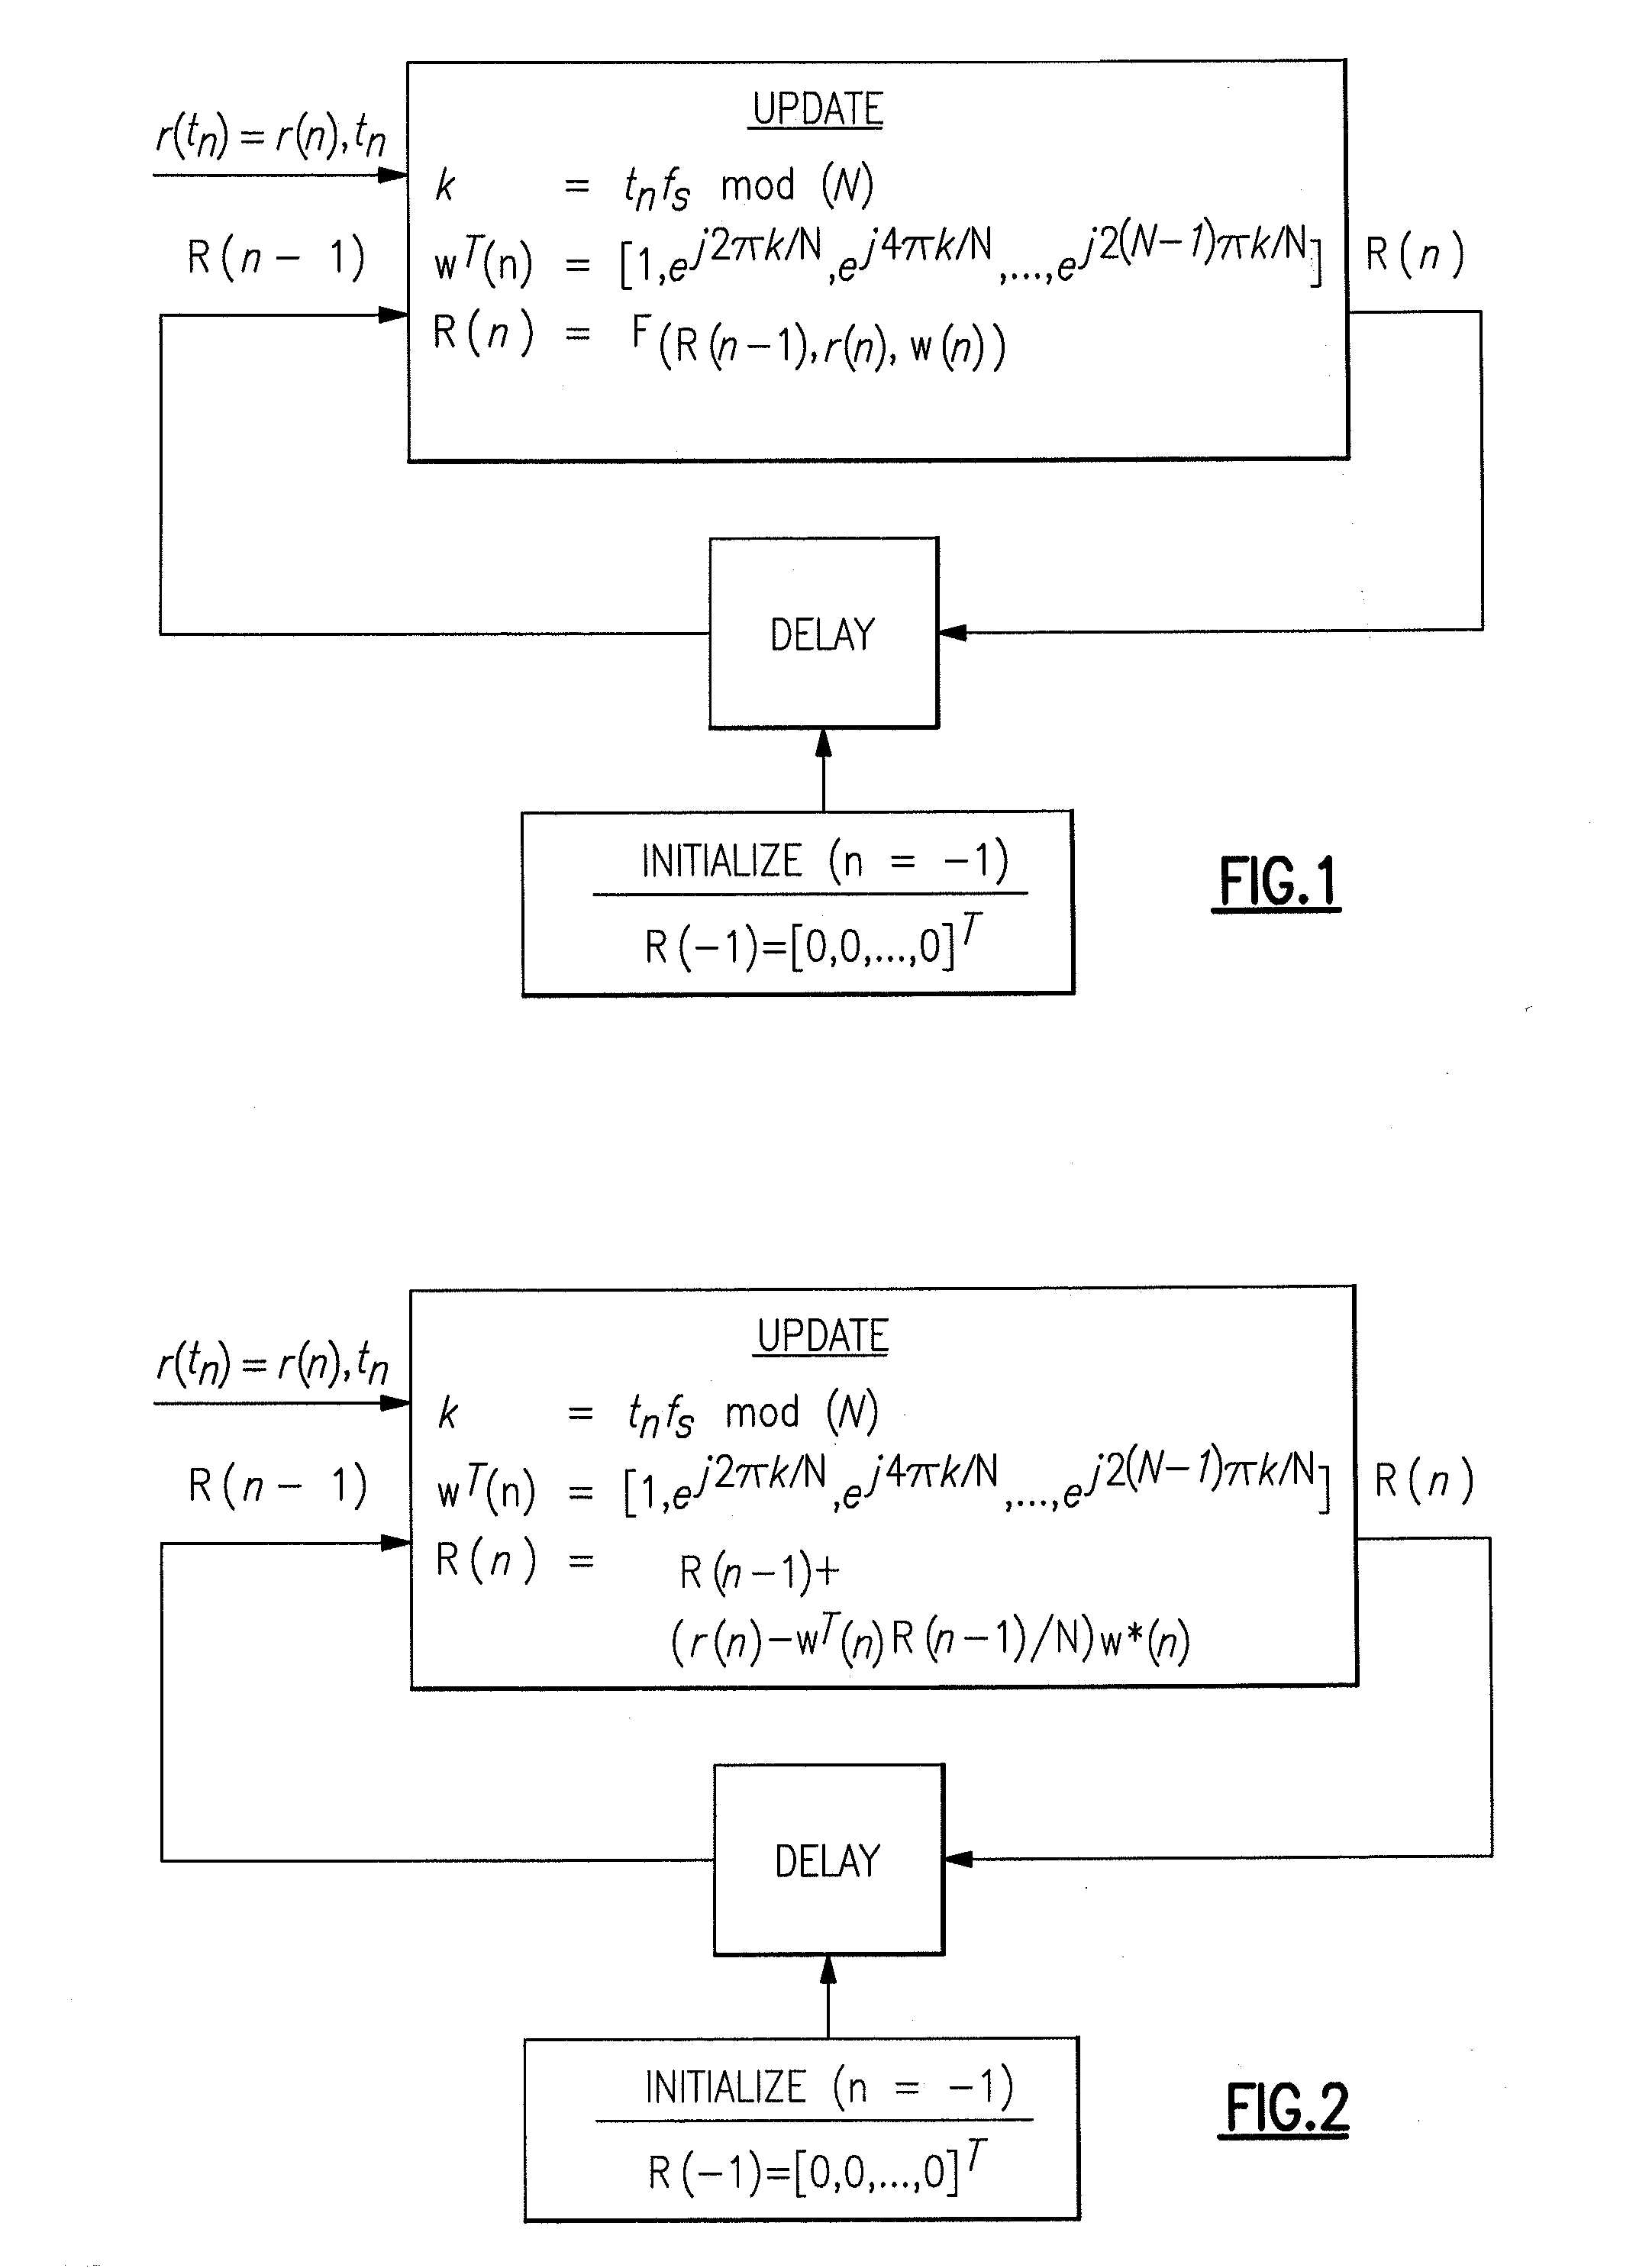
[0057]Narrow Signal Bandwidth Within a Wide Analysis Bandwidth: This second example illustrates how to exploit a priori knowledge of R(n) in order to avoid significant amounts of computation. For example, if it is known that a certain portion of the coefficients R(n) are zero, they can be removed from the vector R(n) in EQ. I-2 (and hence are not stored or updated), and the corresponding components are removed from the complex exponential vectors.

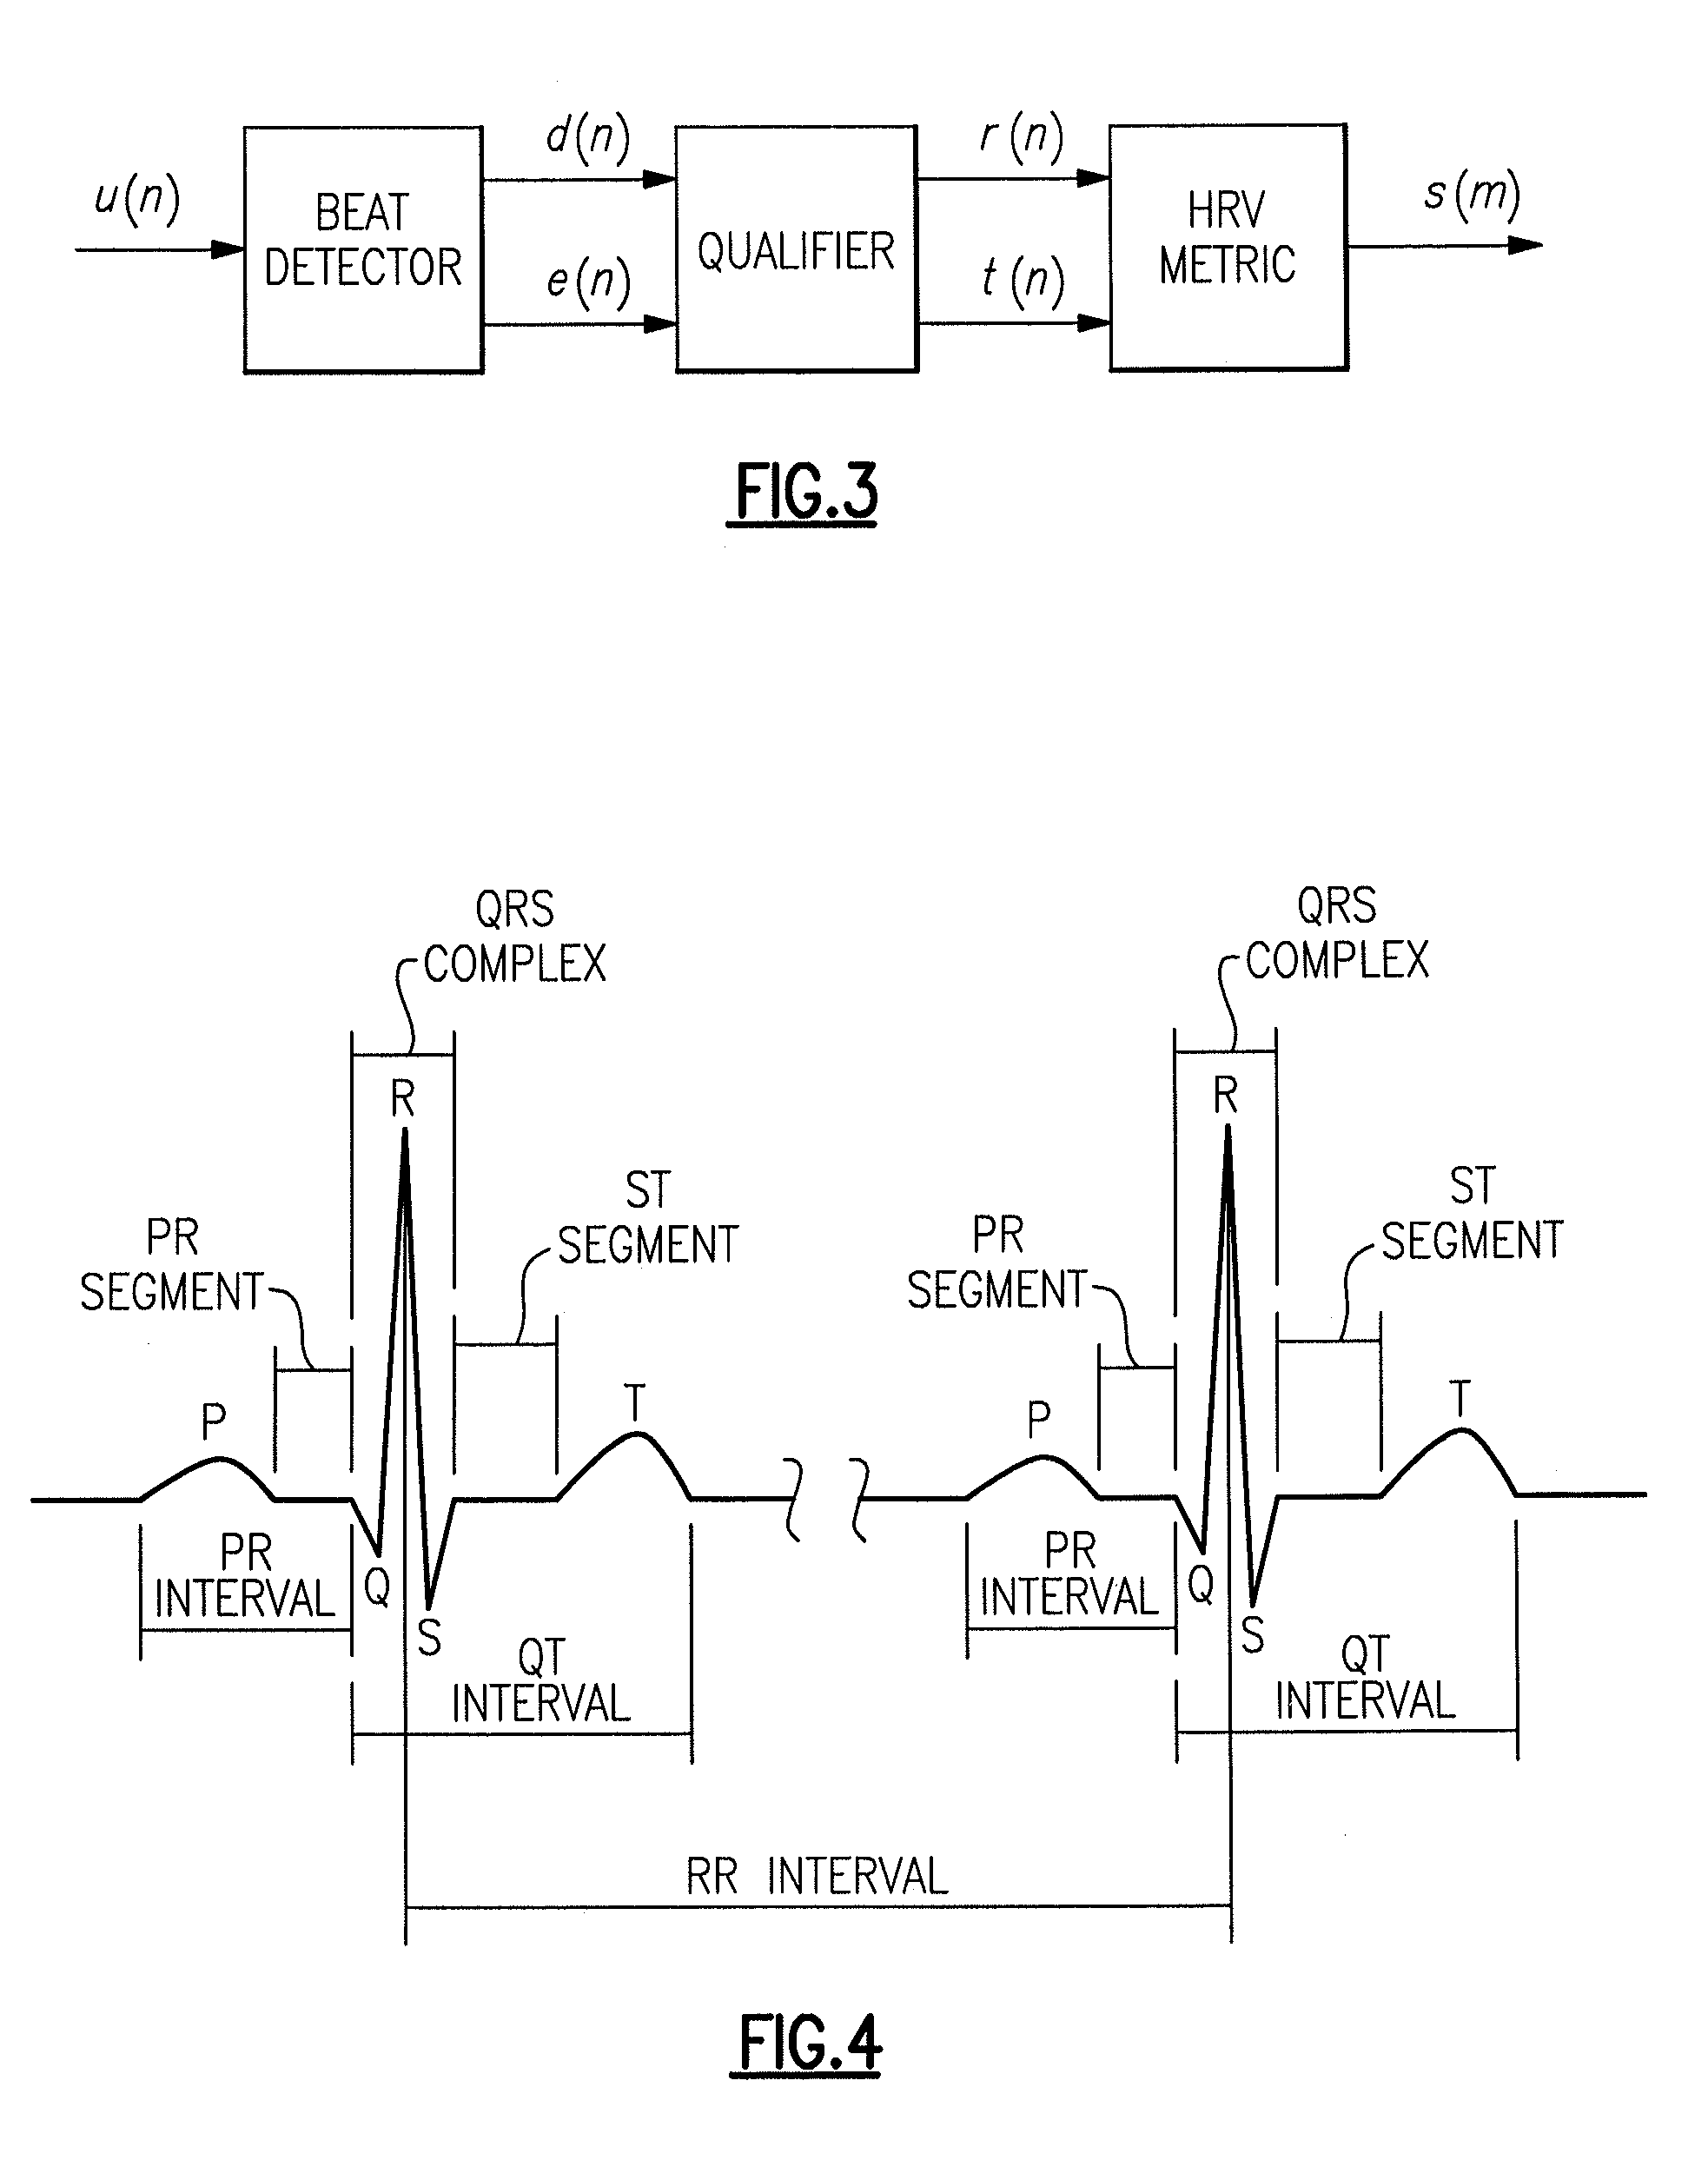
[0058]A simple model for the “instantaneous heart rate” is:

h(t)=hm+a1 cos(2πf1t)+ah cos(2πf2t)+ν(t)  (I-6)

which is the heart rate equal to the reciprocal of the time interval between successive heart beats, a time interval that varies from beat to beat. Excluding the DC mean, two frequency peaks can roughly model the spectral characteristics of the heart rate, as discussed in more detail below. For this example, I chose a sampling rate of fs; =500, and hm=60 to be the mean number of beats per minute (bpm). Let a1=2 bpm, ah=2.5 bpm, fi=0.095...

example 3

[0075]FIG. 7 shows graphs of power spectrum estimates comparing the LST of EQ. II-1 with the RFT of EQ. I-2 at 512 equally spaced frequencies for a synthetic signal having 4 cosine frequencies and 1% noise. The sample time interval varied randomly from 1 to 5 times the basic time quantization of 1 / 512 seconds. FIG. 7 compares spectrum estimates using the first exemplary signal of EQ. I-3 with four sinusoidal frequencies and a sample time interval that varies randomly from 1 to 5 times the basic time quantization of 1 / 512 seconds.

[0076]In example 3, both estimators show all four frequency peaks. However, the RFT is more consistent for this stationary signal example in the sense that signal to noise ratio improves as more data samples are used in computing the estimate.


PUM


Abstract

The invention relates to a method for transforming physiological data from the time domain to the frequency domain. The method includes the steps of: providing a plurality of digital data in the time domain; providing a microcomputer programmed to run a recursive Fourier transform estimation algorithm; calculating, for each newly received digital data in the time domain, an integer index using modulo(N) arithmetic based on a time the each newly received data was received; selecting a frequency vector from a plurality of N frequency vectors using the integer index; and updating the plurality of frequency coefficients according to a recursive equation including the selected frequency vector as an input variable. The invention also relates to an apparatus that performs a recursive Fourier transform estimation algorithm to convert data in the time domain to data in the frequency domain.

Description

FIELD OF THE INVENTION[0001]This invention relates generally to spectrum estimation and more particularly to a time domain to frequency domain transformation where data is non-uniformly spaced in time or where there is missing data.BACKGROUND OF THE INVENTION[0002]A great variety of electronic sensors, ranging from sensors used in astronomical studies to sensors used for monitoring physiological parameters of the human body, provide electrical signals representing desired measurements. Beyond the realm of astronomy and medicine, electronic sensors now pervade in all aspects of our lives and throughout our environment.[0003]In data collection, an electronic converter, such as an analog to digital converter (“ADC”) generally receives an electrical signal from one or more sensors and produces digital data at a regular rate (discrete data points in time) representing each converted measurement value. Such streams of digital data can be displayed on a graph as data points plotted in time...

Claims


Application Information

Patent Timeline
Patent Type & Authority Applications(United States)
IPC IPC(8): A61B5/02G06F17/14
CPCG06F17/141
Inventor HOLLAND, ALEXANDER
Owner WELCH ALLYN INC
Why Eureka
Try Eureka