Geophysical surveying

a geophysical surveying and geophysical technology, applied in the field of geophysical surveying, can solve the problems of weaker em fields seen at the detector, poor spatial resolution of the results, and inability to distinguish what is in the reservoir (i.e., the pore fluid)

Active Publication Date: 2009-12-10
PGS GEOPHYSICAL AS
View PDF5 Cites 24 Cited by
  • Summary
  • Abstract
  • Description
  • Claims
  • Application Information

AI Technical Summary

Benefits of technology

[0015]For example, the acceptance criterion for a subterranean model may depend on a measure of a difference between simulated CSEM survey results predicted for the subterranean model and CSEM survey results derived from the CSEM survey data. This can ensure models which are most consistent with the observed data have more chance of being accepted, and so contributing to the final PDFs.
[0016]The acceptance criterion may depend on a measure of a difference between the subterranean model and a baseline subterranean model. For example, the baseline model may be a model generated in a previous iteration which was identified as being the best-fitting model from that iteration, e.g., because it was the model meeting the acceptance criterion by the greatest margins. Alternatively, the baseline model could be defined by the expectation values for the PDFs from a previous iteration. Comparing current models with a baseline derived from a previous model(s) in this way can assist the PDFs in successive iterations to converge by ensuring models which differ significantly from the baseline model are less likely to be accepted.
[0017]The acceptance criterion may depend on how many iterations of steps (d), (e) and (f) have been previously performed. For example, early in the iteration process models may be more likely to be accepted than later in the process. This can help avoid the search for optimum PDFs from becoming “stuck” in a local minimum in the search space, while maintaining a reasonable likelihood of convergence towards the end of the iteration process.

Problems solved by technology

However, a drawback of seismic techniques is that while they are able to readily identify rock structures which might potentially contain, e.g., hydrocarbon (hydrocarbon reservoirs), the techniques are often unable to distinguish what is in the reservoir (i.e., the pore fluids).
Conversely, the presence of relatively more conductive structures in the subterranean strata will, in general, lead to weaker EM fields seen at the detector.
However, a drawback of CSEM survey techniques in some situations is that they provide results having relatively poor spatial resolution, especially compared to seismic techniques.
It is, however, identified with relatively poor spatial resolution.
This results from the above-mentioned relatively poor spatial resolution of conventionally processed CSEM data.
Thus FIG. 1 demonstrates the relatively poor spatial resolution associated with resistivity profiles derived from surface CSEM data, at least compared to the spatial resolution of seismic profiles obtainable from seismic surveying.
It may be noted, however, that while the CSEM profile in FIG. 1 shows relatively poor spatial resolution, it nonetheless recovers the transverse resistance of the gas-sand layer well.
However, the present inventors have found that the problem of using structural information, e.g. from seismic surveying, to constrain CSEM data is not an easy one to solve reliably.
This is because the problem is not in general uniquely solvable, and furthermore, once a solution has been determined, there is typically no ready measure of the likelihood of the solution being a good match for the subterranean strata (i.e., there is no confidence measure).

Method used


Image

  • Geophysical surveying
  • Geophysical surveying
  • Geophysical surveying

Examples


Embodiment Construction

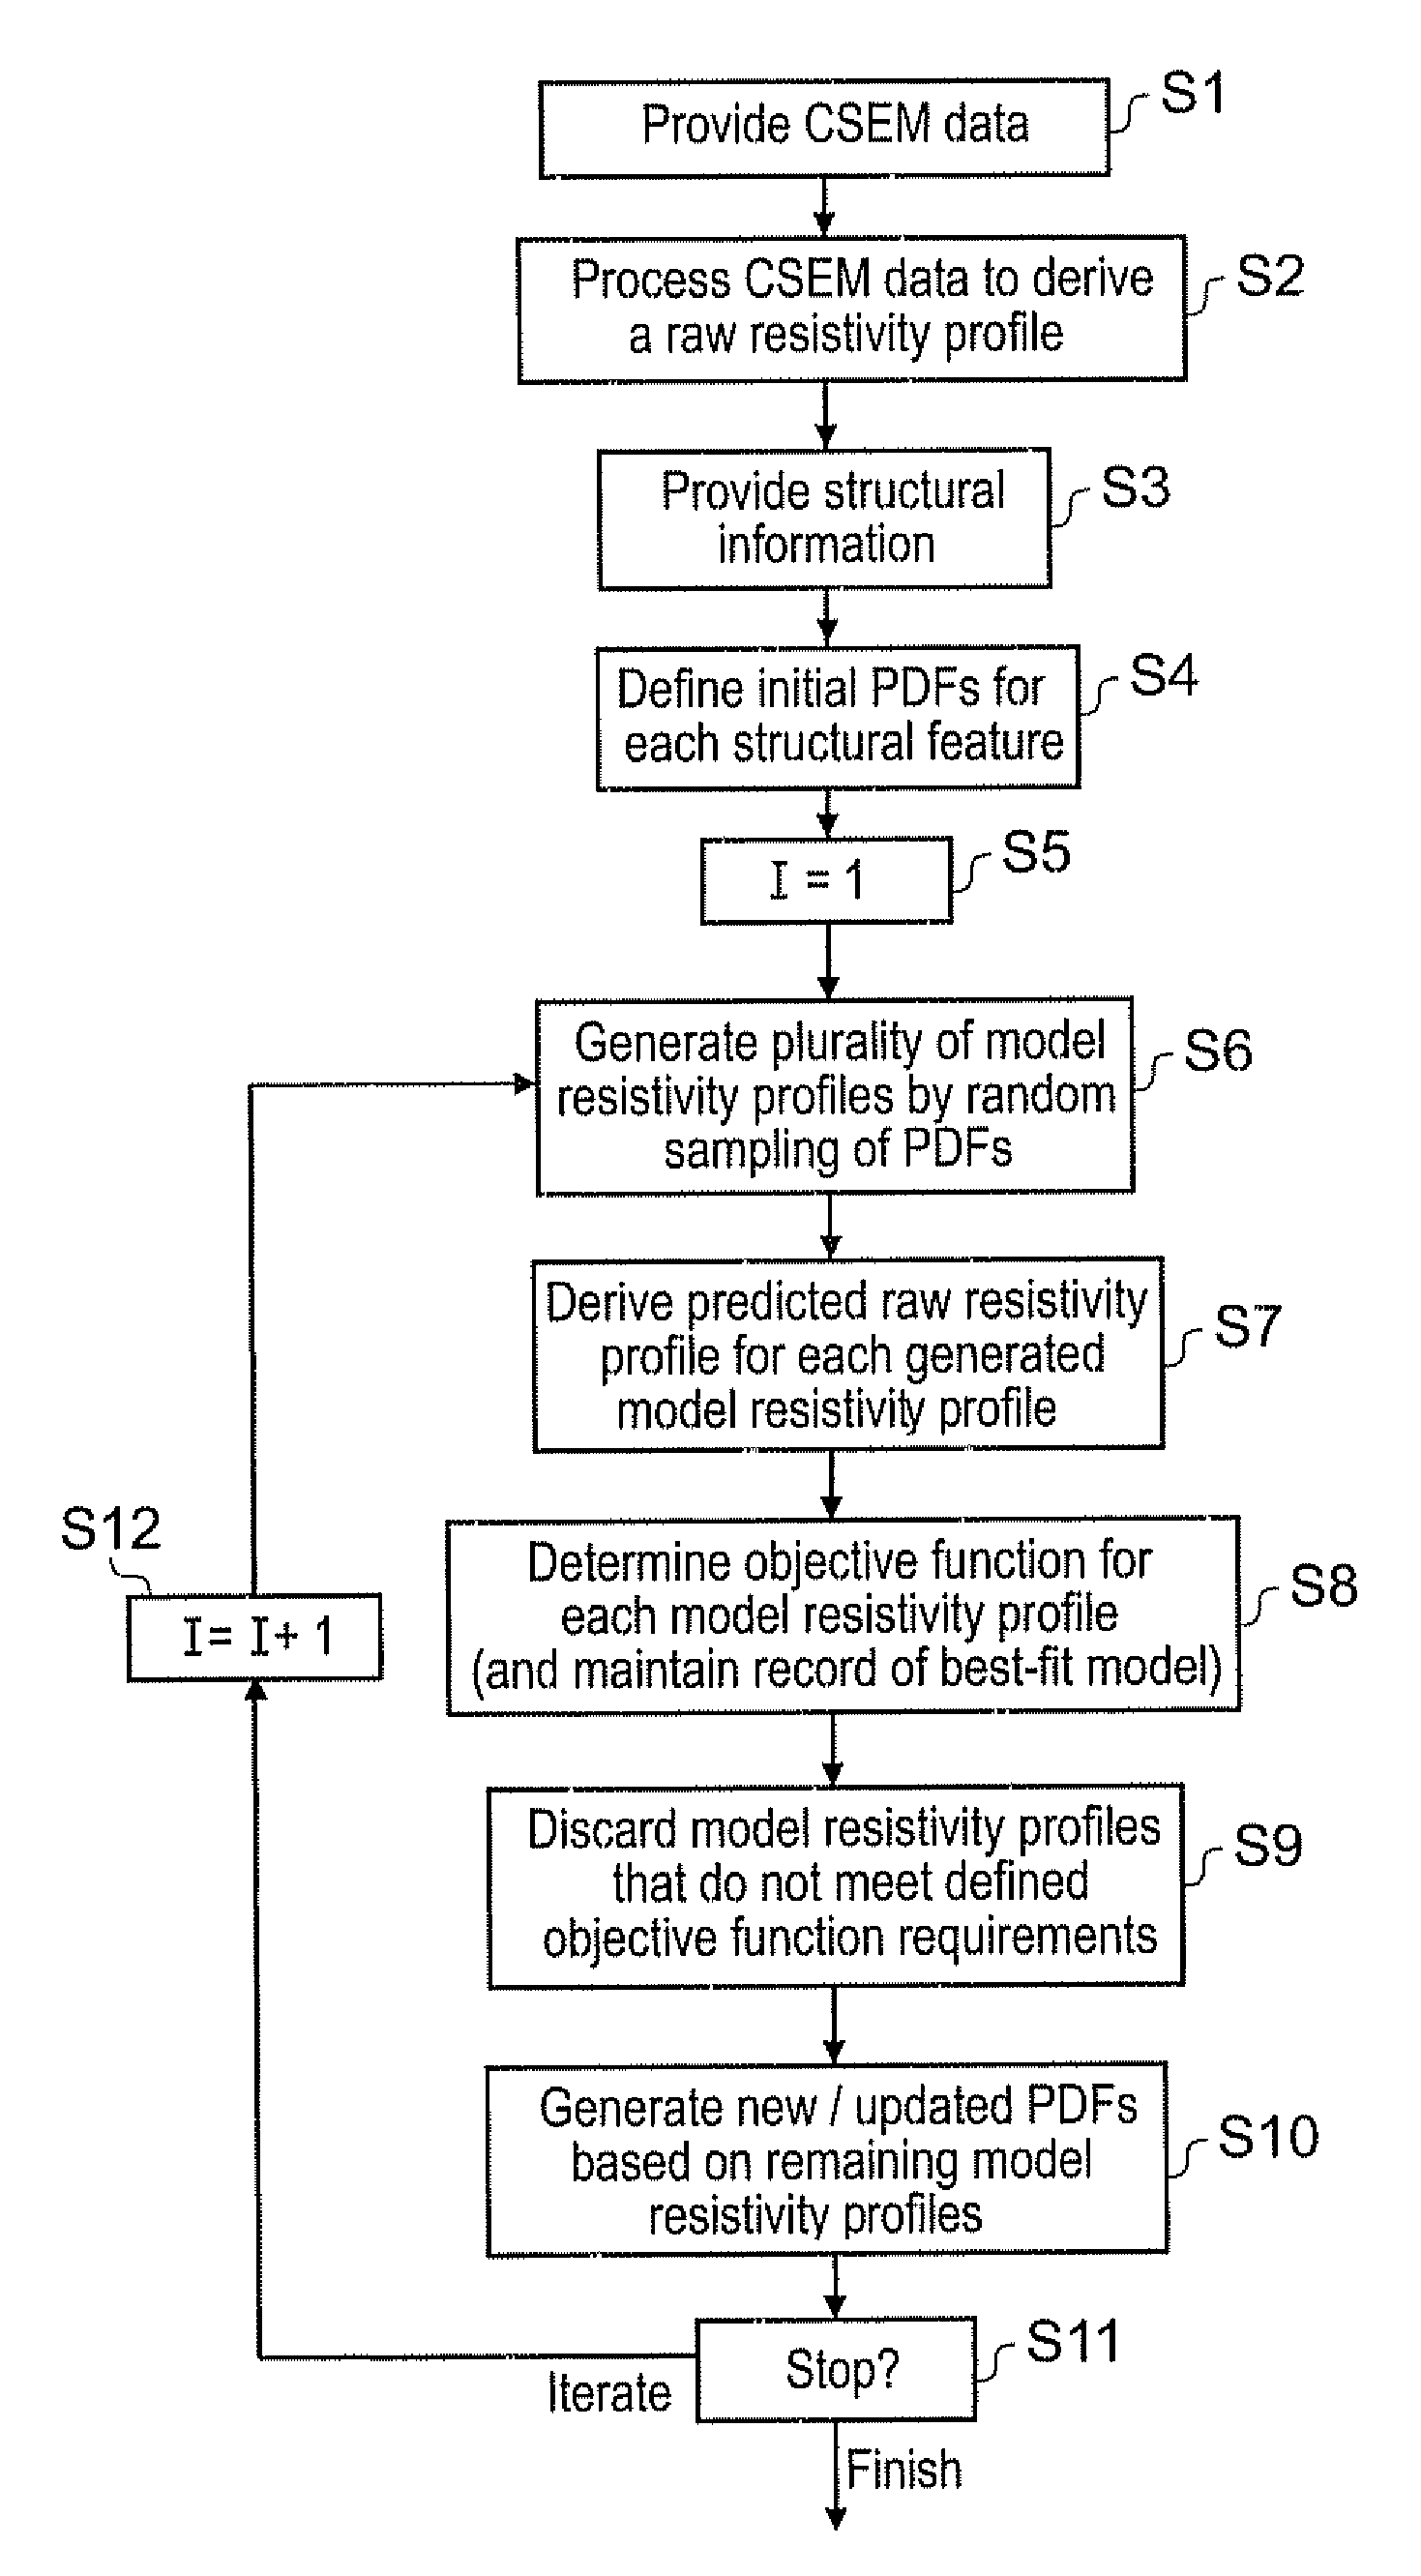
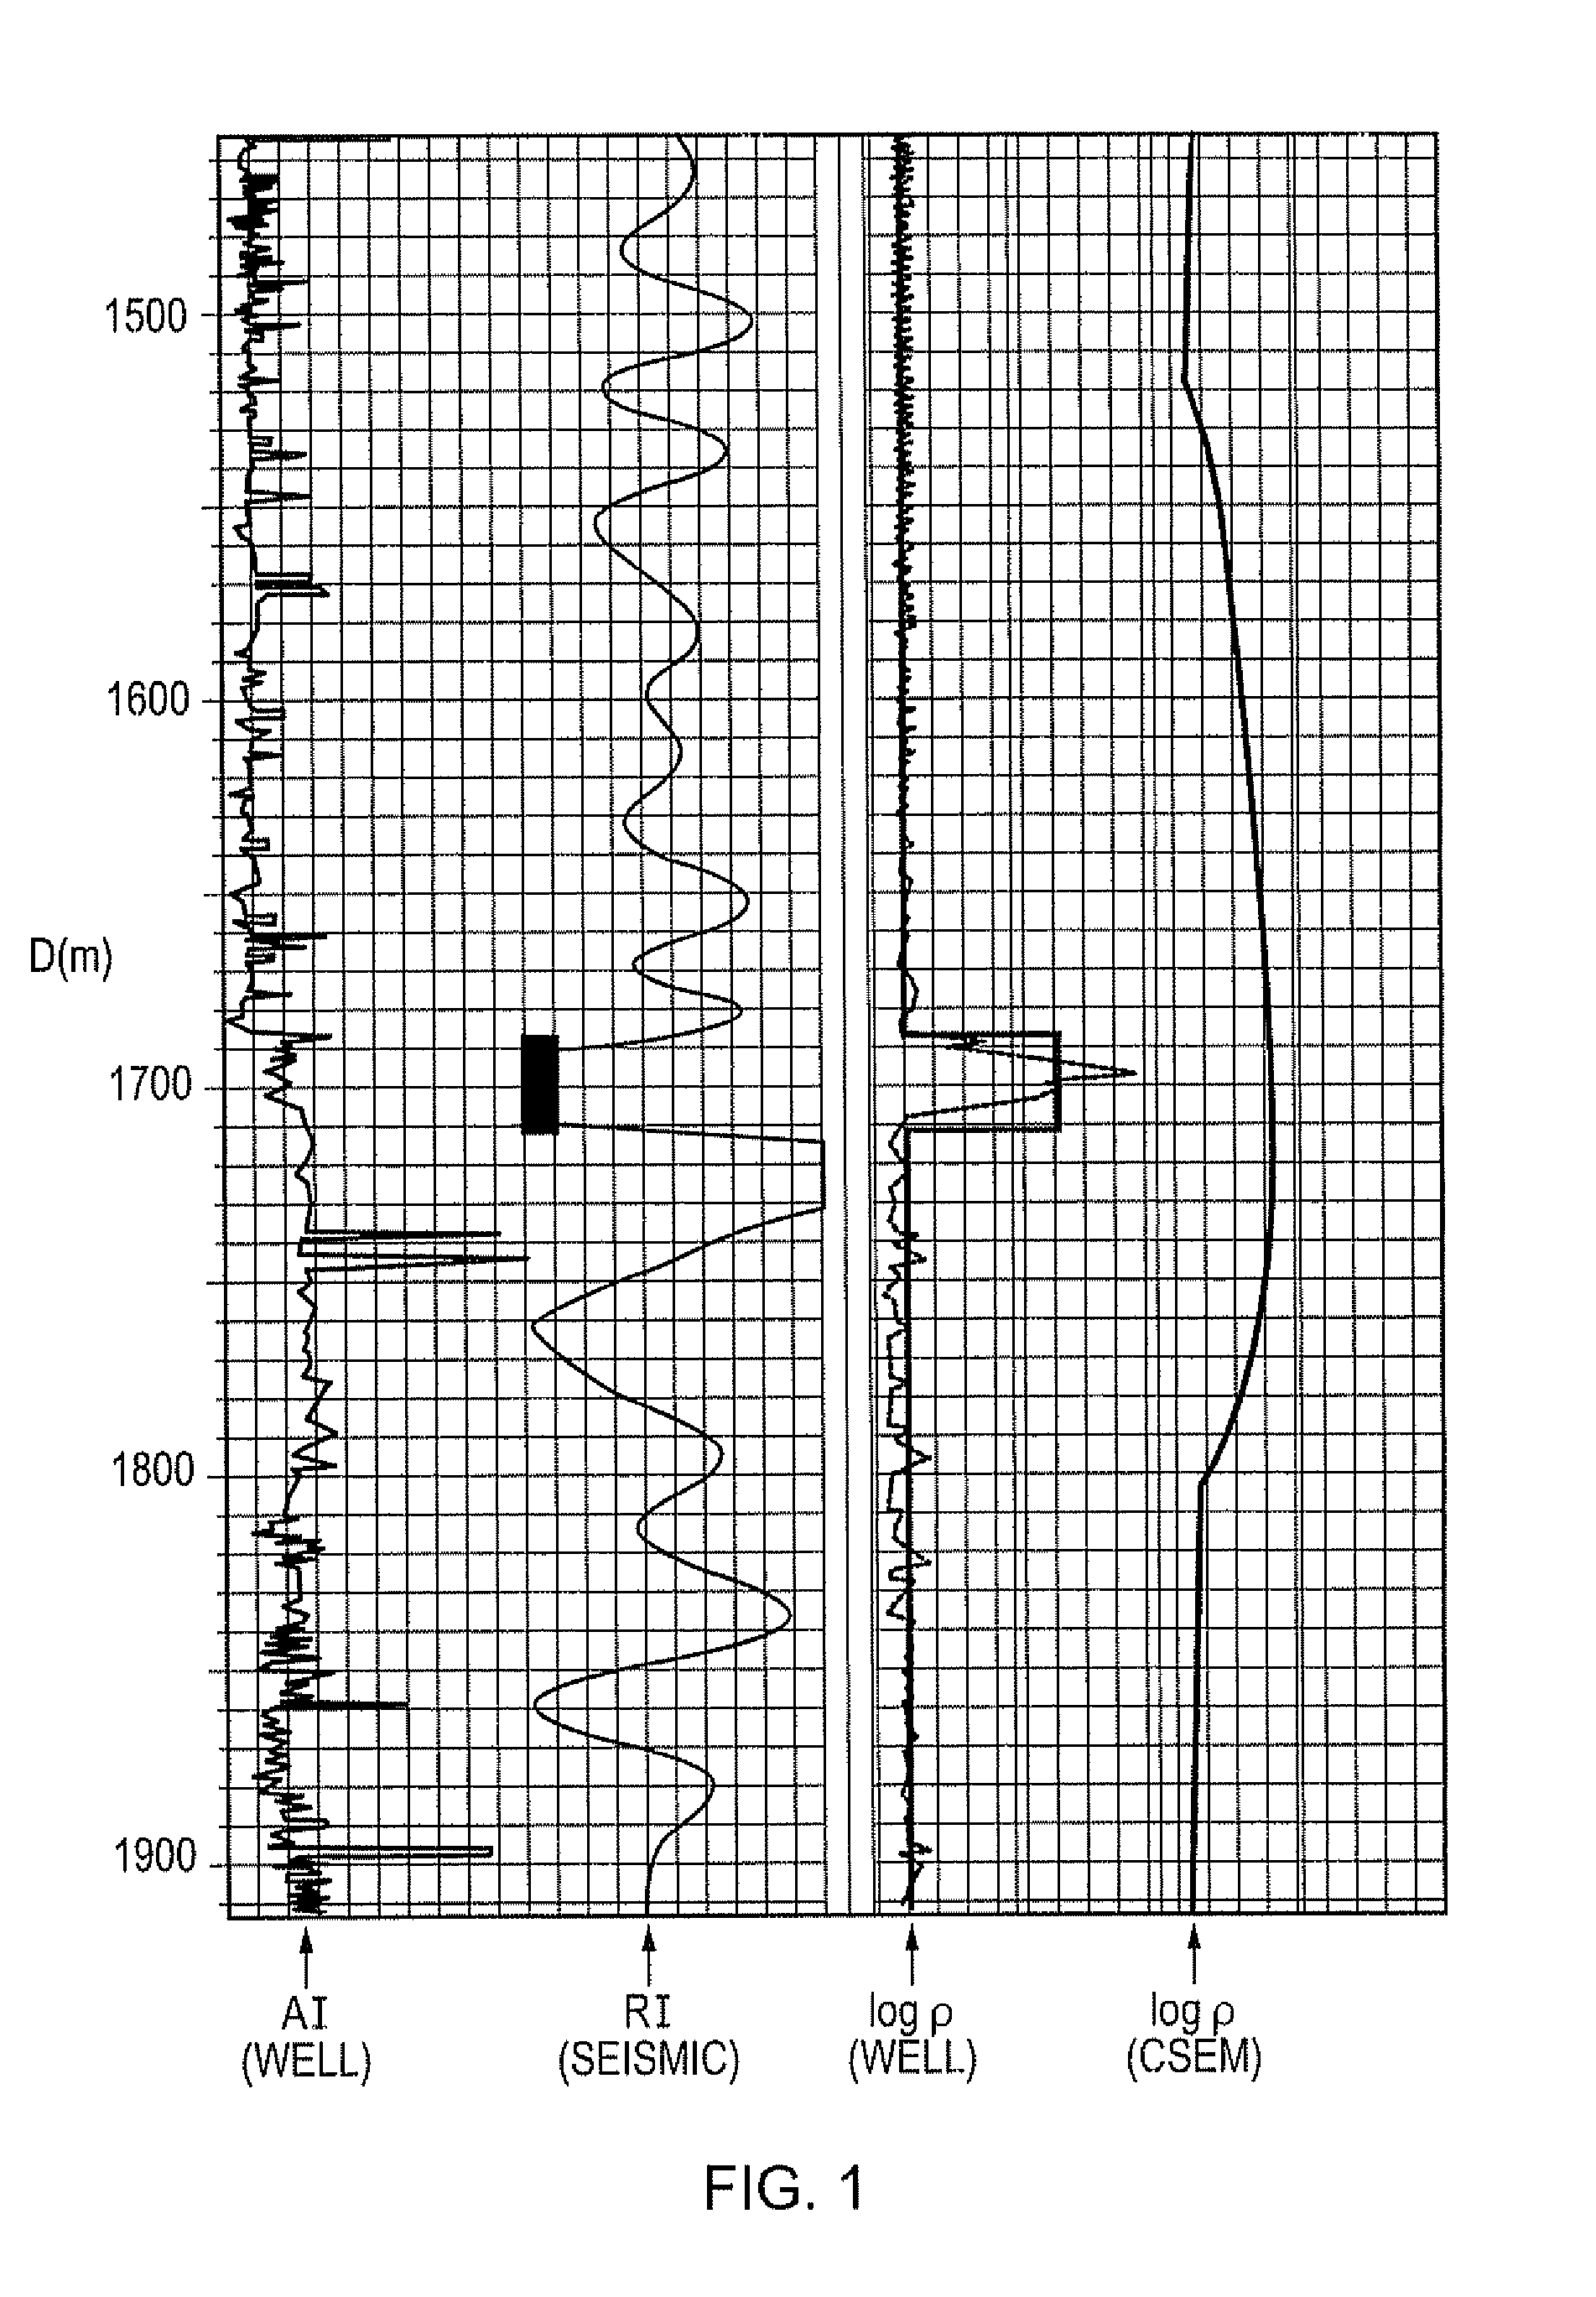
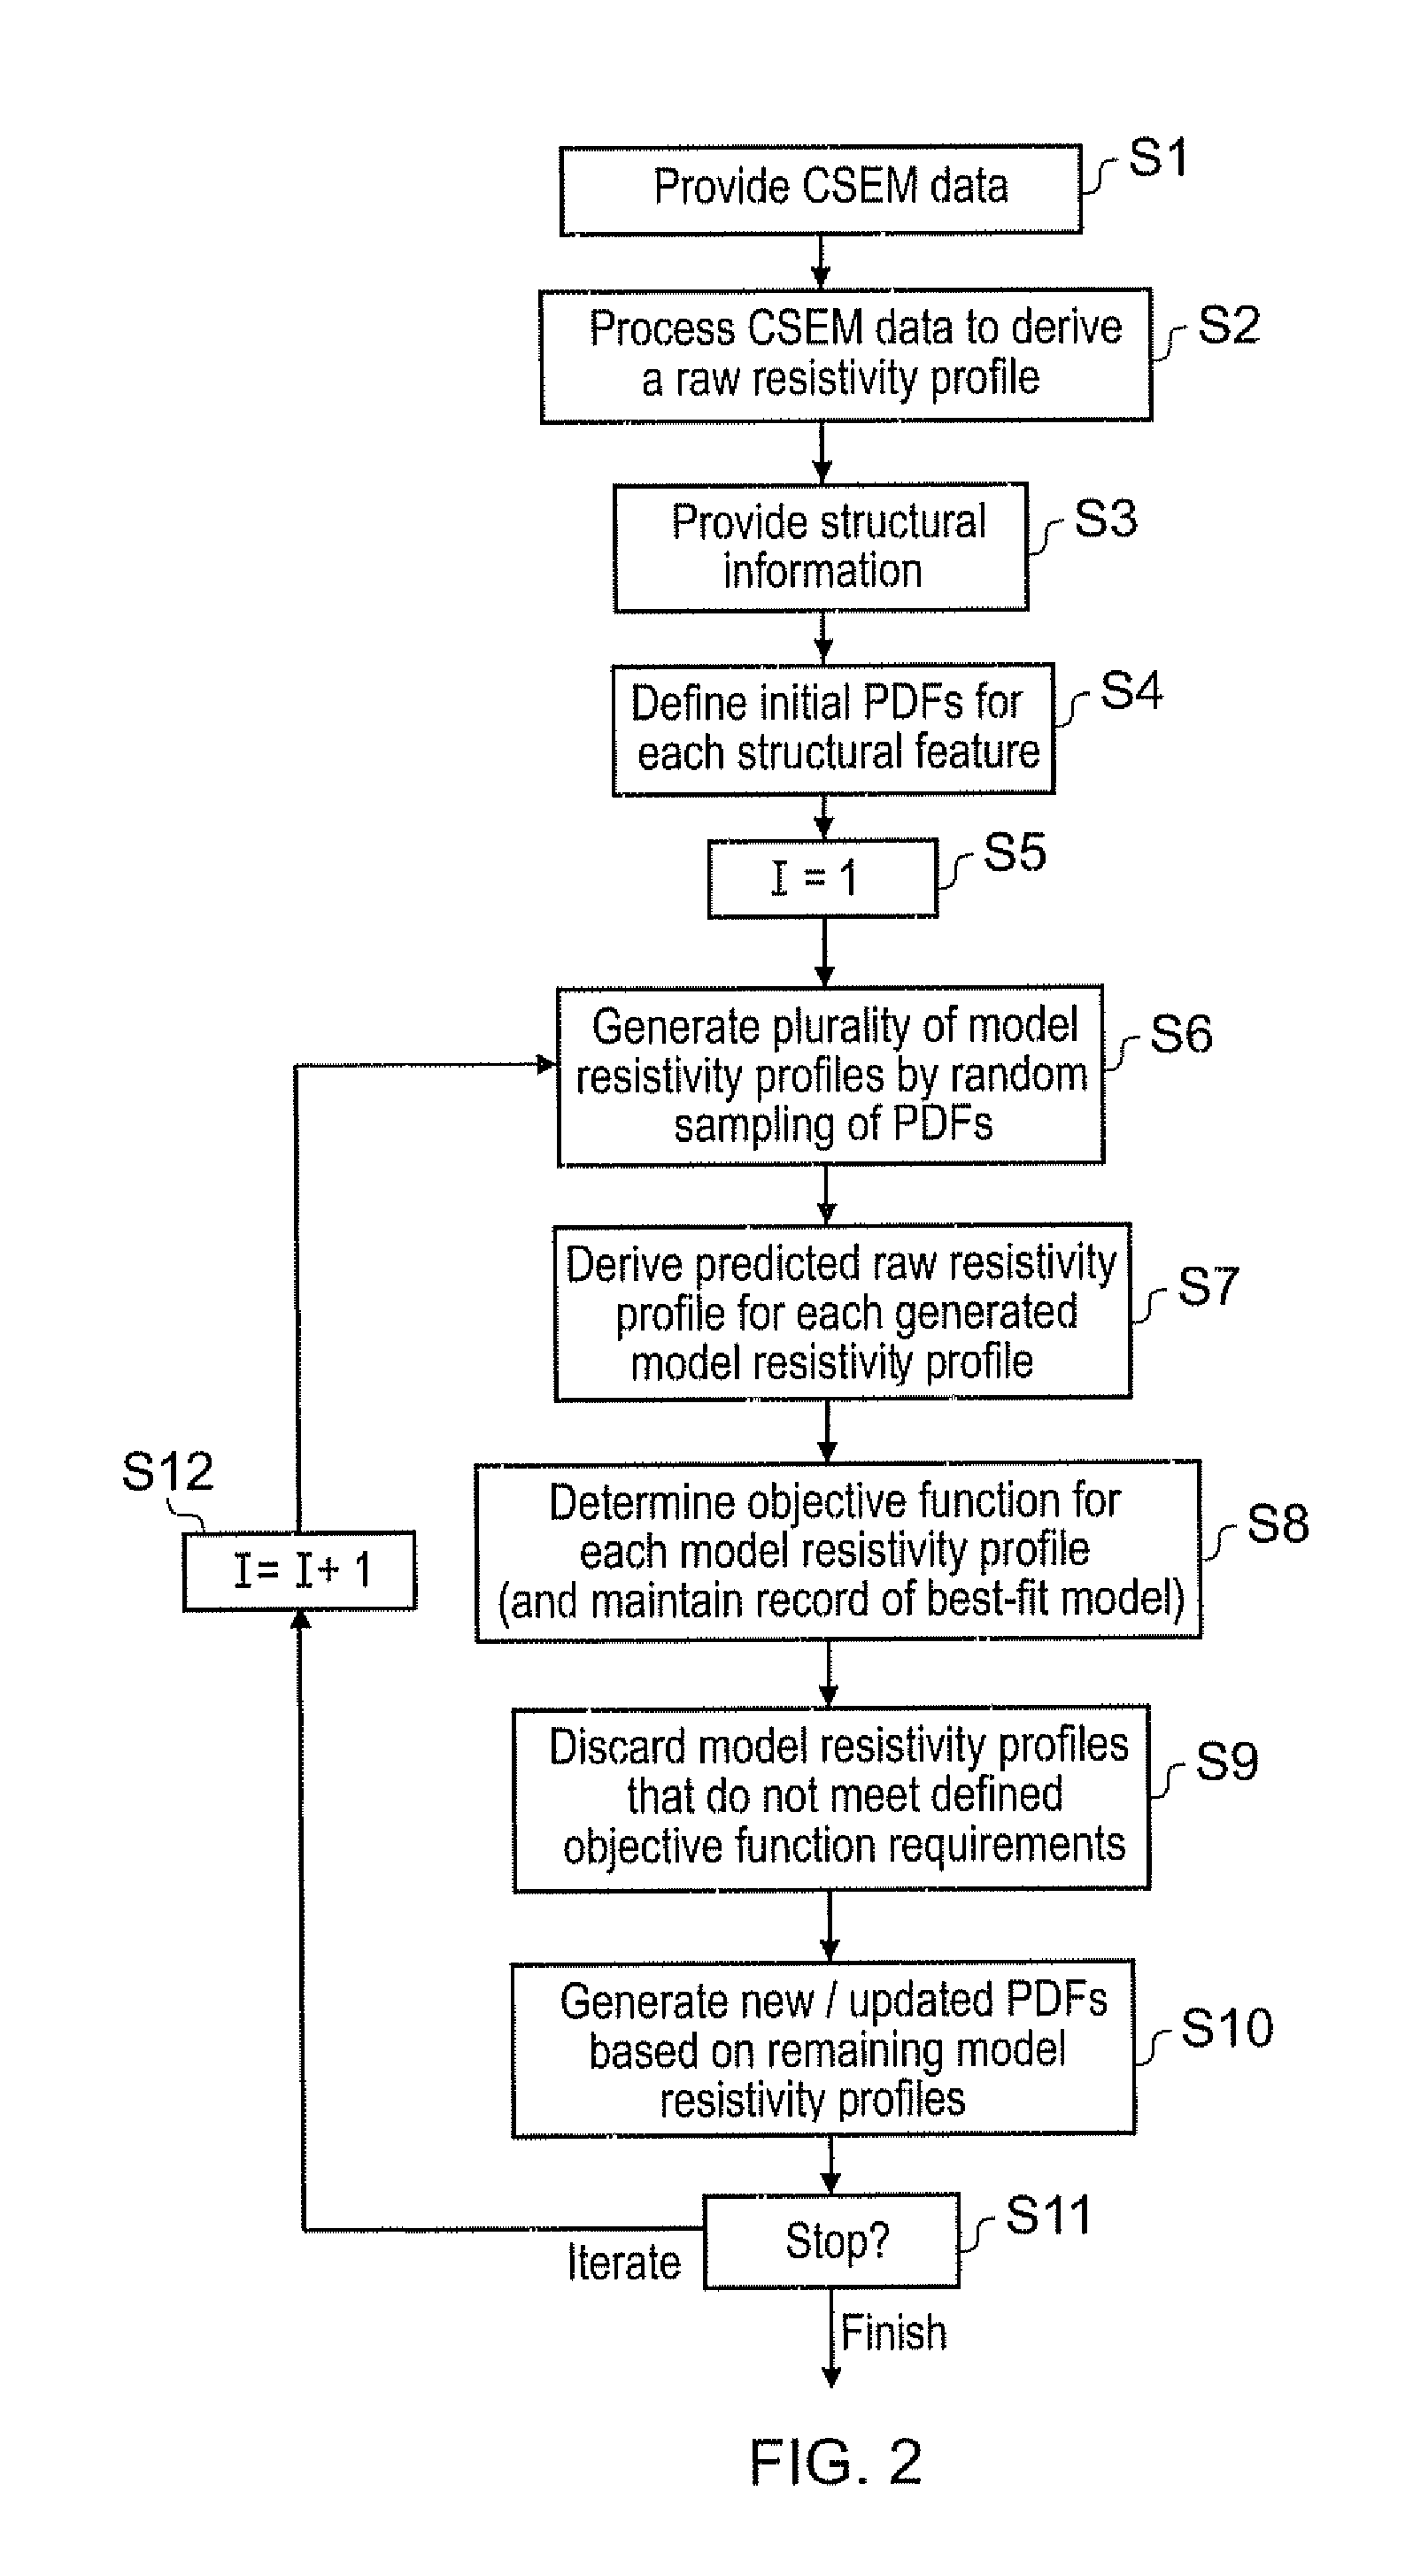
[0043]FIG. 2 is a flow chart schematically showing a method of processing CSEM data obtained from an area of interest according to an embodiment of the invention. The process is an iterative one, and may in some respects be considered as a modification of a simulated-armealing algorithm [8]. For the purposes of this example it will be assumed that the CSEM data are obtained from the region of the Nuggets-1 gas field for which data are shown in FIG. 1.

[0044]In Step S1, CSEM data from a survey of the area of interest are obtained, or otherwise provided. Thus Step S1 may include performing a CSEM survey to obtain the data, or otherwise providing data from elsewhere, e.g., historical data from an earlier CSEM survey of the area. The data may be conventional CSEM data.

[0045]In Step S2, the CSEM data are processed in accordance with any known technique, e.g. an inversion technique, to derive a subterranean resistivity profile. This initial profile may be referred to here as the raw resist...


PUM


Abstract

A method of analysing controlled source electromagnetic (CSEM) survey data to determine probability density functions (PDFs) for values of an electromagnetic parameter at locations in a subterranean region of interest is provided. Structural features in the subterranean strata are identified, e.g. from seismic survey data. An initial PDF for values of the electromagnetic parameter is then assigned to each feature. Models lo specifying values for the parameter in each structural feature are generated by sampling the PDFs. A subset of the models are deemed acceptable based on an acceptance criterion. The PDF for each feature is modified based on values for the parameter in the subset of accepted models to generate replacement PDFs for each feature. The process may be iterated a number of times to generate final PDFs for values of the electromagnetic parameter in the structural features identified in the subterranean region of interest.

Description

BACKGROUND ART[0001]The invention relates to geophysical surveying. More particularly the invention relates to geophysical surveying for resistive and / or conductive bodies. Such bodies might, for example, comprise oil, gas, methane hydrates etc. or other hydrocarbon reserves, or subterranean salt bodies.[0002]Seismic survey techniques are well known and provide well established methods for identifying structural features in subterranean rock strata, e.g., distinct layers and potential fluid reservoirs. Seismic techniques primarily distinguish between different subterranean structures on the basis of their different mechanical properties. Thus, for example, in the context of hydrocarbon exploration, seismic techniques are generally able to readily identify relatively low-density voids which might potentially contain hydrocarbon within the rock strata. Seismic techniques are able to identify such structures with relatively good spatial resolution. For example, it would not be unusual ...

Claims


Application Information

Patent Timeline
Patent Type & Authority Applications(United States)
IPC IPC(8): G01V3/38
CPCG01V3/12G01V11/00G01V3/38
Inventor MACGREGOR, LUCYHARRIS, PETER
Owner PGS GEOPHYSICAL AS
Why Eureka
Try Eureka