Probabilistic framework for the highly efficient correlation of call chains with hardware events

a probability framework and call chain technology, applied in the field of program profiling, can solve the problems of large overhead, limited or non-existent cache misses or memory use, and the choice of detailed profiling of other hardware resources, and achieve the effect of reducing overhead

Active Publication Date: 2010-01-21
IBM CORP
View PDF9 Cites 30 Cited by
  • Summary
  • Abstract
  • Description
  • Claims
  • Application Information

AI Technical Summary

Benefits of technology

[0011]In this disclosure, a highly efficient probabilistic method for profiling that provides detailed resource usage information indexed by a full call chain and time is presented. An analytical framework with error estimates permits analyses of different profiling scenarios. This probabilistic approach was employed to implement a memory profiling tool that adds minimal overhead and does not require recompilation or relinking. A tool in accordance with the present principles provides the memory use Mψ(t) of each call chain ψ over a time line. Experimental results confirm that execution time and memory overhead is less than 10% of the unprofiled, optimized execution.

Problems solved by technology

While efficient tools for the profiling of execution time are available, the choices for detailed profiling of other hardware resources, e.g. cache misses or memory use are very limited or non-existent.
Location based sampling can provide very misleading results.
While providing more accurate results, it requires the instrumentation of all function calls analogous to Gprof and book-keeping to track the history, which causes significant overhead.
This is clearly insufficient to localize bottlenecks in large applications.
The strategy of sampling at periodic time intervals is not applicable to profiling of memory use by code location or call chain.
The performance impact of sampling the state of the heap is too costly and significant errors are possible due to the lack of correlation between memory use and execution time.
If only the code location is sampled, the results can be misleading.
The recording of entire call chains improves the profiling information, but causes even more overhead.
It is difficult to hit the interesting spots in large applications that run for many hours.
The allocation / deallocation category often increases the runtime of a program by an order of magnitude and also increases the memory use of the application by a factor of two or more rendering it useless for very large applications.
These tools investigate memory access errors and other problems in small and short program runs, but they are not well suited for the investigation of the memory use of application runs that already require significant time and which already push the memory capacity of a system to its limit without profiling.
Another common approach is simulation based on code or program traces, which allows detailed analysis of applications but causes far too much execution time overhead for the performance analysis of very large applications.
This is not applicable for memory usage due to the lack of correlation of memory usage with execution time or execution frequency.
While memory leaks persist after creation, memory allocations have a limited life time.
While efficient tools for the profiling of execution time are available, the choices for detailed profiling of other hardware resources, e.g., cache misses or memory use are very limited.

Method used


Image

  • Probabilistic framework for the highly efficient correlation of call chains with hardware events
  • Probabilistic framework for the highly efficient correlation of call chains with hardware events
  • Probabilistic framework for the highly efficient correlation of call chains with hardware events

Examples


Embodiment Construction

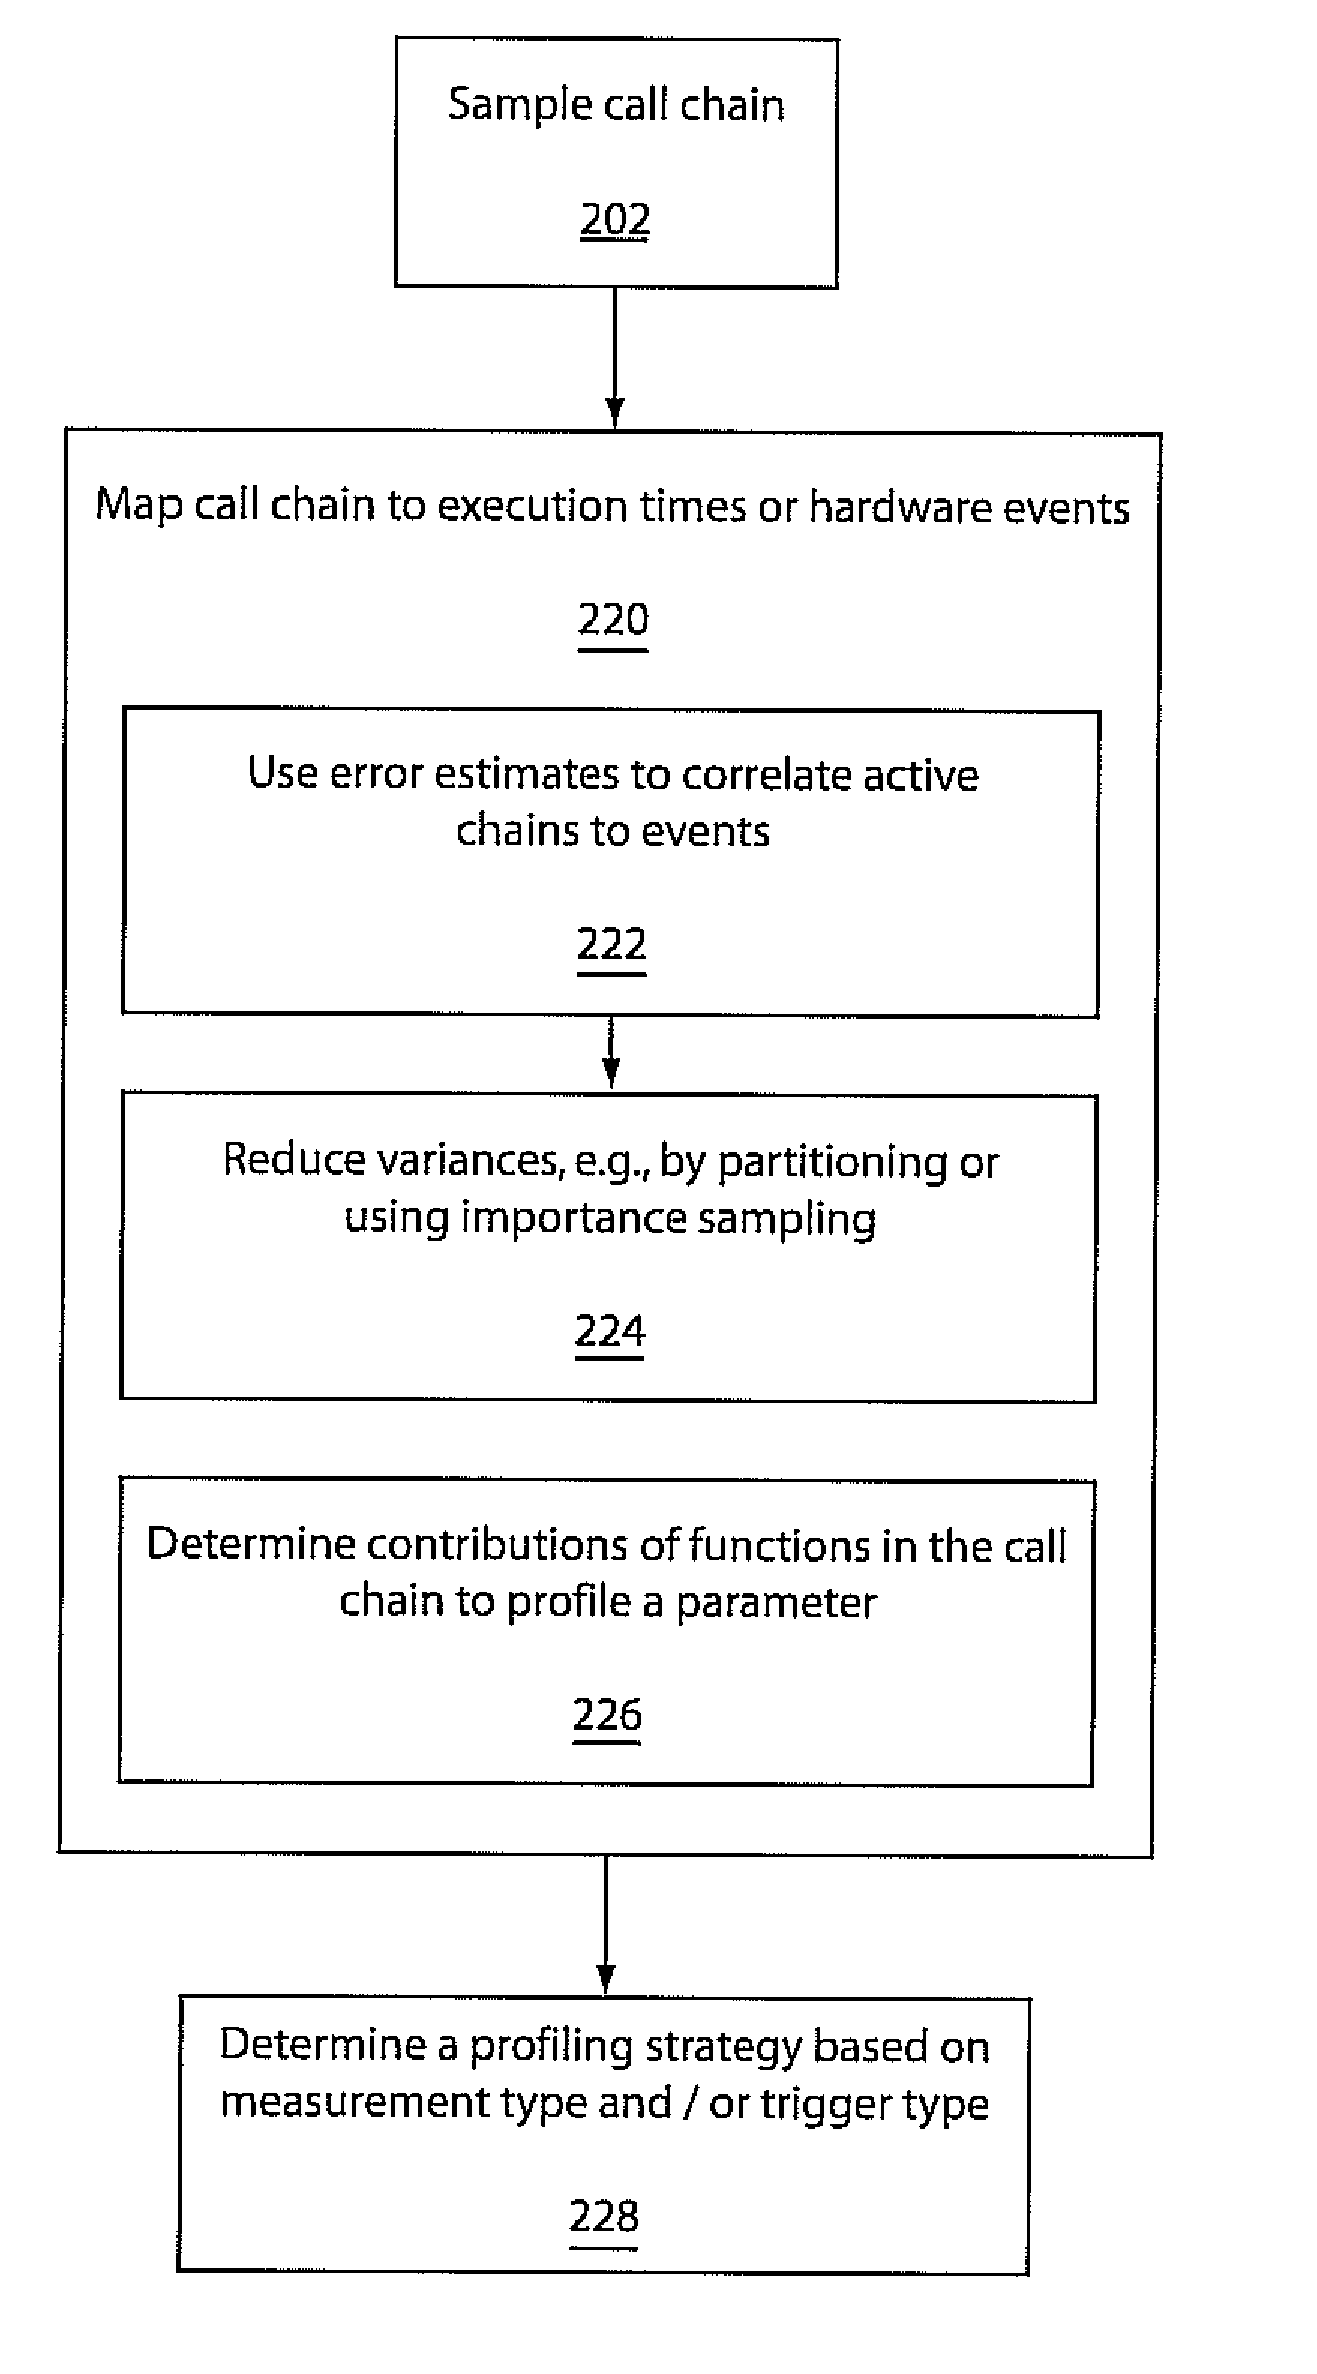
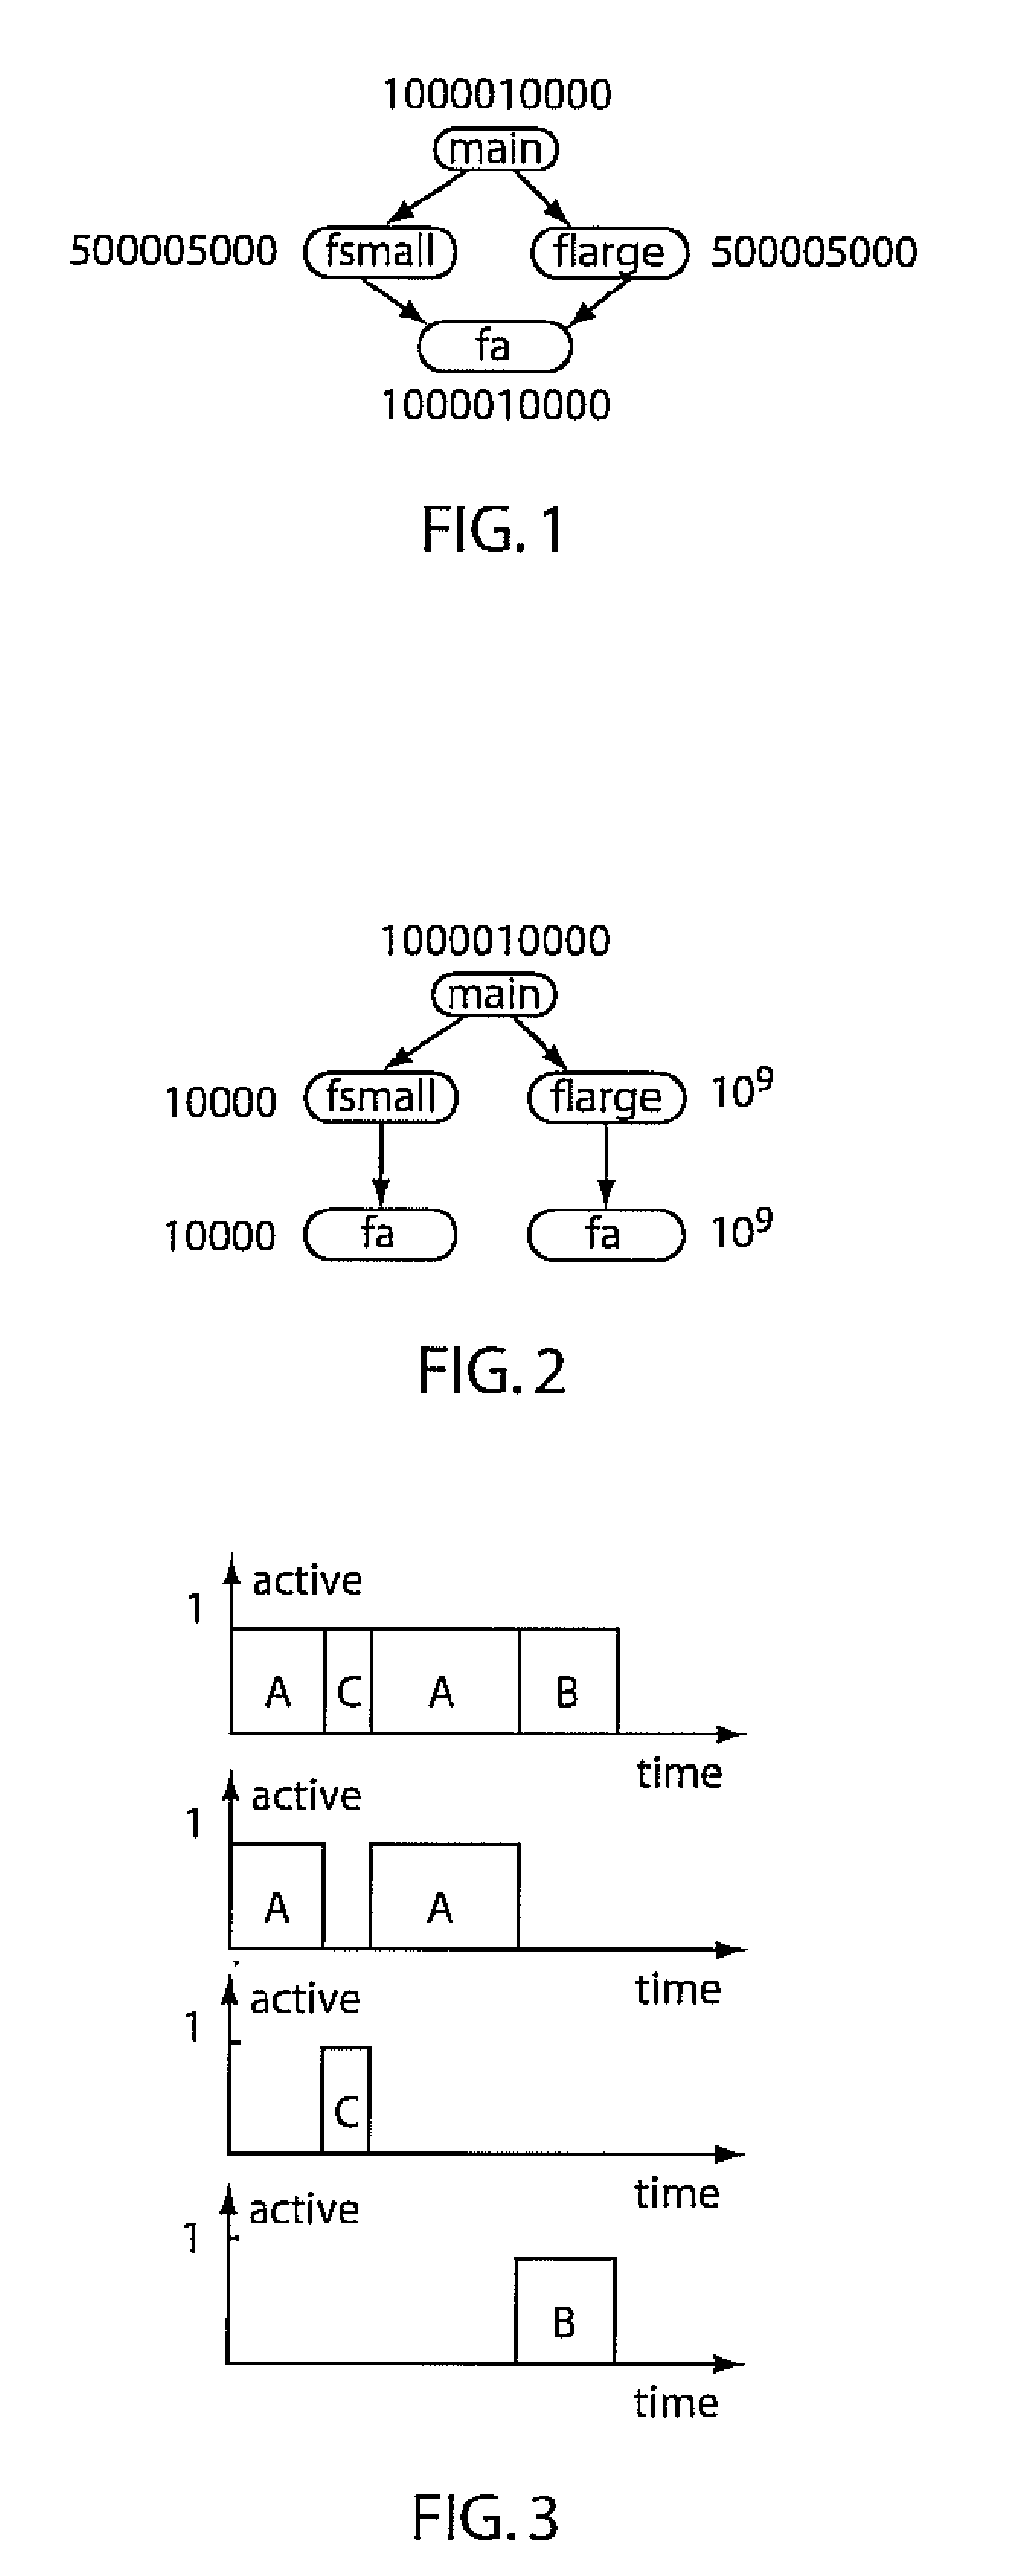
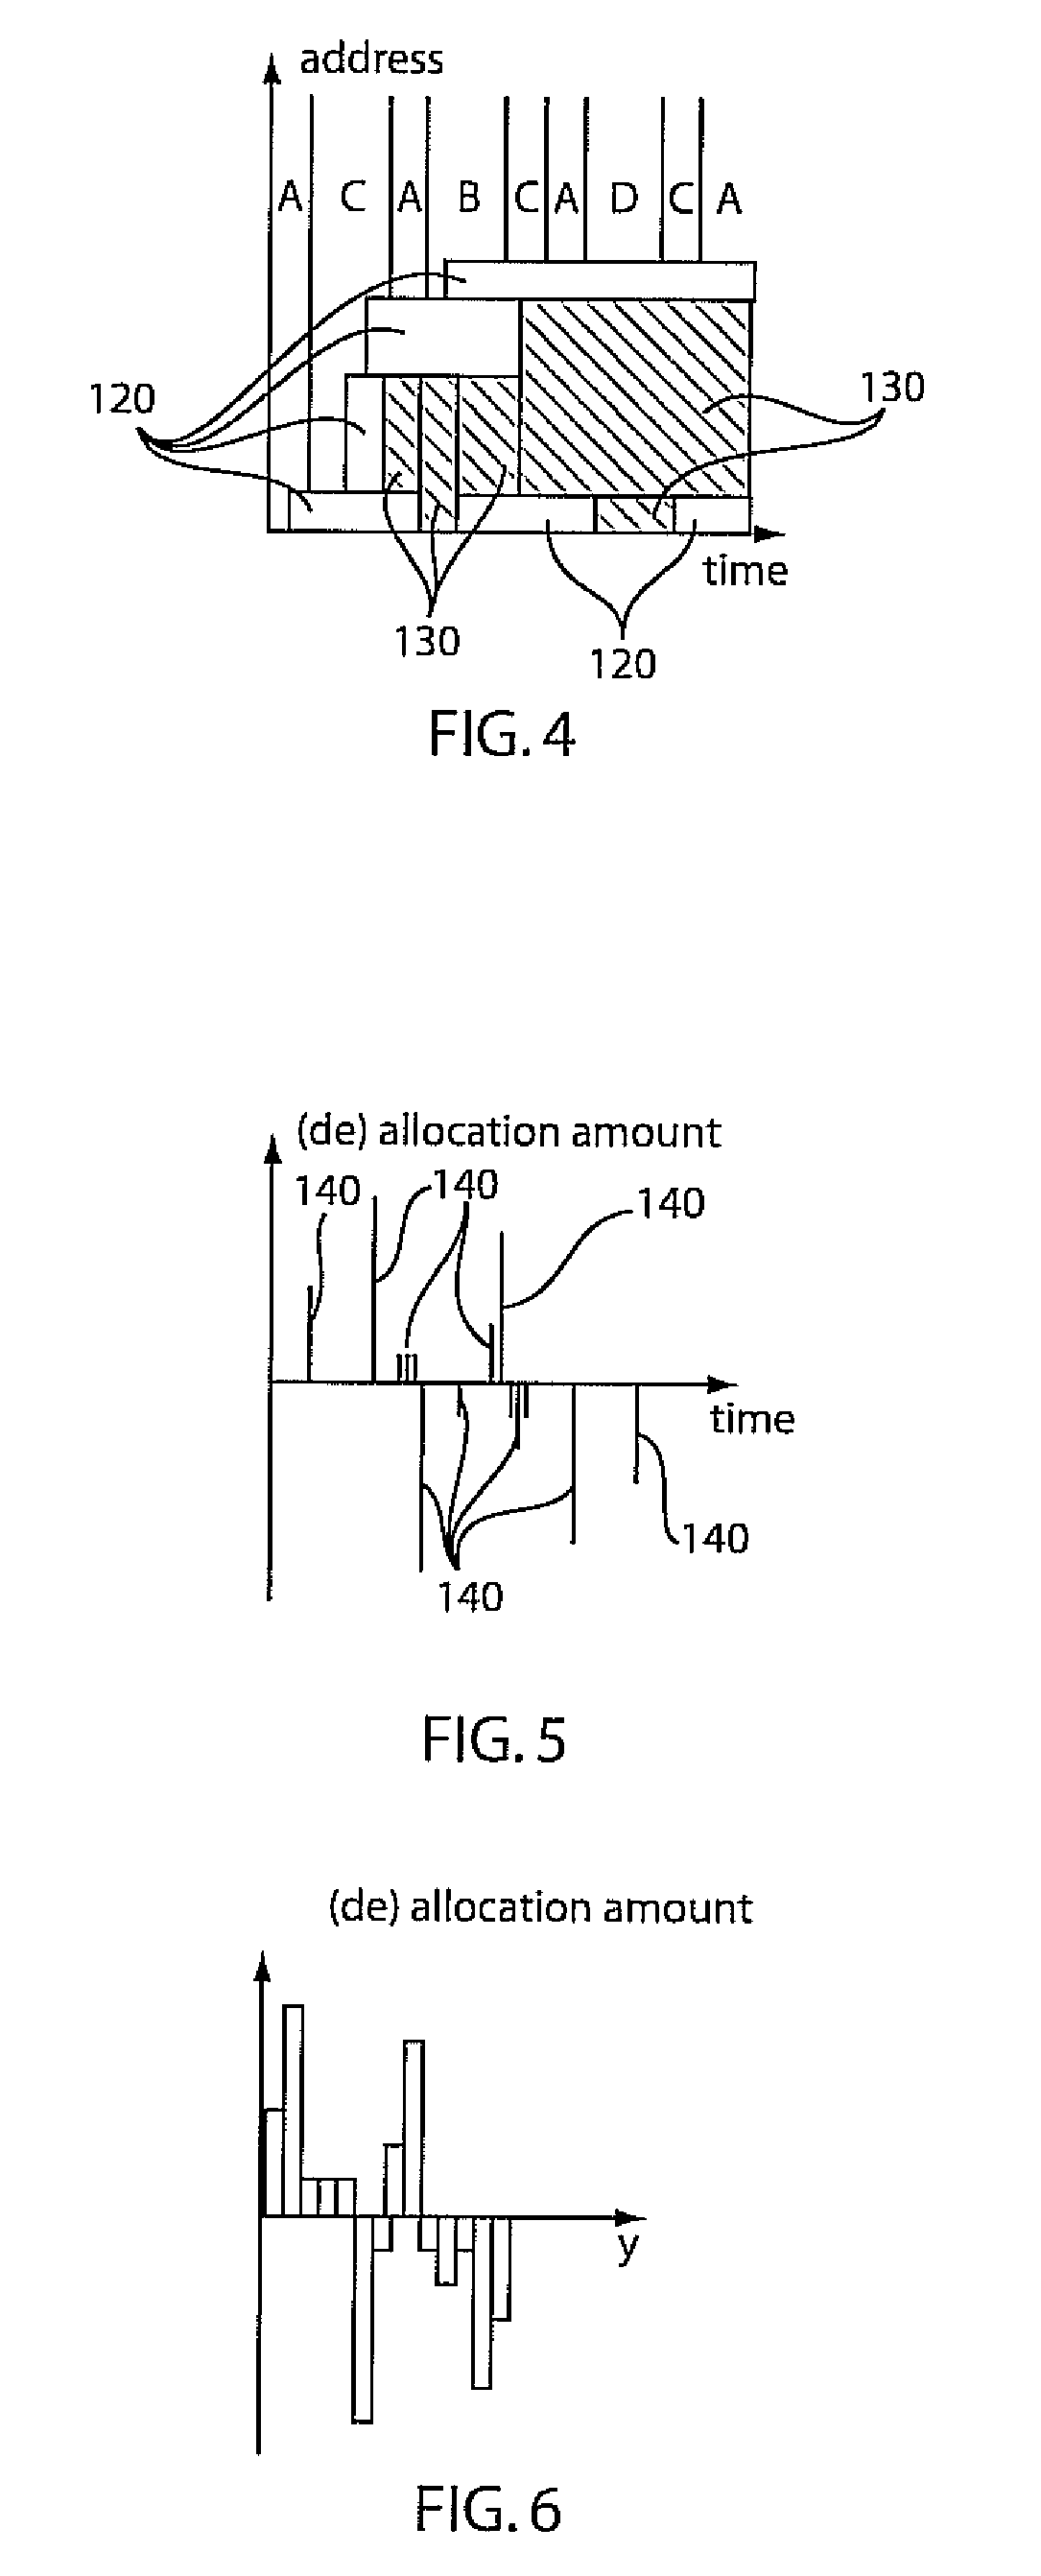
[0026]Highly efficient probabilistic systems and methods for profiling are provided that include detailed resource usage information indexed by full call chain and time. A call chain is the history of function calls formed when one method calls another method. An analytical framework is provided with estimates of the accuracy for different profiling scenarios. This probabilistic approach is applicable to implement a memory profiling tool that adds minimal overhead and does not require recompilation or relinking. The tool provides the memory use of each call chain over a time line. An upper bound can be provided for the memory overhead compared to an unprocessed run, and experimental results confirm that execution time and memory use overhead is less than 10% of the unprofiled, optimized execution.

[0027]A novel probabilistic profiling approach for general resource use is provided that permits the creation of profiling tools with very small relative overhead, e.g., a small ratio of th...


PUM


Abstract

A system and method for correlation of resources with hardware events includes event driven sampling a call chain of functions at to determine when functions of the call chain are active. The call chain is mapped to execution times based upon a probabilistic integration of the functions such that when portions of the call chain are active, resources associated with call chain activity are correlated with hardware events.

Description

BACKGROUND[0001]1. Technical Field[0002]The present invention relates to program profiling and more particularly to a system and method for profiling resource use with correlated hardware events.[0003]2. Description of the Related Art[0004]Profiling is an essential and widely used technique to understand the resource use of applications. While efficient tools for the profiling of execution time are available, the choices for detailed profiling of other hardware resources, e.g. cache misses or memory use are very limited or non-existent.[0005]There is a rich body of literature on sampling and profiling. Typical time profilers sample periodically the sub-routine or code line and instrument each function call. The function call counts are used to reconstruct a call graph. Location based sampling can provide very misleading results. One approach gathers more context by keeping track of the call history. While providing more accurate results, it requires the instrumentation of all functi...

Claims


Application Information

Patent Timeline
Patent Type & Authority Applications(United States)
IPC IPC(8): G06F9/45G06F9/44
CPCG06F11/3409G06F11/3447G06F11/3466G06F2201/88G06F2201/81G06F2201/86G06F2201/865G06F11/3636
Inventor FINKLER, ULRICH ALFONS
Owner IBM CORP
Why Eureka
Try Eureka