
System and method to assess signal similarity with applications to diagnostics and prognostics

a signal similarity and diagnostic technology, applied in the field of system and method to assess signal similarity with applications to diagnostics and prognostics, can solve the problems of compromising the robustness of such technology, the system and technology developed in these fields and others are often quite complex, and the traditional model often fails to accurately describe the system behavior

Inactive Publication Date: 2010-10-07
CLEMSON UNIVERSITY
View PDF24 Cites 13 Cited by
  • Summary
  • Abstract
  • Description
  • Claims
  • Application Information

AI Technical Summary

Benefits of technology

[0008]Objects and advantages of the present invention will be apparent to one of skill in the art upon careful review of the disclosure and / or practice of the subject matter. The objects and advantages include providing methods and systems for assessing the dynamic similarity of two or more dynamic systems. The diagnostic techniques enable system assessment without the need for mathematical models. The methodology also provides for customized error thresholds to tailor different levels of signal equality and comparison. Still further, the techniques may be applied to a wide spectrum of potential applications, including system fault diagnosis and similarity assessment of two time series arising in engineering and non-engineering applications (e.g., meteorological, biological, geological, astrological, and others).
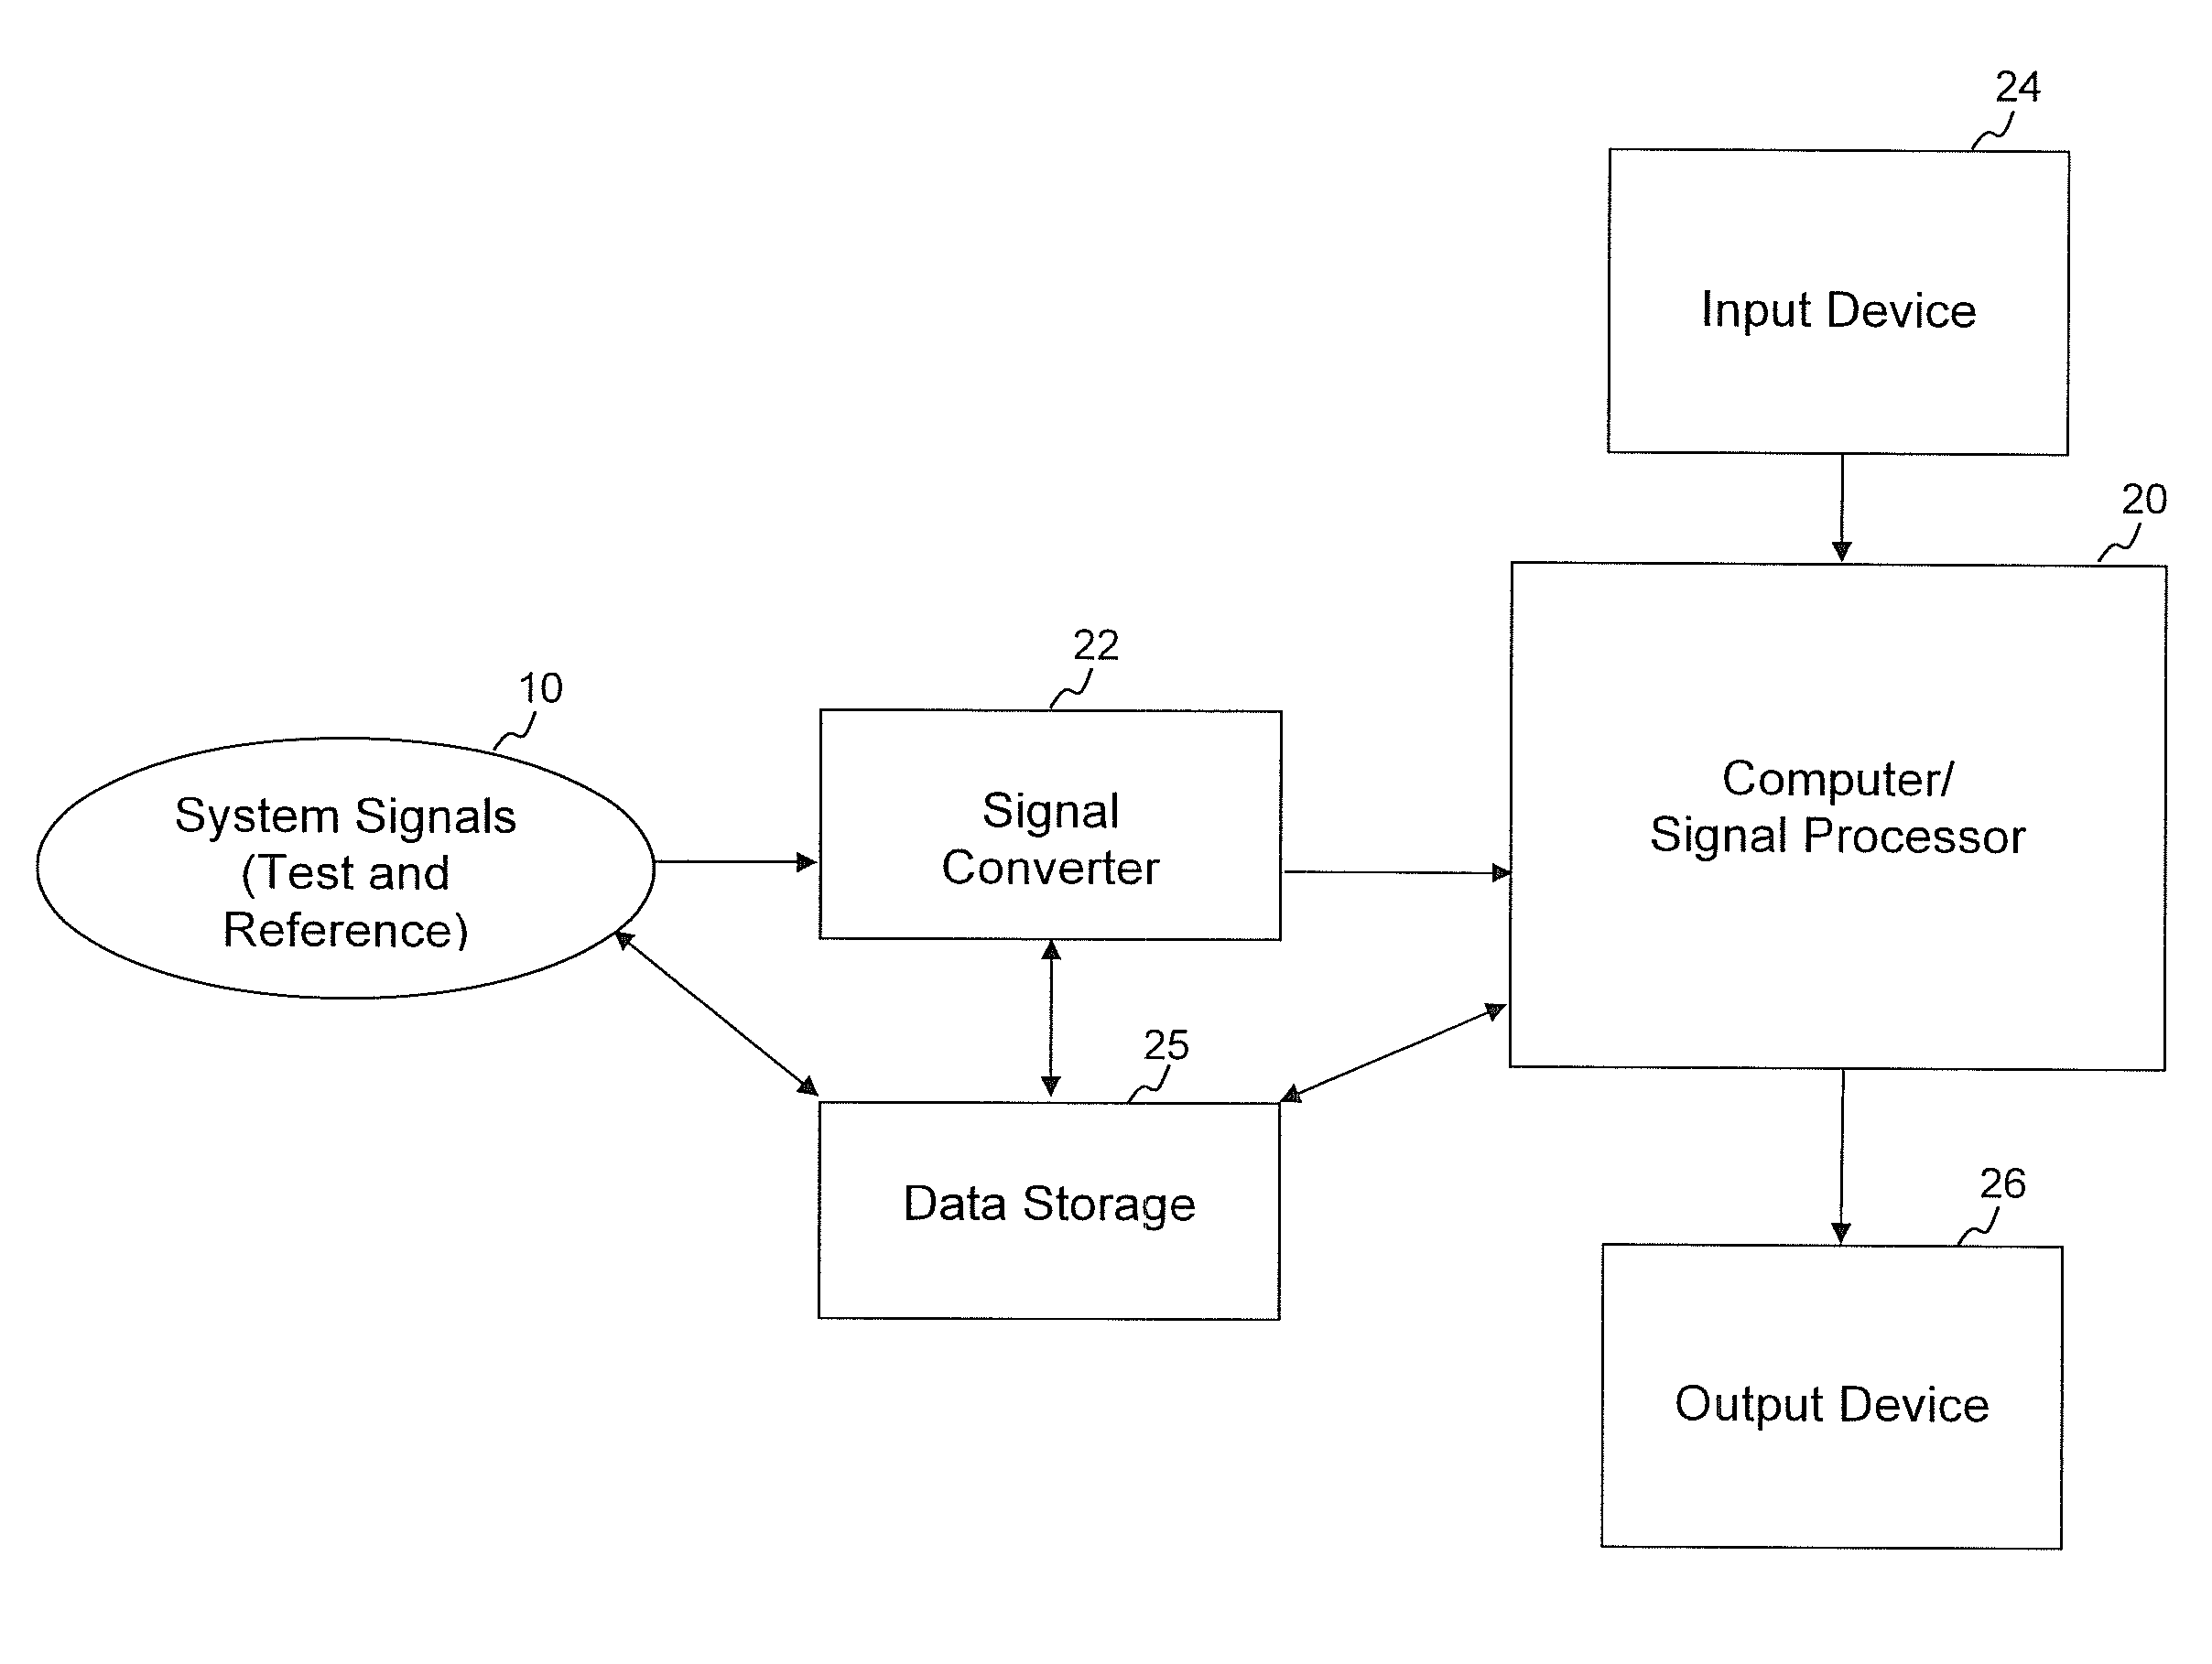
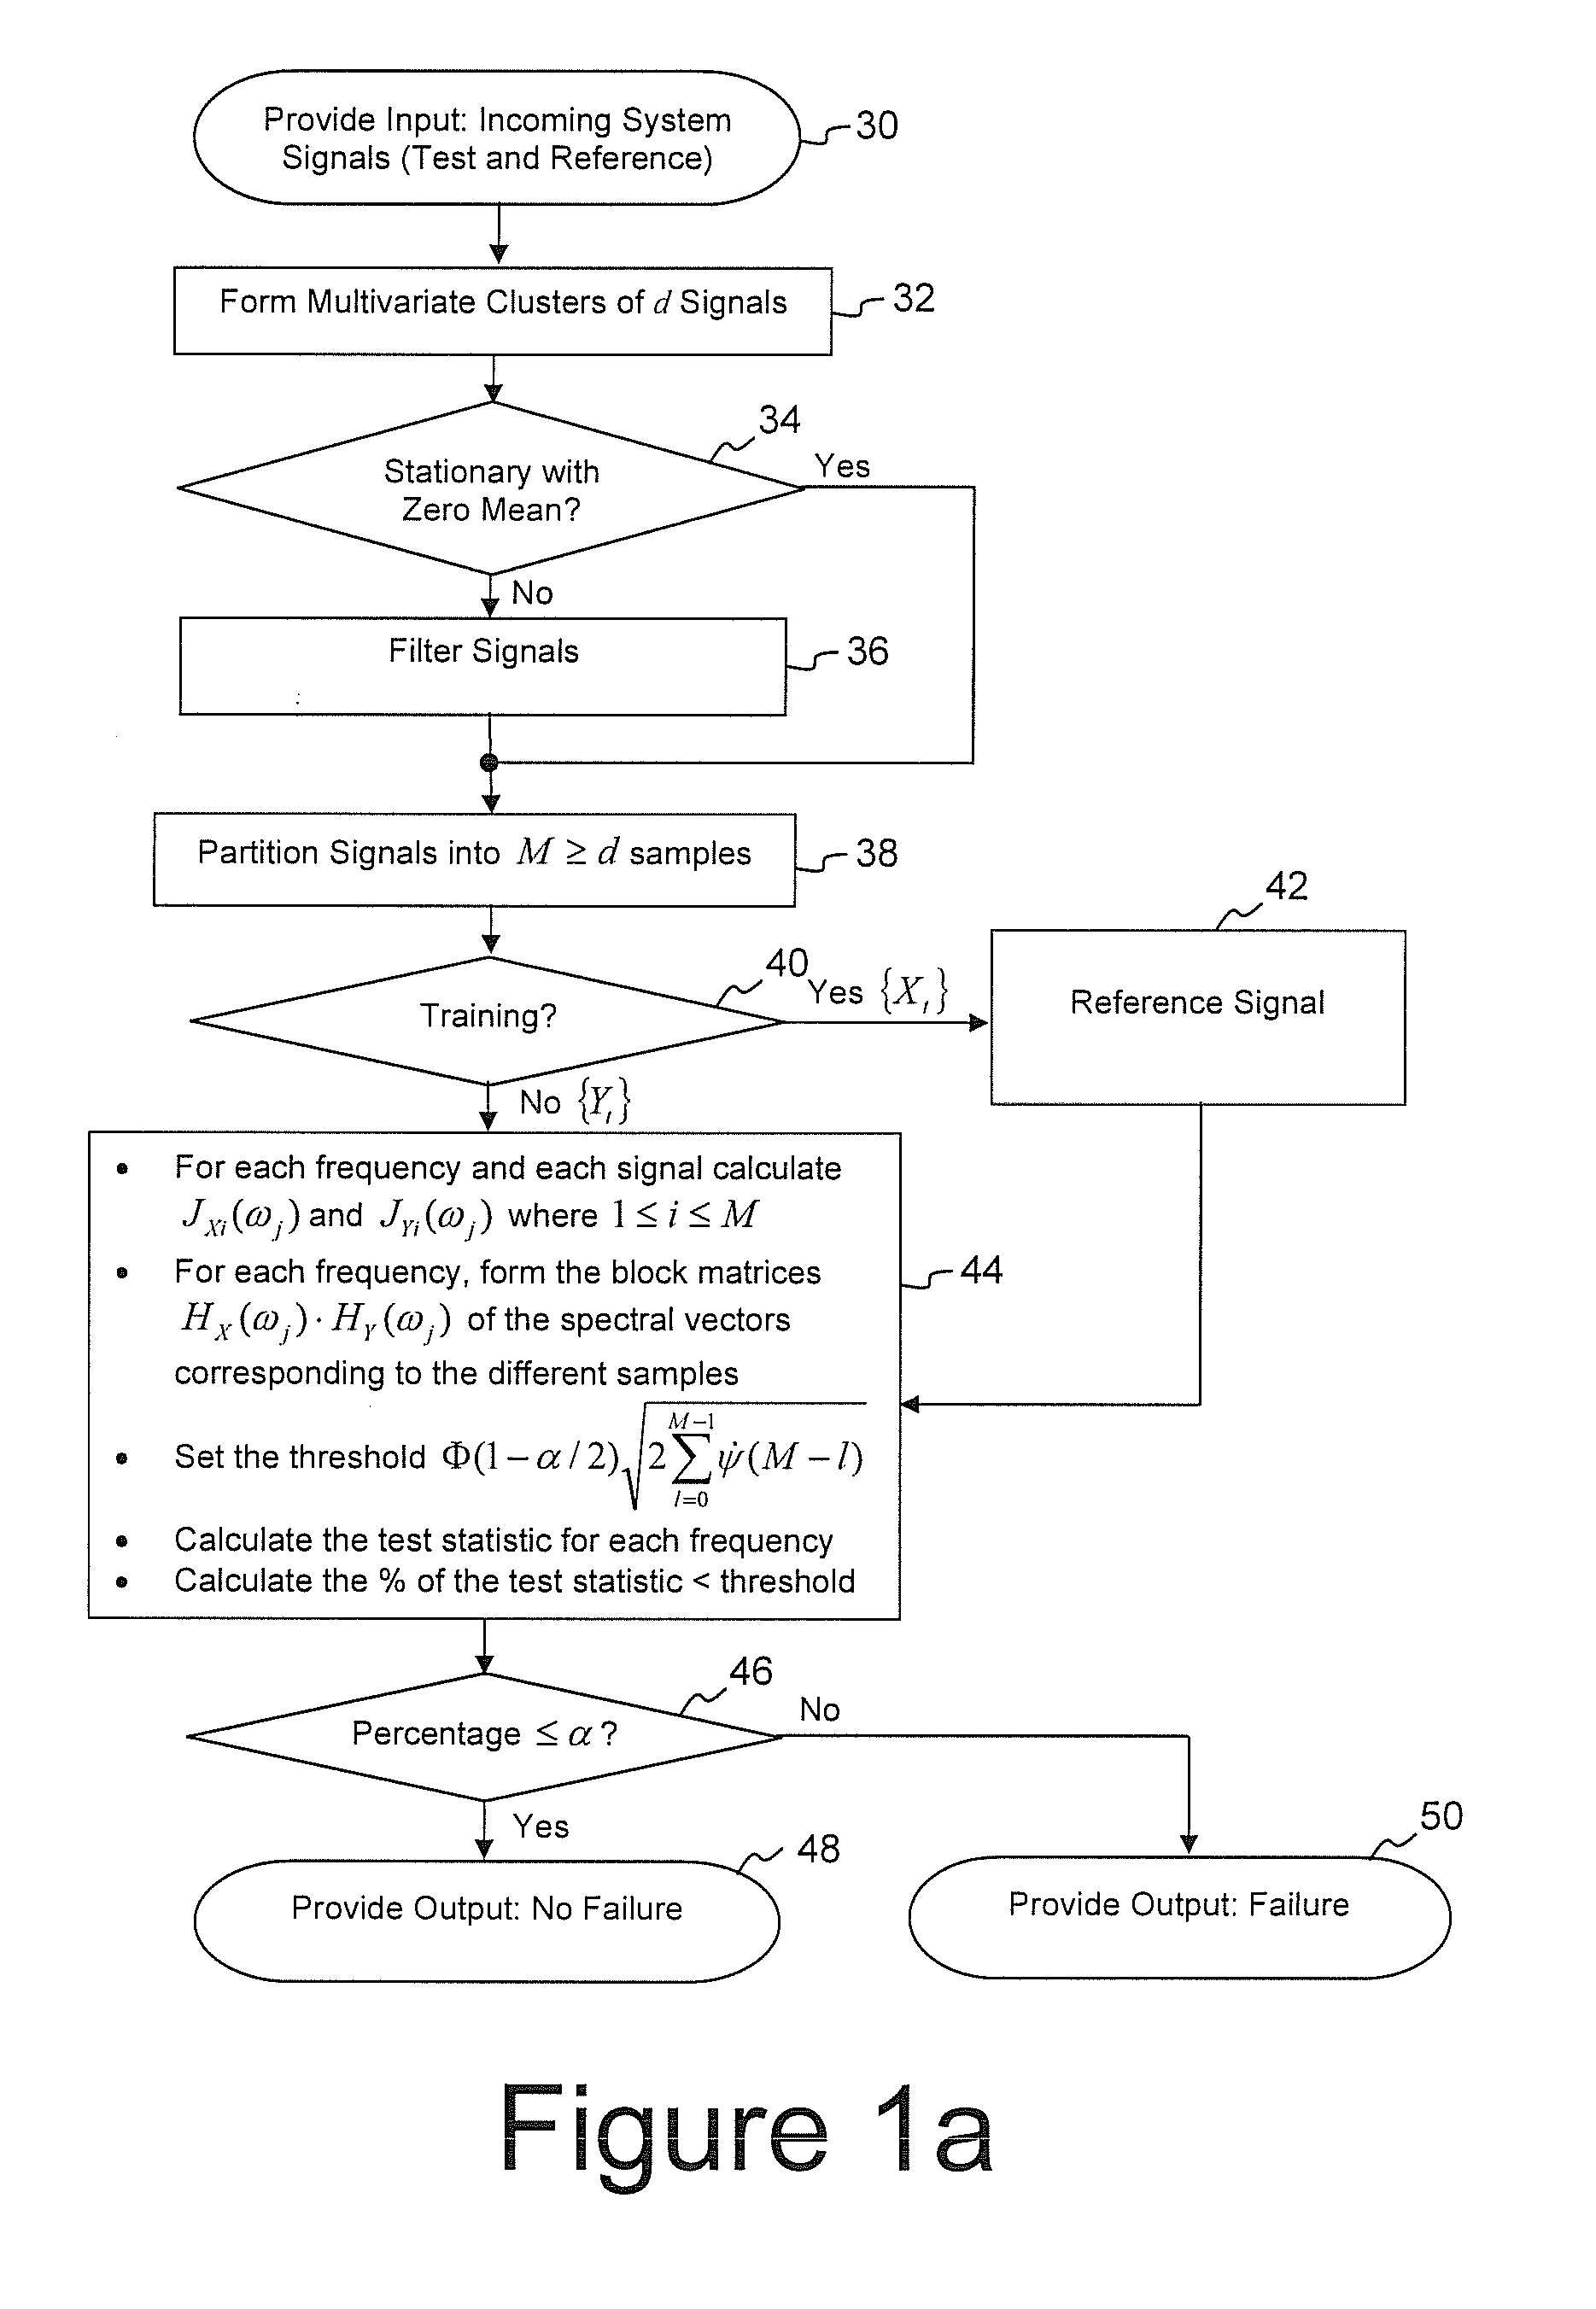
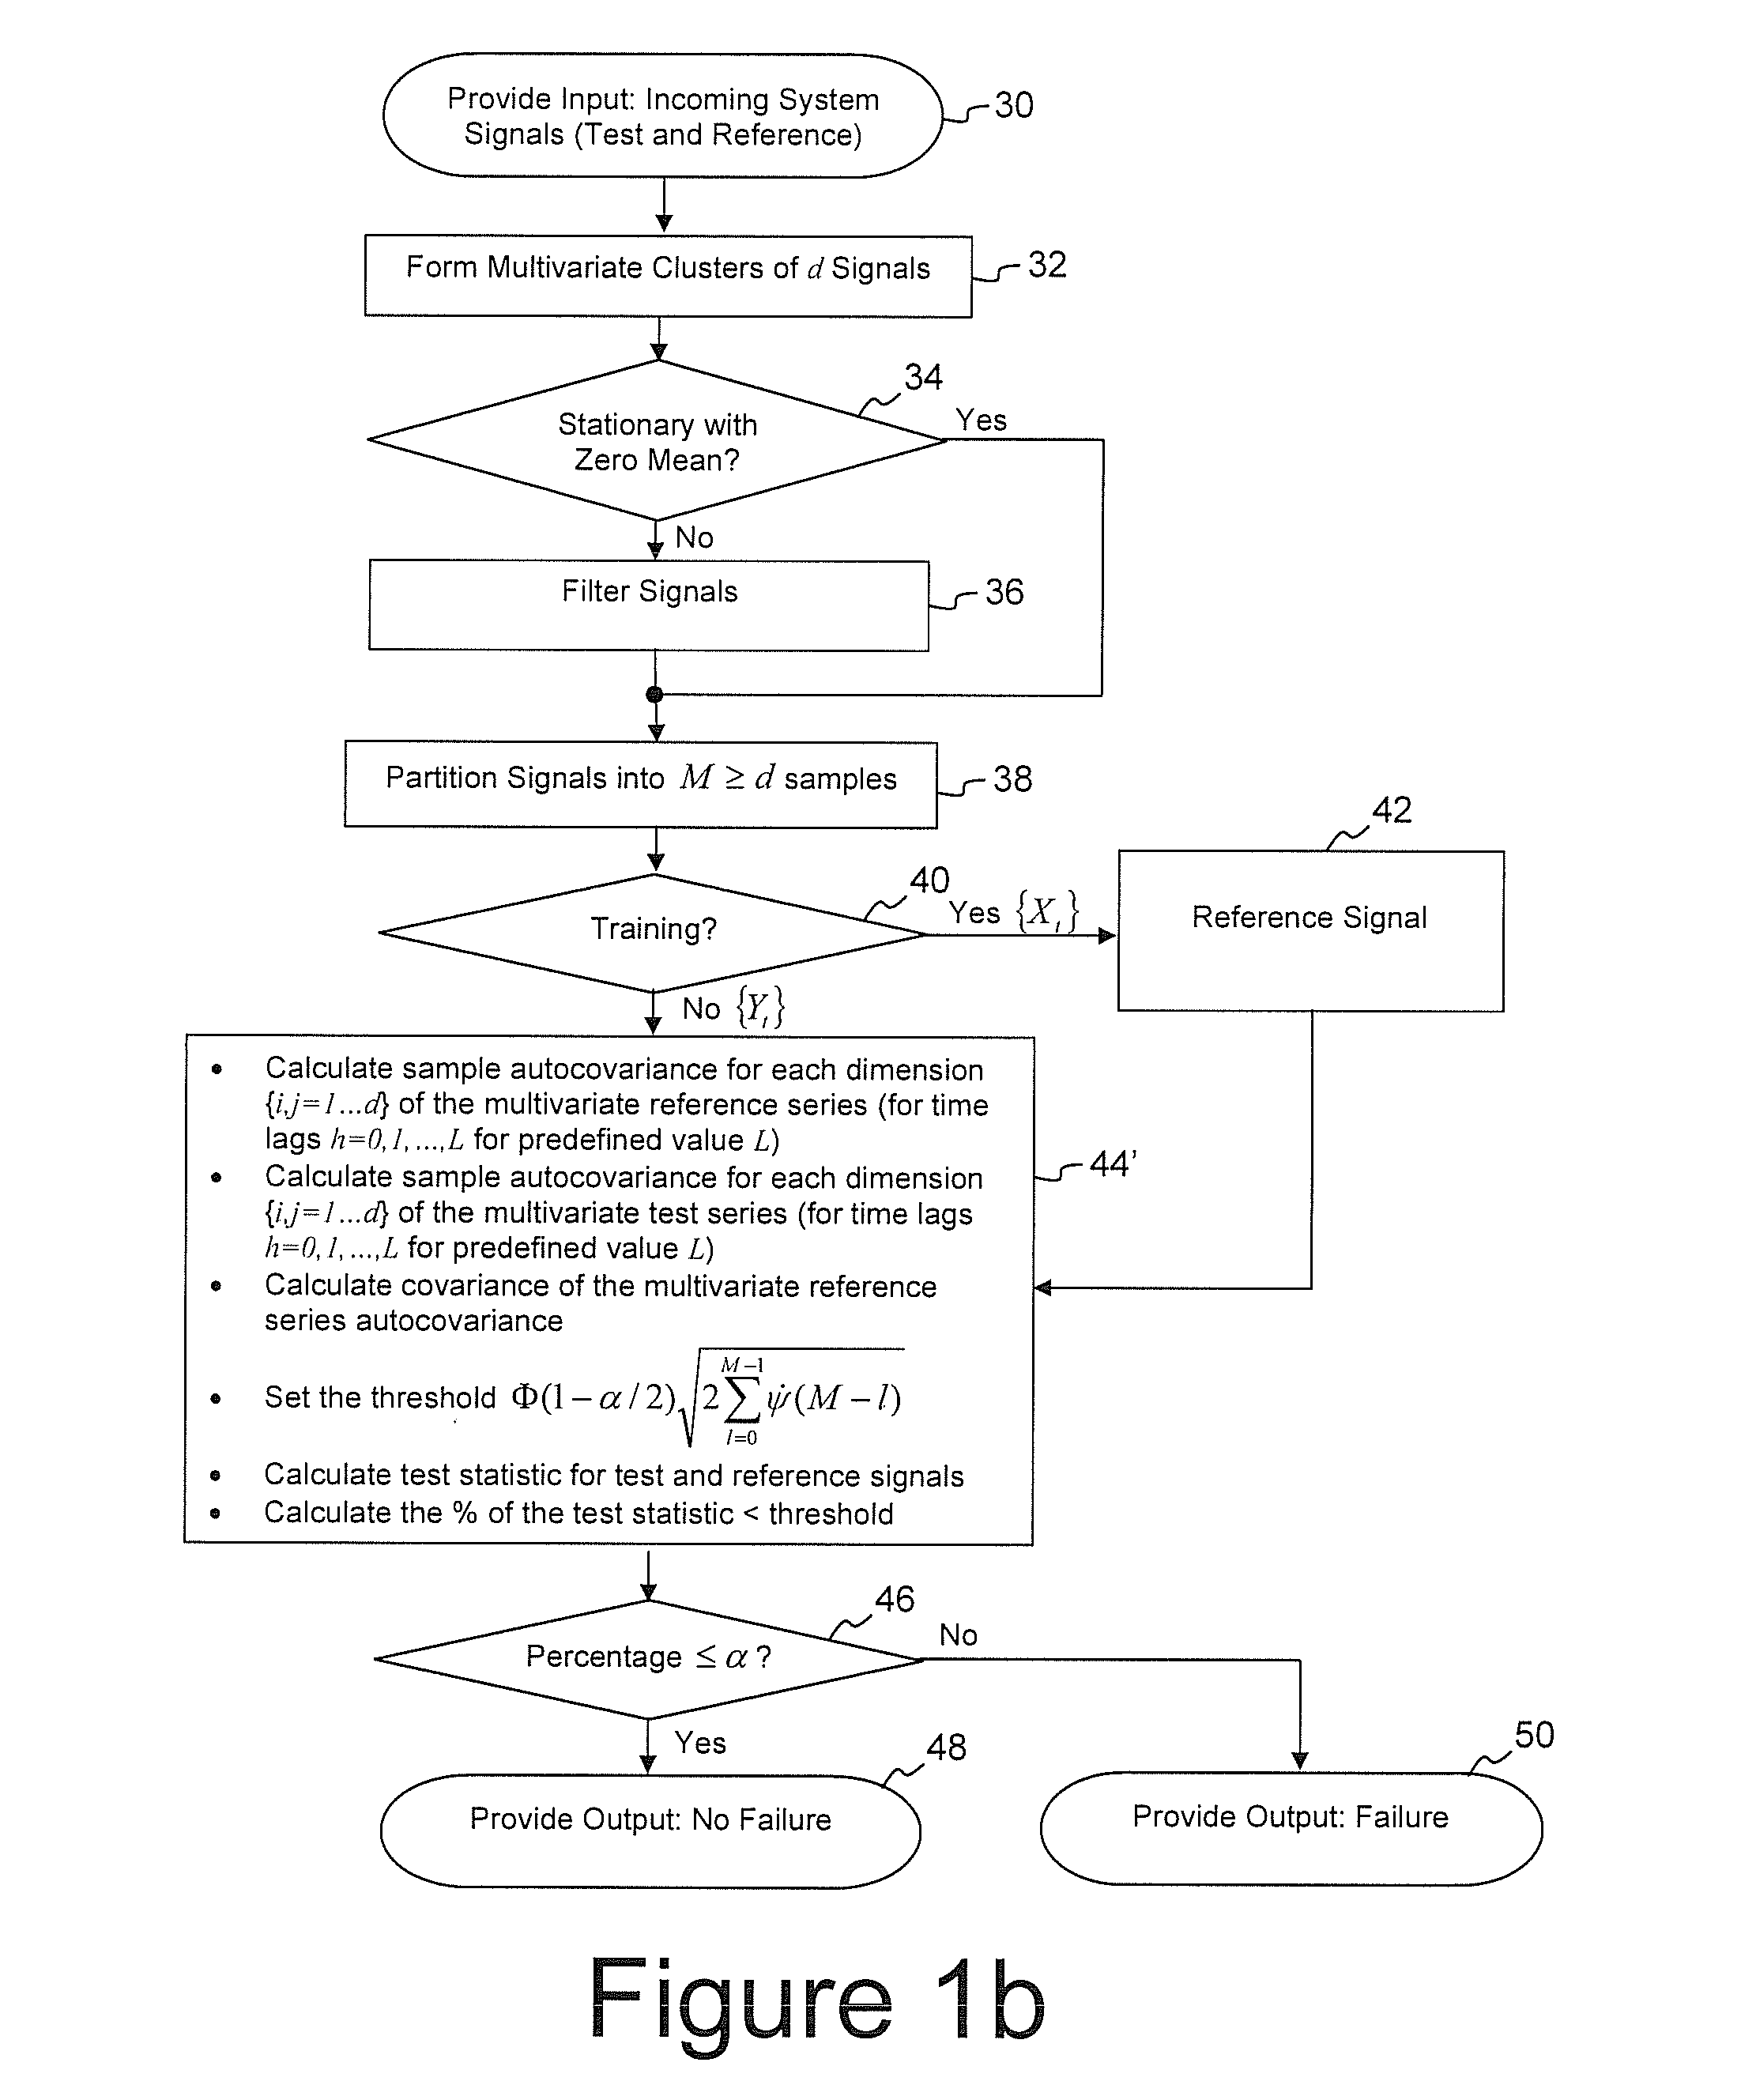
[0009]Signal processing technology for assessing dynamic system similarity for fault detection and other applications is based on time- and frequency-domain time series analysis techniques and compares the autocorrelation structure of a test and reference signal series. The test and reference signals may first be subjected to optional similar pre-processing to help guarantee signal stationarity. Pre-processing, if applied, may include formation of multivariate signal clusters, filtering and sampling. If frequency-domain analysis is employed, multivariate periodograms are then calculated for each signal series. If time-domain analysis is employed, auto covariance functions are calculated for each signal series. Time-domain or frequency-domain test statistics are computed and assessed to determine the equality of the test and reference signals. When the difference between sample autocovariance functions or periodograms of such signals exceeds a preselected threshold value, fault detection signals or other diagnostic outputs are provided to a user.

Problems solved by technology

The systems and technologies developed in these fields and others are often quite complex, thus requiring modeling techniques to monitor and analyze system performance.
The absence of a redundant reference in model-free diagnostic techniques can sometimes compromise the robustness of such technology.
Several issues have been identified as potential concerns with presently existing model-free and model-based diagnostic techniques.
In general, some traditional models often fail to accurately describe the system behavior due to measurement uncertainties, nonlinear effects and oversimplified assumptions.
Diagnostics did not fully address the analogies between conventional dynamic concepts (e.g., impulse response and stability) and major stochastic properties such as autocovariance and stationarity.

Method used


Image

  • System and method to assess signal similarity with applications to diagnostics and prognostics
  • System and method to assess signal similarity with applications to diagnostics and prognostics
  • System and method to assess signal similarity with applications to diagnostics and prognostics

Examples


example 1

[0057]The disclosed system diagnostics technology was applied to monitor the fuel flow rate signals for a Mercury® brand stationary gas turbine, such as manufactured and sold by Solar Turbines Incorporated, a company owned by Caterpillar, which is typically used to supply peak load shaving power to a facility during periods of high demand. Operation of this exemplary turbine has an average of six hours continuous rating per run, with a maximum rating of 4.5 MW. The Mercury 50 turbine is a stand-alone turbine which has an extensive array of sensors that may be monitored in real-time. A communication interface was established between the turbine controller and a data acquisition station.

[0058]Two experimental faults were introduced to the Mercury 50 turbine. A first fault was a partial blockage of the oil cooler air passage that mimics possible blockage caused by slug formation. The partial blockage began after approximately two hours of normal operation and continued for another seve...

example 2

[0060]The above time-domain processing techniques as most particularly described with reference to FIGS. 1b and 2b were used to study monthly weather patterns of two nearby cities, namely Athens and Atlanta, Ga., in the United States. Athens and Atlanta both lie in the Piedmont region of North Georgia, approximately seventy-five miles apart. Local folklore states that the two towns enjoy similar weather. Actual operational similarity of the weather patterns can be analyzed using the disclosed techniques, which were particularly applied to temperature and precipitation analysis for the two cities.

[0061]FIGS. 9a and 9b display monthly average temperatures for Athens and Atlanta, respectively. The temperatures are averaged over all days in each month for both stations during a time period inclusive of January 1950 until December 2003. There are N=648 observations for each series. FIGS. 10a and 10b respectively display the total monthly precipitation at the Athens and Atlanta stations o...


PUM


Abstract

Signal processing technology for assessing dynamic system similarity for fault detection and other applications is based on time- and frequency-domain time series analysis techniques and compares the entire autocorrelation structure of a test and reference signal series. The test and reference signals are first subjected to similar pre-processing to help guarantee signal stationarity. Pre-processing may include formation of multivariate signal clusters, filtering and sampling. Multivariate periodograms or autocovariance functions are then calculated for each signal series. Test statistics are computed and assessed to determine the equality of the test and reference signals. When the difference between sample autocovariance functions or periodograms of such signals exceeds a preselected threshold value, fault detection signals and / or related diagnostic information are provided as output to a user.

Description

PRIORITY CLAIM[0001]This application claims the benefit of priority of previously filed provisional application with the same title and inventors as present, having U.S. Provisional Patent Application Ser. No. 60 / 950,164, filed Jul. 17, 2007, which is incorporated herein by reference for all purposes.BACKGROUND OF THE INVENTION[0002]Various engineering technologies have been developed for use in a wide variety of scientific and other environments, including but not limited to the fields of engineering, (geo)physics, biology, astrophysics, medicine, econometrics, military applications and analysis of economics and environmental and other sciences. The systems and technologies developed in these fields and others are often quite complex, thus requiring modeling techniques to monitor and analyze system performance. In particular, diagnostics techniques for detecting fault occurrence(s) by analyzing sensory information are often beneficial approaches to system modeling.[0003]Diagnostic ...

Claims


Application Information

Patent Timeline
Patent Type & Authority Applications(United States)
IPC IPC(8): G08B21/00
CPCG05B23/0229
Inventor WAGNER, JOHN R.BASSILY, HANY F.LUND, ROBERT B.
Owner CLEMSON UNIVERSITY
Learn More