Method For Obtaining Resistivity From Controlled Source Electromagnetic Data

Inactive Publication Date: 2010-12-30
EXXONMOBIL UPSTREAM RES CO
View PDF20 Cites 27 Cited by
  • Summary
  • Abstract
  • Description
  • Claims
  • Application Information

AI Technical Summary

Benefits of technology

[0040](b) selecting one or more data components corresponding to frequencies higher than a minimum frequency, said minimum frequency being chosen to provide a pre-selected degree of shallow penetration of said subsurface region;
[0041](c) generating an initial resistivity data volume for the subsurface region through 1D (vertical dimension) inversion of the selected high frequency components of the measured electromagnetic field data;
[0042](d) solving Maxwell's electromagnetic field equations in three dimensions, assuming the initial resistivity data volume and a selected low frequency from the survey sou

Problems solved by technology

However, full 3D inversion is computationally intensive, requiring weeks or months of computer time on very large optimized systems.
These methods may not be readily available for industrial MCSEM applications and their efficiency in multi-source surveying may need to be confirmed.
This approach can lead to an accurate defini

Method used


Image

  • Method For Obtaining Resistivity From Controlled Source Electromagnetic Data
  • Method For Obtaining Resistivity From Controlled Source Electromagnetic Data
  • Method For Obtaining Resistivity From Controlled Source Electromagnetic Data

Examples


example

[0079]A 3D earth model, containing 15 resistive bodies meant to represent hydrocarbon reservoirs, was built and simulated using 3D forward electromagnetic simulation. FIGS. 8A and 8B are map-view depictions of the resistive bodies included in the 3D earth model. Resistive thicknesses of the bodies are depicted in grey-scale in FIG. 8A, with resistive thicknesses increasing from 1000 ohm-m2 (white) to 3500 ohm-m2 (black). The depths below the seafloor are depicted in grey-scale in FIG. 8B, with depths increasing from 900 m (white) to 1400 m (black). The model was simulated using 3D electromagnetic simulations for a grid-style survey consisting of 16 towlines and 39 receivers, based on an actual survey.

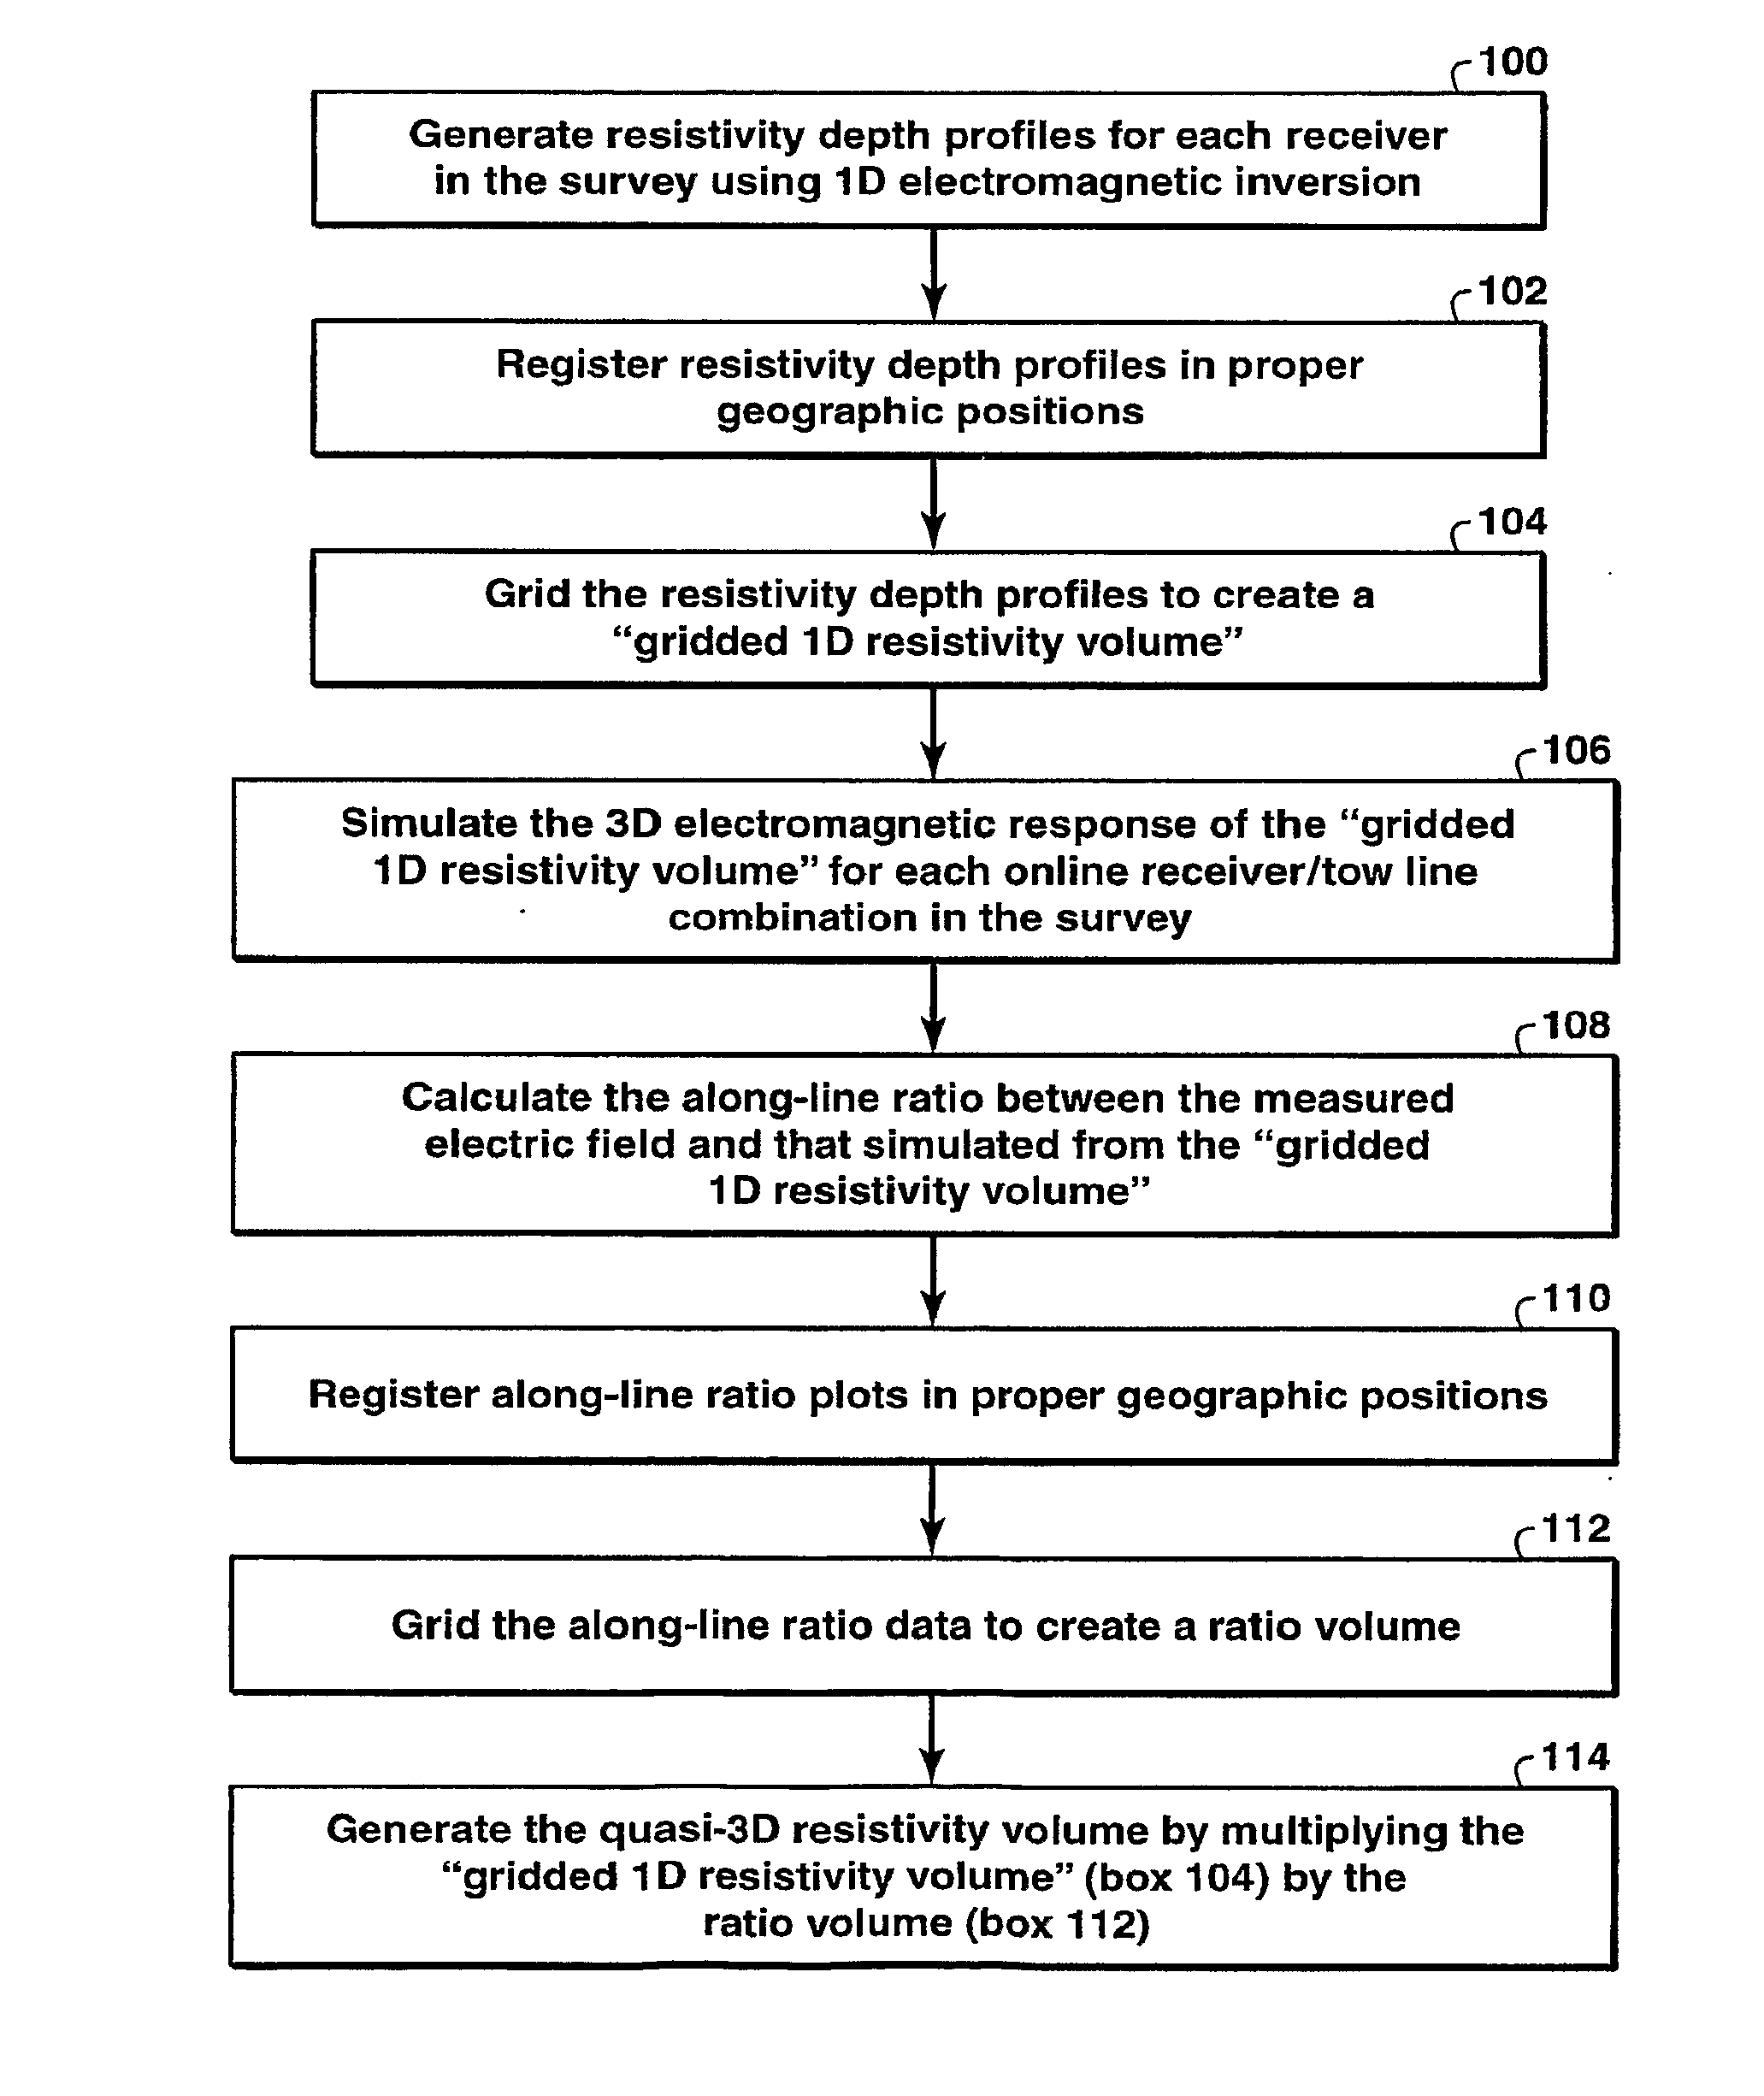
[0080]First, resistivity depth profiles for each receiver in the model survey illustrated in FIGS. 8A-B were generated from the simulated survey EM data, consistent with step 100 of FIG. 7. FIGS. 9B and 9C show MCSEM 1D inversion products from two receivers, at three different frequenci...


PUM


Abstract

Method for generating a three-dimensional resistivity data volume for a subsurface region from an initial resistivity model and measured electromagnetic field data from an electromagnetic survey of the region, where the initial resistivity model is preferably obtained by performing multiple ID inversions of the measured data [100]. The resulting resistivity depth profiles are then registered at proper 3D positions [102]. The 3D electromagnetic response is simulated [106] assuming the resistivity structure is given by the initial resistivity model. The measured electromagnetic field data volume is scaled by the simulated results [108] and the ratios are registered at proper 3D positions [110] producing a ratio data volume [112]. A 3D resistivity volume is then generated by multiplying the initial resistivity volume by the ratio data volume (or some function of it), location-by location [114]. A related method emphasizes deeper resistive anomalies over masking effects of shallow anomalies.

Description

[0001]This application claims the benefit of U.S. Provisional Application No. 60 / 789,781 filed on Apr. 6, 2006.FIELD OF THE INVENTION[0002]This invention relates generally to the field of geophysical prospecting, and more particularly to controlled source electromagnetic (“CSEM”) prospecting, including field delineation. Specifically, this invention concerns the interpretation, analysis and resistivity volume construction of marine controlled-source electromagnetic (“MCSEM”) data. It may be useful in the exploration for, characterization and subsurface mapping of reservoired hydrocarbons or other electrically resistive or conductive bodies of economic value, when using MCSEM. (See, for example, U.S. Pat. No. 6,603,313 to Srnka.)BACKGROUND OF THE INVENTION[0003]Controlled-source electromagnetic surveys are an important geophysical tool for evaluating the presence of hydrocarbon-bearing strata within the earth. CSEM surveys typically record the electromagnetic signal induced in the ea...

Claims


Application Information

Patent Timeline
IPC IPC(8): G06F17/10
CPCG01V3/12G01V3/083G01V3/38
Inventor WAHRMUND, LESLIE A.GREEN, KENNETH E.PAVLOV, DMITRIY A.SRNKA, LEONARD J.
Owner EXXONMOBIL UPSTREAM RES CO
Why Eureka
Try Eureka