Crop Automated Relative Maturity System

a technology of relative maturity and crop, applied in the field of automated crop relative maturity measurement system, can solve the problem of time-consuming and labor-intensive data collection method

Inactive Publication Date: 2011-02-24
SYNGENTA PARTICIPATIONS AG
View PDF14 Cites 59 Cited by
  • Summary
  • Abstract
  • Description
  • Claims
  • Application Information

AI Technical Summary

Benefits of technology

[0006]The present invention consists of an automated relative maturity system for measuring the relative maturity of a large number of plots of diverse varieties of plants growing in a field or fields. A field to be evaluated is laid out in multiple plots with a specific variety assigned to a preselected plot or plots and with areas set aside throughout the field for planting of check varieties of known relative maturity. High-precision GPS is used with a planter to record the location of each plot within the field. At a selected time in the life cycle of the crop, preferably when leaf senescence is under way throughout the field, a radiometric crop sensor mounted on a vehicle is used to scan the plants in the plots to record readings of the plants synchronized to the GPS map locations, including the check plants of known relative maturity. Software is used to calculate the relative maturity of each variety. In a preferred embodiment, this relative maturity data is passed on to a database of other characteristics of each individual variety evaluated in the field.

Problems solved by technology

Collecting data using this method is very time consuming.
In addition, despite best efforts, there is inevitably variation in each data collector's subjective evaluation of maturity and also a tendency even among individual data collectors to alter a subjective evaluation of maturity, especially between fields.

Method used


Image

  • Crop Automated Relative Maturity System
  • Crop Automated Relative Maturity System
  • Crop Automated Relative Maturity System

Examples


example 1

[0046]Two fields were planted on a farm located near Ames, Iowa. Field A was planted on May 21. Field A comprised 21 acres (1920 feet by 480 feet) and was divided into 36,864 plots as shown in FIG. 5. Check variety S08-M8 was planted in rows 1 and 2 and 49 and 50, and check varieties S15-R2, S21-N6, S25-B9 and S30-F5 were planted in rows 2-6 and 51-54, respectively. Experimental varieties were planted in the other plots. Specifically, experimental varieties A-N were planted in rows 7-20, respectively, and across range 1 (FIG. 7). Field C was planted June 17 the same year. Field C comprised 20 acres (1800 feet by 480 feet) and was divided into 34,560 plots as shown in FIG. 6. Check varieties S15-R2, S21-N6, S25-B9 and 530-F5 were planted in rows 1-4 and 49-52, respectively. Experimental varieties were planted in the other plots. Specifically, experimental varieties O-Z and A1-D1 were planted in rows 5-20, respectively, and across rangel (FIG. 8). The check varieties covered maturity ...

example 2

Experiment Corn Staygreen Phenotyping Methodology Trial

[0052]An experiment using the devices shown in FIGS. 11a and 11b were employed on maize to detect the staygreen of plants in trials. Staygreen is a function of plant health, plant stress, insect and disease pressures on the plant These stay green trials were maize inbred trials and maize hybrids trials. The hybrid trials had 8, 30 inch rows, 40 foot long plots. The data was collected with canopy readings taken between rows four and five, of all 65 plots. Below canopy readings taken between rows four and five, on the first set of 16 plots.

[0053]The inbred trial had 1, 30 inch row, 20 foot long plots. The above canopy readings taken over the row, for the first 100 plots. In all the trials, five readings, one per week, were taken. Some frost damage occurred between the 4th reading and last collection date. Average staygreen readings were taken as visual readings and active sensor readings as shown in FIGS. 12a and 12b.

[0054]In the...

example 3 sudden

Death Syndrome

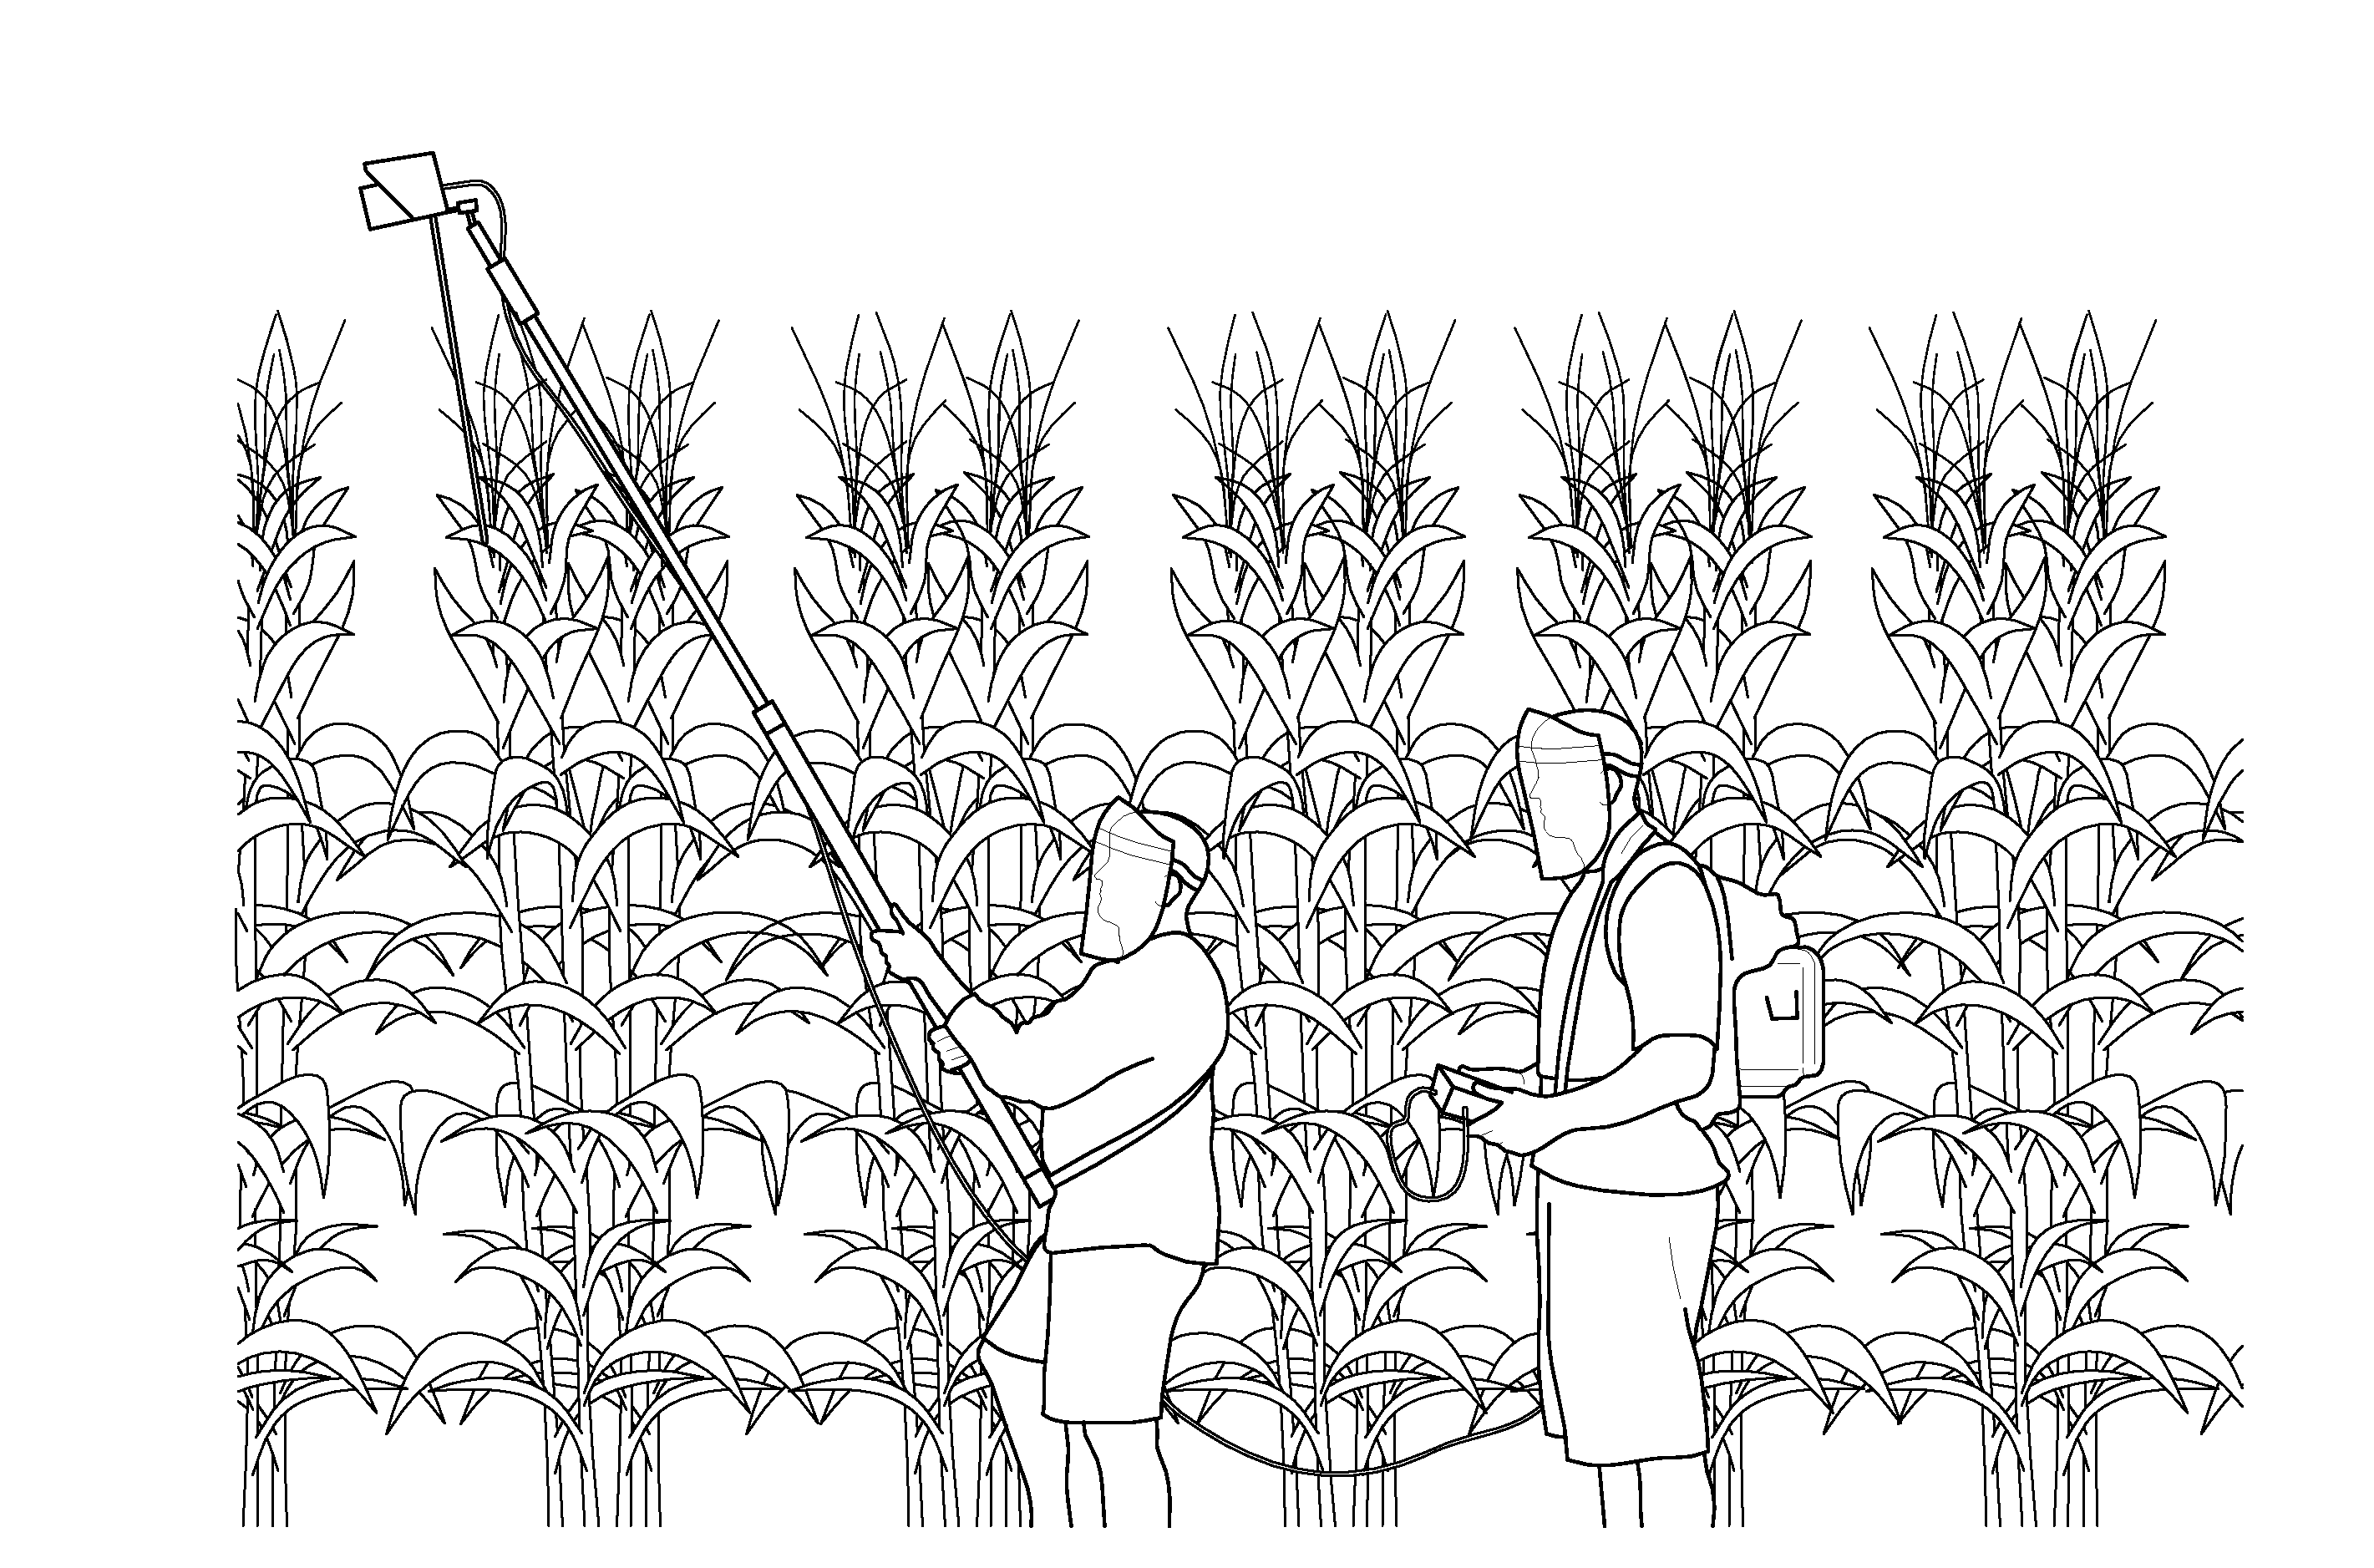
[0057]The seed was planted at a density of 10 seeds per foot and a row width 30 inches and a GPS map of the seed planted in the fields was created at the time of planting. Data was to be collected from the soybean field for determination of relative maturity. However, prior to the time period for data collection the field was highly impacted by Sudden Death Syndrome (SDS). This disease causes plants particularly those in the R4-R6 stage to die prematurely. Premature death of part of the plants in the field most susceptible to Sudden Death Syndrome would skew any relative maturity ratings. It was determined that data will be collected using the PDF 450G detasseling machine, modified as shown in FIGS. 3 and 4. The speed of the detassler will be approximately 3 mph and driven transverse to the rows. The GreenSeeker® RT100 sensor will initially be set to collect data at 50 msec (20 data points per second) to match the GPS data stream from the NovAtel ProPak®-V3 device. To ...


PUM


Abstract

An automated relative maturity system for measuring the relative maturity of a large number of plots of diverse varieties of plants growing in a field or fields. A field to be evaluated is laid out in multiple plots with a specific variety assigned to a preselected plot or plots and with areas set aside throughout the field for planting of check varieties of known relative maturity. High-precision GPS is used with a planter to record the location of each plot within the field on a map. When leaf senescence is under way throughout the field, a radiometric crop sensor mounted on a vehicle also equipped with high-precision GPS is used to scan the plants in the plots to record readings of the plants synchronized to the GPS map locations, including the check plants of known relative maturity. Software is used to calculate the relative maturity of each variety.

Description

CROSS REFERENCE TO RELATED APPLICATION[0001]This application claims benefit of U.S. Provisional Application Ser. No. 61 / 235,908 filed Aug. 21, 2009 and U.S. Provisional Application Ser. No. 61 / 349,018 filed May 27, 2010 and U.S. Provisional Application Ser. No. 61 / 373,471 filed Aug. 13, 2010 which are incorporated herein by reference in their entirety.BACKGROUND OF THE INVENTION[0002]The present invention relates generally to a system for measuring relative maturity of a crop and, more specifically, to an automated relative maturity system for measuring quickly and efficiently relative maturity of a large number of plants of diverse varieties.[0003]The growing season for agricultural crops varies from location to location. In the United States, the growing season is longer the farther south the crop growing location and shorter the farther north the crop growing location. While there is no standardized maturity zone map, for soybeans, most divide the United States into eleven or twe...

Claims


Application Information

Patent Timeline
Patent Type & Authority Applications(United States)
IPC IPC(8): A01H1/00G06F19/00
CPCA01G7/00G01N2021/8466G01N21/3151G01C11/02A01B79/005A01C21/007
Inventor STACHON, WALTERLUEBBERT, KENBILYEU, KEITHSTROTTMAN, JOELARSON, RYAN
Owner SYNGENTA PARTICIPATIONS AG
Why Eureka
Try Eureka