Fugitive emission flux measurement

a technology of fugitive emission and flux measurement, which is applied in the direction of weather condition prediction, underground/near-surface gas prospecting/detection, etc., can solve the problems of inapplicability to sources, time-consuming use of flux boxes and dynamic closed chambers, and difficulty in determining the accuracy of fugitive emission measurement results

Active Publication Date: 2011-05-26
GOLDER ASSOCIATES
View PDF15 Cites 22 Cited by
  • Summary
  • Abstract
  • Description
  • Claims
  • Application Information

AI Technical Summary

Benefits of technology

[0038]Measurement occurs along successive distinct parallel or substantially parallel measurement beam paths, and if desired, along distinct sampling surfaces. This sampling method ensures that localized areas of higher pollutant concentration are not repeatedly sampled, as could be the case if, for example the measurement paths are radial or substantially non-parallel. The methods described herein is more accurate than that of methods that have a measurement beam that extends only partway through the emission plume, such as for example OTM 10, of a large and tall landfill, since the methods described herein do not require extensive extrapolation. In the methods described herein, the measurement beam path describes a vertical, or substantially vertical measurement plane as the airborne or ground-based mobile platform follows a measurement beam (travel) path, or measurement surface, across the emission plume. In the case of an airborne ORSI, the travel path can be set to be above the height of the plume, to ensure that each measurement beam path along the measurement surface passes through the depth (from the top to the ground) of the plume. The travel path may be straight, approximately straight, or curved. The mass per unit length of airborne material within the measurement surface through which multiple optical path measurements (along a measurement beam path) are obtained describes a cross section of the emission plume. The wind velocity may also be also determined for each measurement surface. The data obtained for the measurement surface is processed by an algorithm, and the calculated mass per unit length and wind velocity are used to calculate a flux of the fugitive emission. The algorithm used to process the data does not require reiterative calculation of a cumulative distribution function to provide a map of the concentration of airborne matter.

Problems solved by technology

Due to the extent and non-homogeneous nature of many area sources, assessment of fugitive emissions using traditional point sampling techniques can be problematic (Thoma, 2008).
Use of flux boxes and dynamic closed chambers can also be time consuming and are not applicable to sources such as reservoirs or mines.
Field tests for a large area can require many days to complete.
If the fugitive emissions are dominated by one or more concentrated sources, such as cracks in a landfill, these methods may not be suitable.
Thus the method is not applicable to many sites, which are sloping or have varying topography.
This method is restricted to situations where the source is sufficiently strong such that it can be measured at a sufficient distance downwind where adequate mixing of the airborne matter and tracer gas has occurred.
As such, it is not suitable for confirmation of emissions from sites where emission rates are low (Czepiel, 1996).
Dispersion models can be complex and incorporate many simplifying assumptions.
However, this method may not sample the entire plume volume, as the height of the measurement path is limited by the angle from which the ground-based instrument is pivoted in order to target the highest vertical reflector (which is ground based).
This point sampling method introduces an error since the whole region is not sampled.
Sampling is only along horizontal lines and there is no teaching on the use of optical remote sensing instruments with targets or reflectors.
However, it does not teach how to account for a natural background concentration of a pollutant in the atmosphere.
In addition, the accuracy of the method for some gases is questionable due to the long absorption distance through the atmosphere.
In an emission flux measurement application, this equipment is ground based, expensive, heavy and bulky.
However, Babilotte (2008) state that ALMA “provides a path-integrated concentration on a vertical line, and does not allow fluxes quantification”.
All of the above methods either have significant constraints that limit their applicability and accuracy, or are tools for which a methodology to measure fugitive emission fluxes is not available.

Method used


Image

  • Fugitive emission flux measurement
  • Fugitive emission flux measurement
  • Fugitive emission flux measurement

Examples


example 1

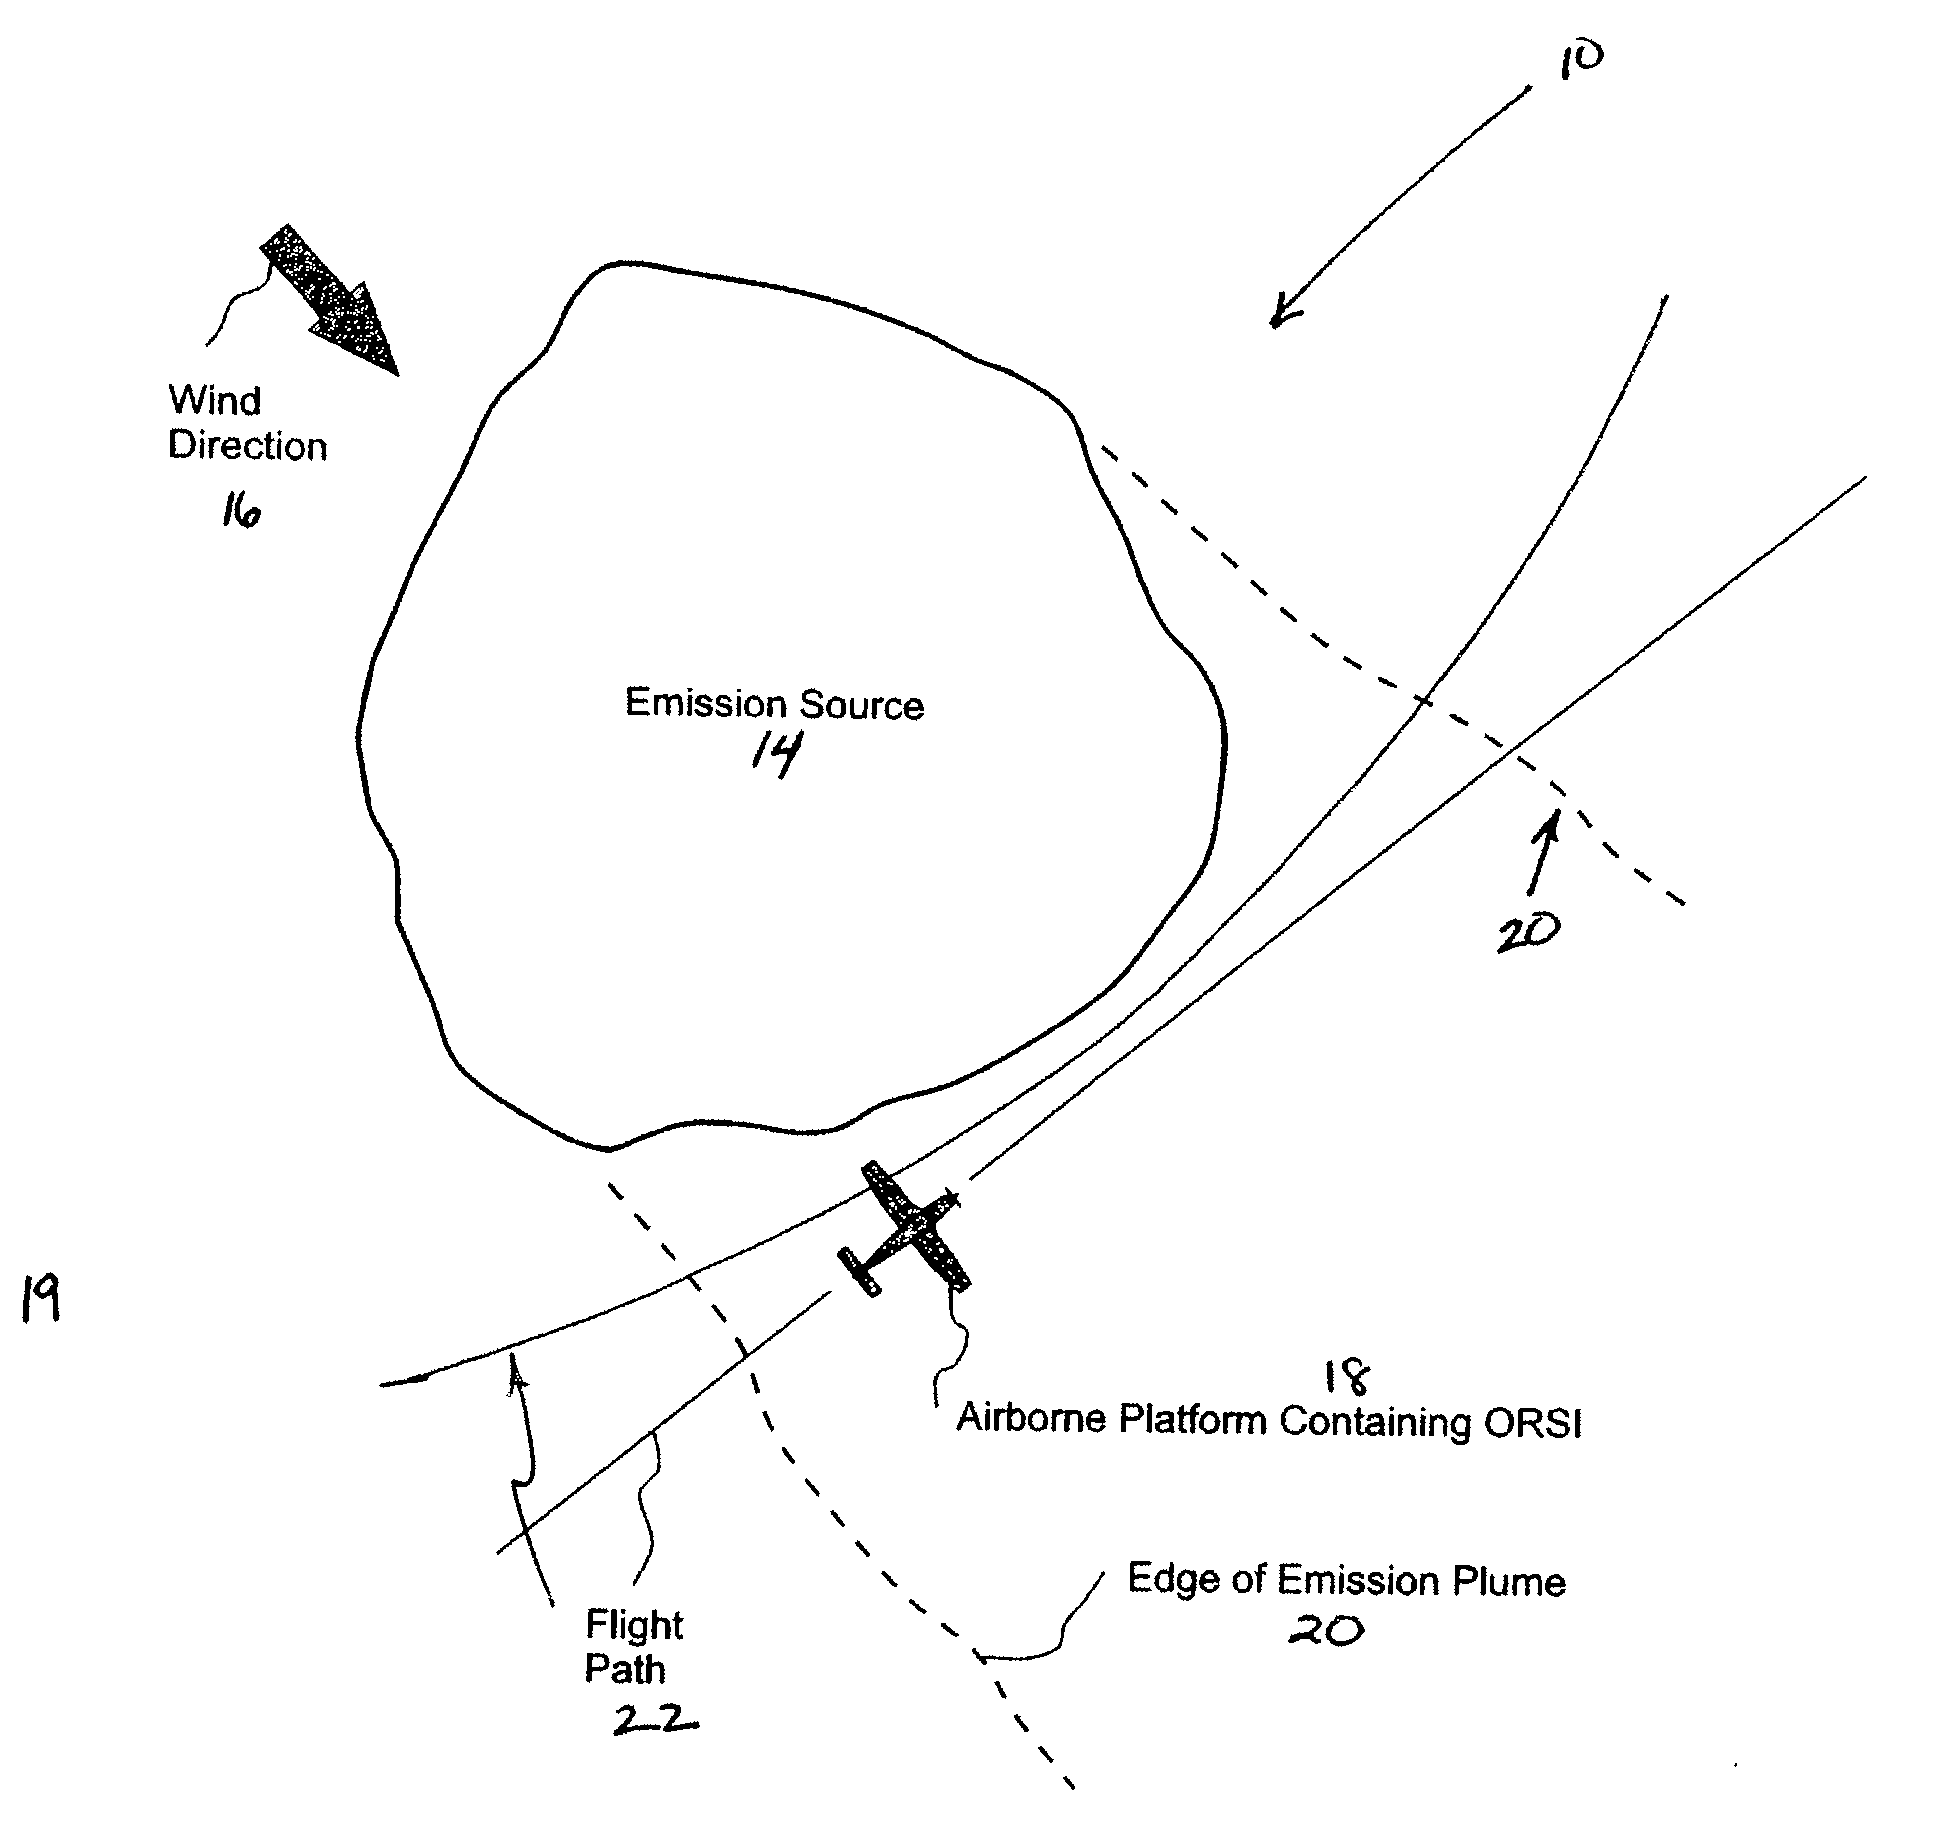
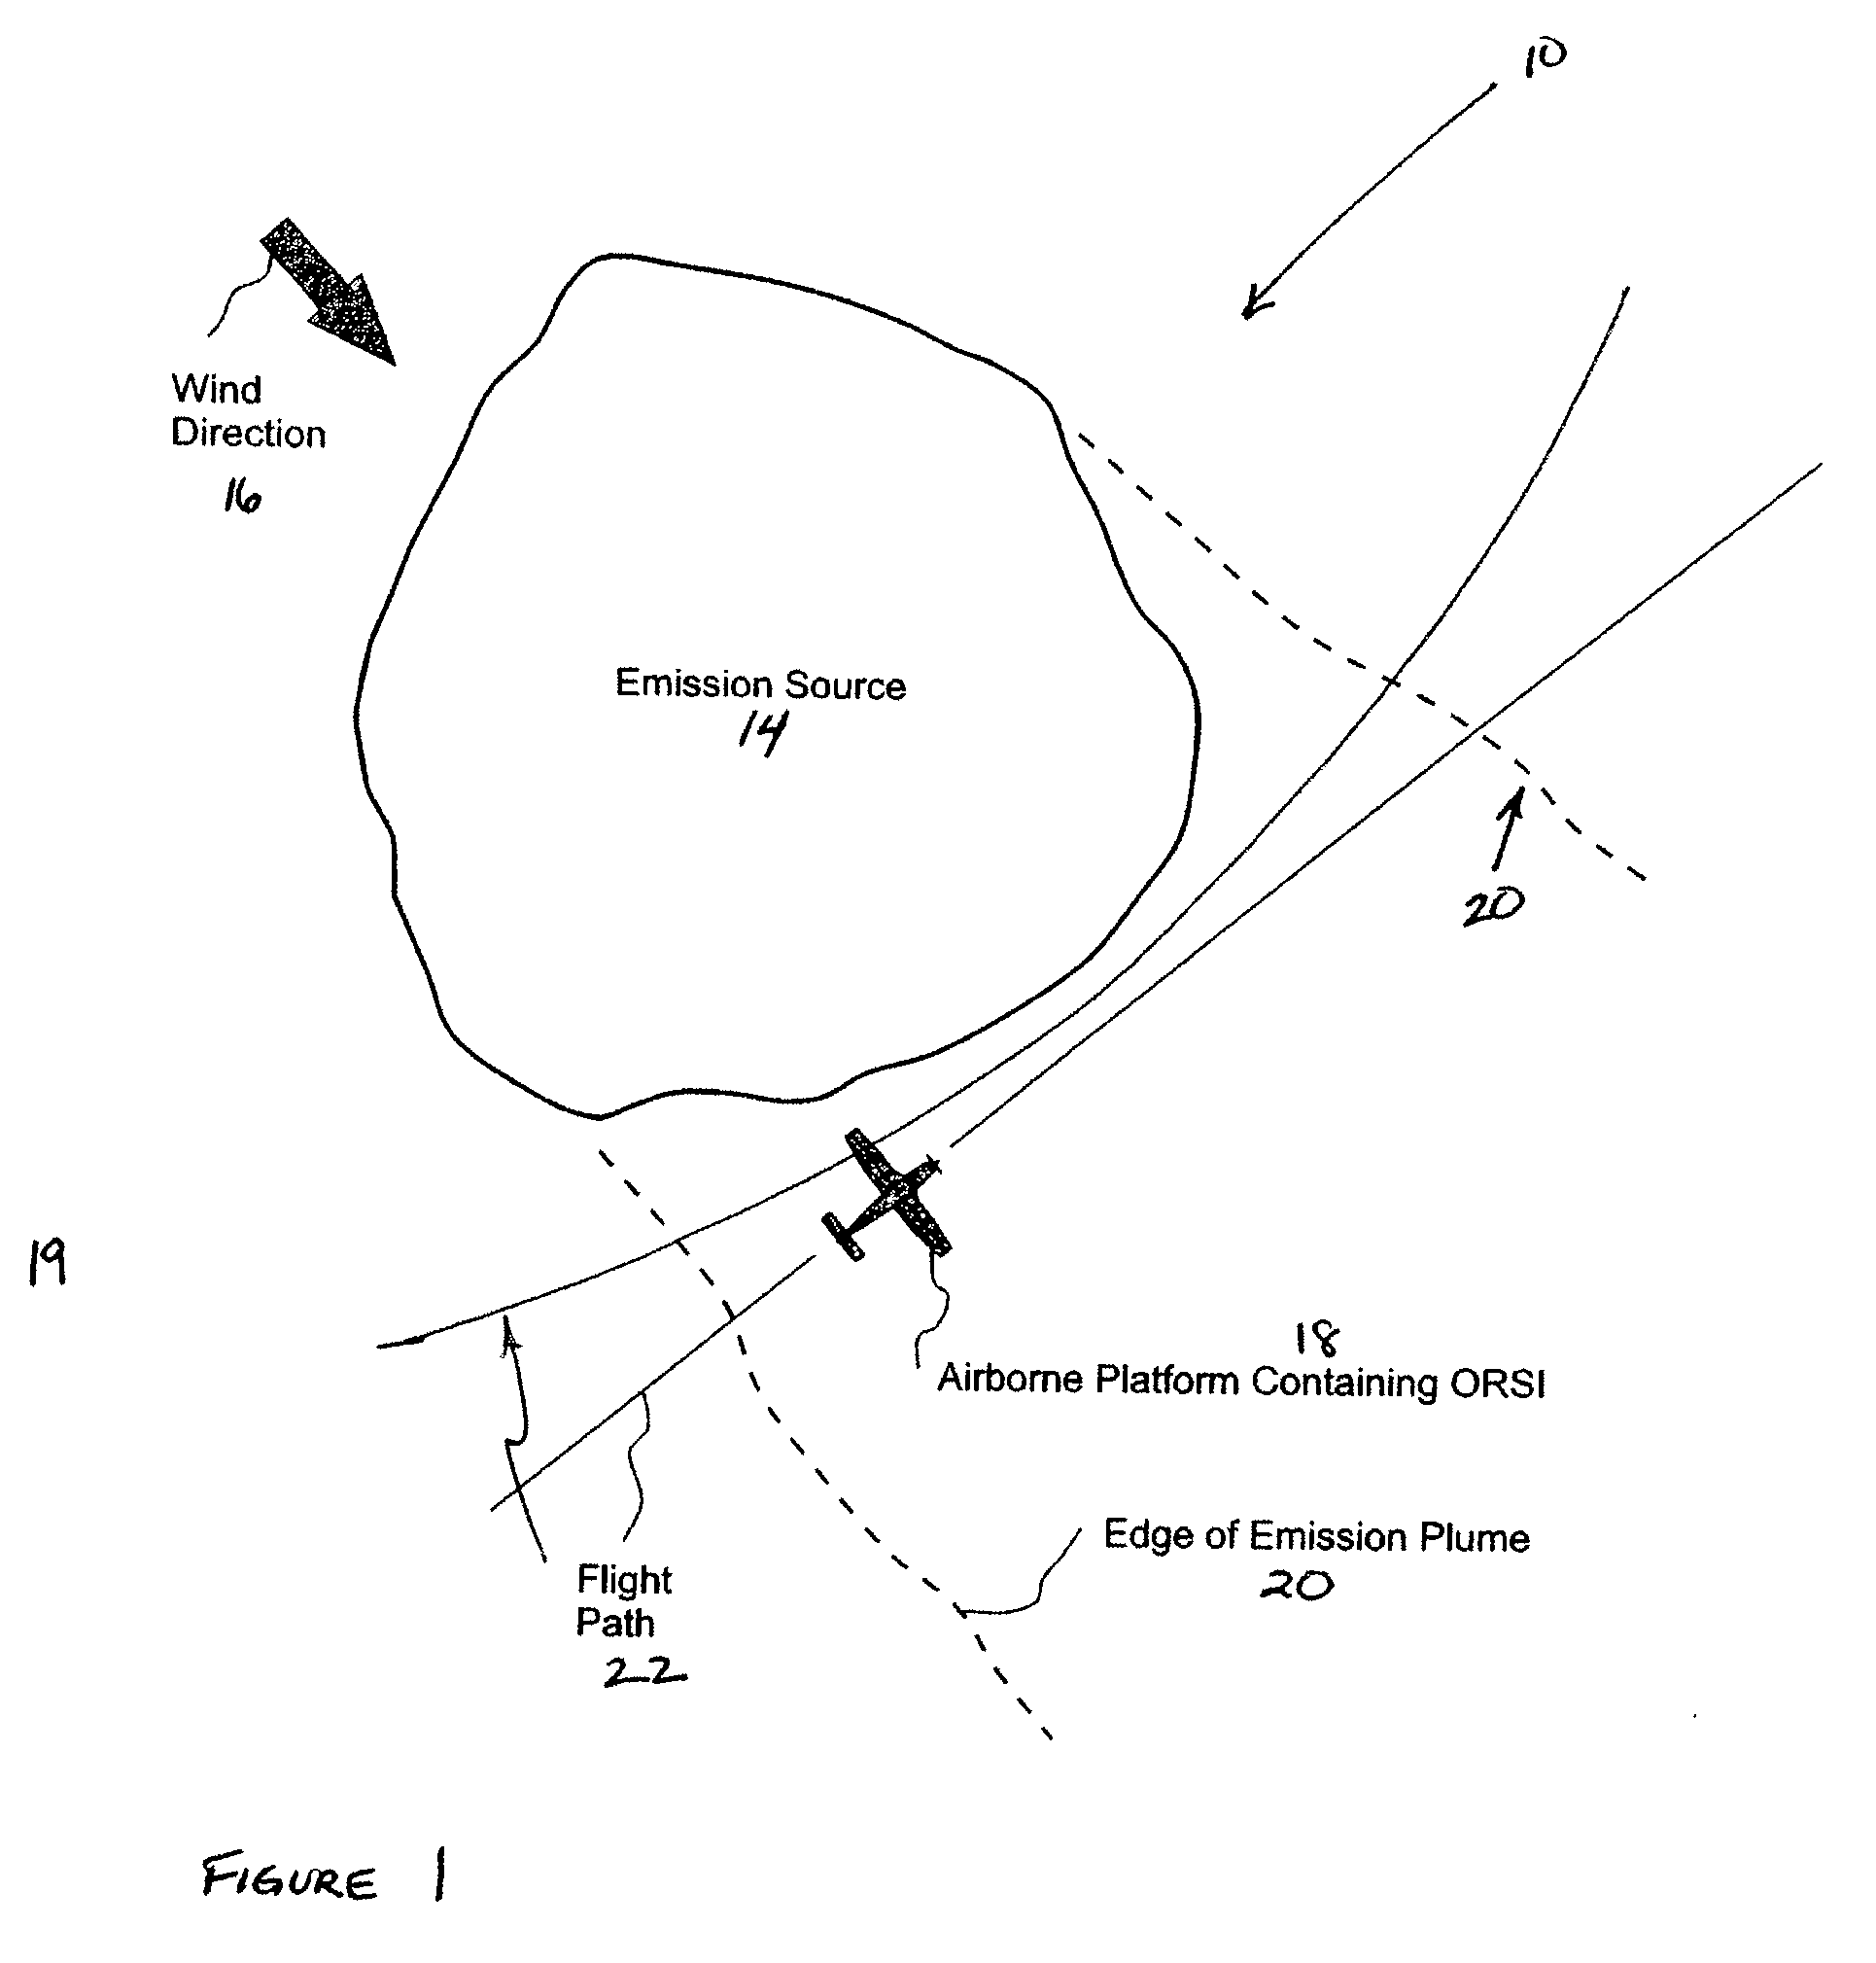
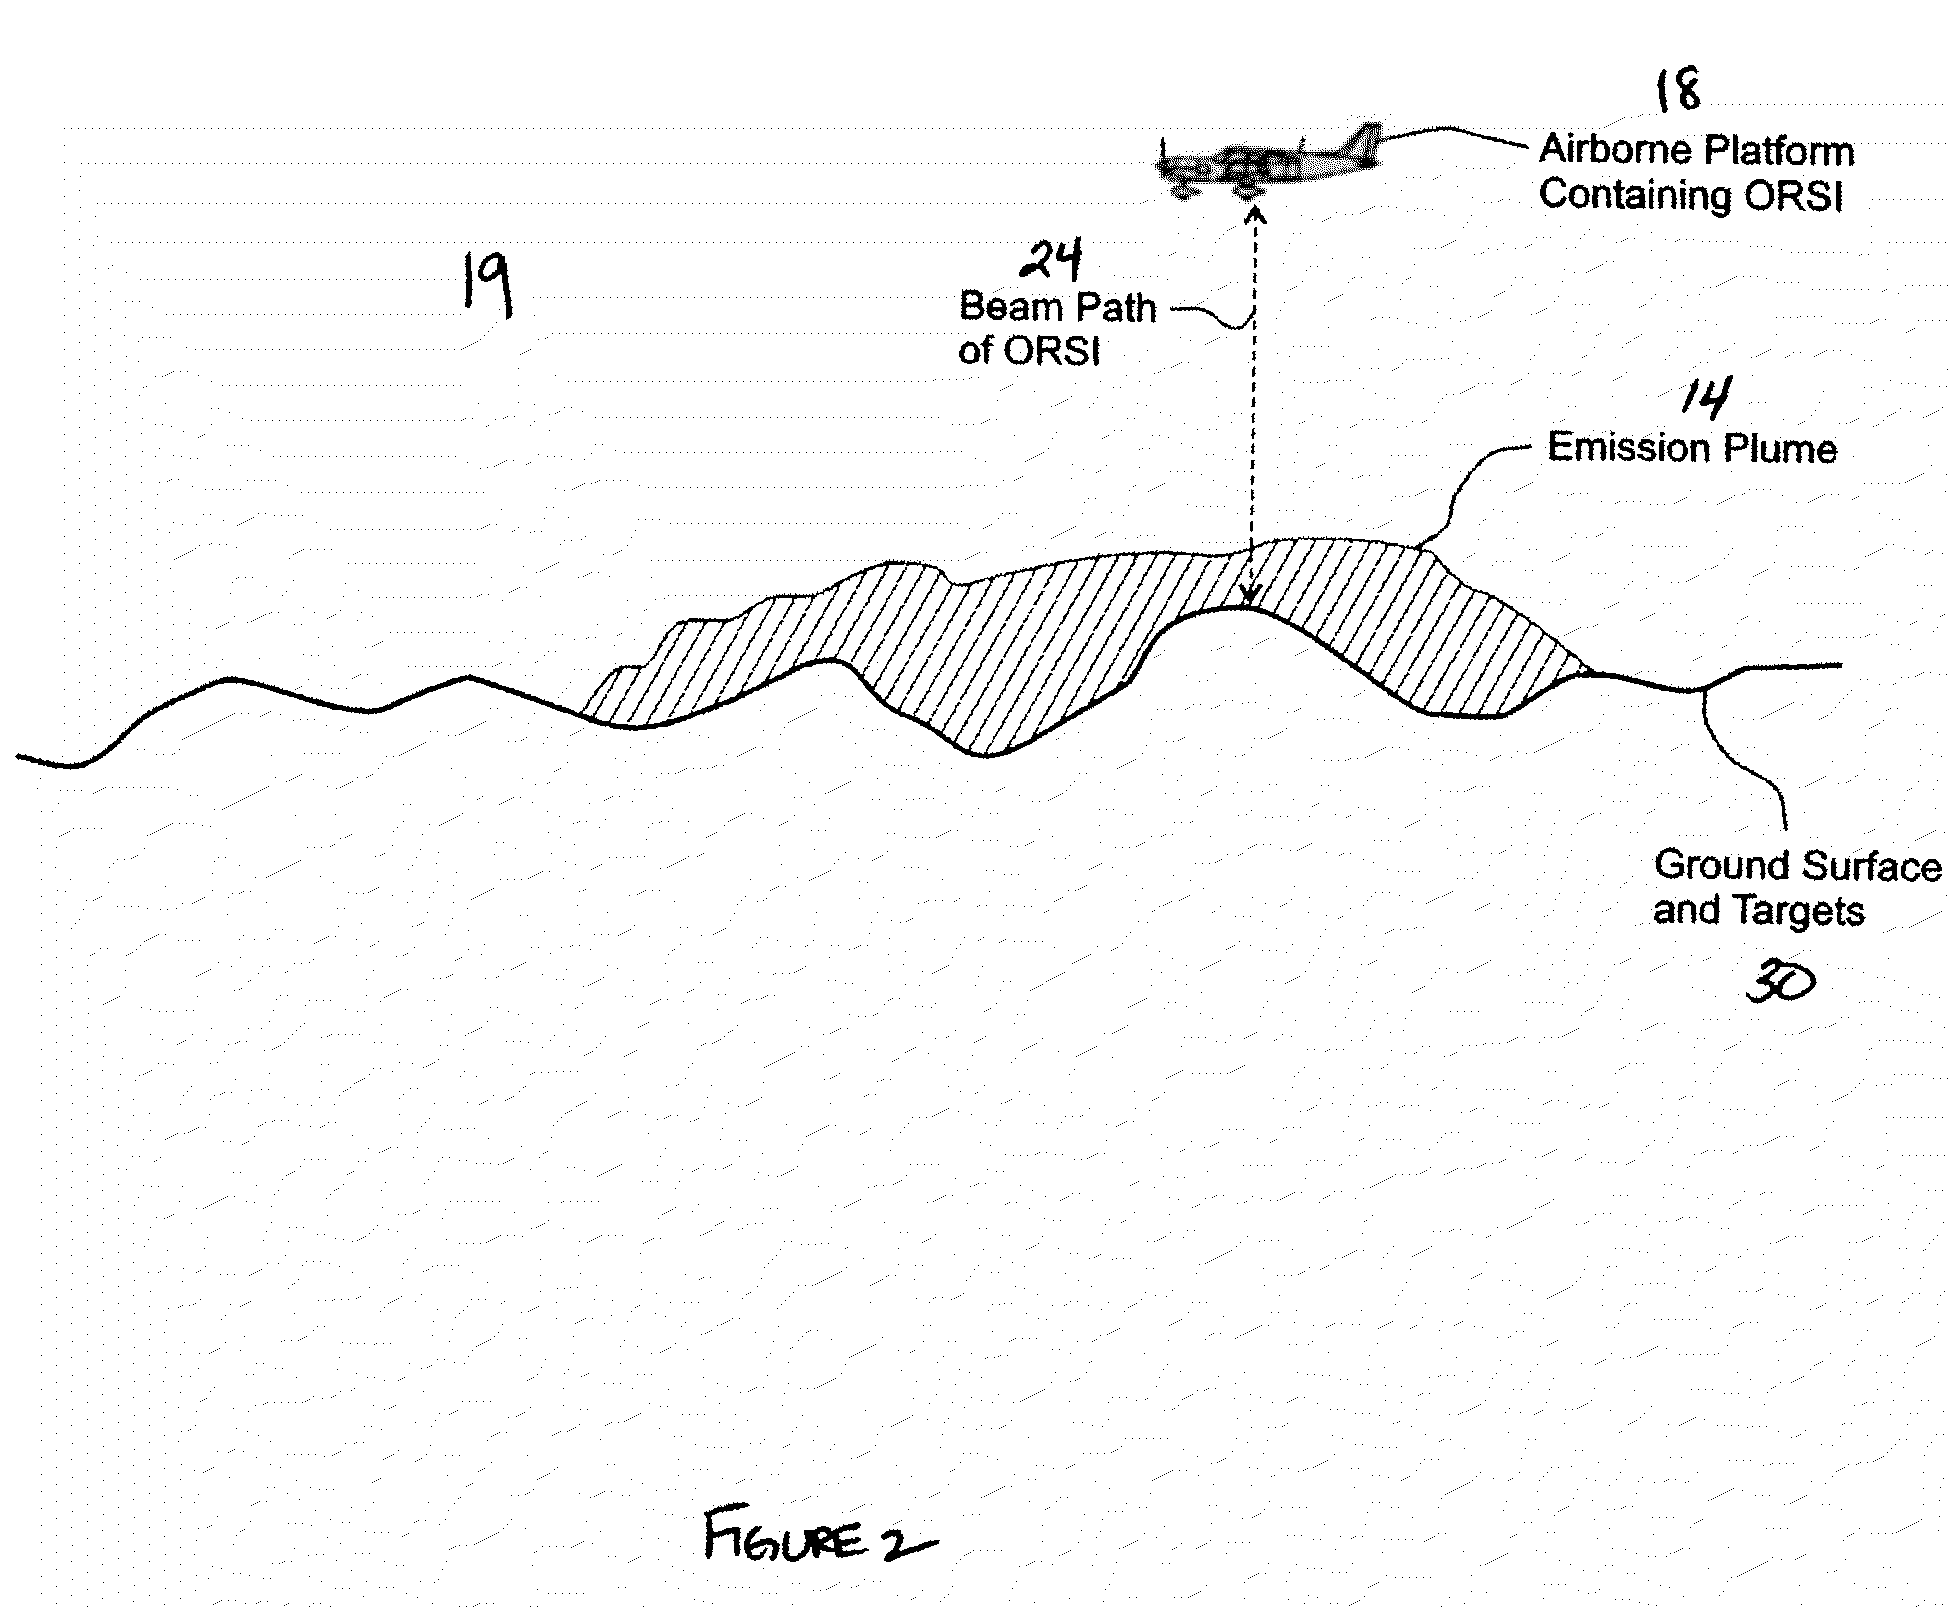
Measuring and Determining Flux of a Fugitive Emission Plume

[0102]A controlled methane (subject gas) leak is illustrated in FIG. 3 as a fugitive emission plume of varying integrated concentrations with distance from the source, after having subtracted the background concentration. The leak has a flow rate of 17 SCFM (standard cubic feet / minute; one SCFM is equal to 1.7 m3 / hour). Three measurement surfaces (A, B, C) as illustrated were obtained using an airborne ORSI (DIAL using ND:YLF lasers) approximately at 300 m above the ground surface. In this special case, the ORSI was able to obtain measurements up to approximately 19 m on either side of a flight path that was parallel to the wind direction.

[0103]In this example, the wind speed is 1.3 metres per second.

[0104]The mass of methane per unit length for the three measurement surfaces A, B, C is provided in Table 1. The mass per unit length for each of the measurement surfaces is calculated by measuring the area under the ppm-m versu...

example 2

Adjusting an ORSI Measurement within an Emission Plume for Uniform Background Concentration

[0106]Measurement in the background region records the following data:

Distance between ORSI and target=224 m

ORSI measurement=380.8 ppm-m

Therefore, background concentration of methane=380.8 ppm-m / 224 m=1.7 ppm.

[0107]Measurement in the fugitive emission plume records the following data:

Distance between the ORSI and target=305 m

ORSI measurement=931 ppm-m

Therefore, the portion of the ORSI integrated concentration measurement due to background=1.7 ppm×305 m=518.5 ppm-m

The portion of the ORSI integrated concentration measurement due to the fugitive emission (measurement after subtracting background concentration)=931 ppm-m−518.5 ppm-m=412.5 ppm-m


PUM

PropertyMeasurementUnit
heightaaaaaaaaaa
lengthaaaaaaaaaa
unit lengthaaaaaaaaaa

Abstract

A method of obtaining a fugitive emission flux measurement of airborne matter is provided. The method involves measuring the airborne matter along one or more than one measurement surface that spans the fugitive emission using two or more than two measurement beam paths where each of the two or more than two measurement beam paths are parallel to each other, or substantially parallel to each other, and determining a mass per unit length measurement for the measurement surface, determining a representative wind velocity at or near the one or more than one measurement surface, and calculating the fugitive emission flux of the airborne matter in mass per unit time using the mass per unit length determination and representative wind velocity.

Description

CROSS REFERENCE TO RELATED APPLICATIONS[0001]This application claims priority from U.S. Provisional Application No. 61 / 136,837 filed Oct. 8, 2008, Canadian Patent Application No. 2,655,279 filed Mar. 10, 2009, and U.S. application Ser. No. 12 / 575,854, filed Oct. 8, 2009, the contents of which are incorporated herein by reference.FIELD OF INVENTION[0002]The present invention relates to methods for obtaining a fugitive emission flux measurement of airborne matter.BACKGROUND OF THE INVENTION[0003]Fugitive emissions result from releases of airborne matter to the atmosphere from diffuse sources, which can include landfills, reservoirs, effluent ponds, mines, natural deposits, or even a collection of point-sources such as cities, industrial plants, or a herd of animals. Fugitive emissions can also include emissions from point sources, such as smokestacks, flares, wells, exhaust tubes, leaks and vent pipes, that have been released to the atmosphere. The airborne matters can be greenhouse g...

Claims


Application Information

Patent Timeline
Patent Type & Authority Applications(United States)
IPC IPC(8): G01N21/35G01N33/00G01N21/00G01J3/44
CPCG01N2021/1793G01N2021/1795G01W1/10G01S17/95G01V9/007G01S15/885Y02A90/10
Inventor WONG, COLIN IRVIN
Owner GOLDER ASSOCIATES
Why Eureka
Try Eureka