Automated calibration method and system for a diagnostic analyzer

a diagnostic analyzer and automatic calibration technology, applied in the field of diagnostic instruments, can solve the problems of very high cost of the market, and achieve the effect of reducing the impact of single sample variation on batch results

Active Publication Date: 2012-01-05
IDEXX LABORATORIES
View PDF31 Cites 6 Cited by
  • Summary
  • Abstract
  • Description
  • Claims
  • Application Information

AI Technical Summary

Benefits of technology

[0020]There are many benefits of utilizing Bull batches to summarize patient samples into a control chart, which is displayed on the analyzer so that the clinician may determine if the analyzer needs to be re-calibrated, even during the period between fixed cell control tests. The Bull weighted moving averages algorithm provides a means to reduce the impact of single sample variations on batch results. Also, utilizing the analysis for red cell indices, that is, RBC (red blood cells), MCV (mean corpuscular volume), HGB (hemoglobin), HCT (hematocrit), MCH (mean corpuscular hemoglobin), and MCHC (mean corpuscular hemoglobin concentration), has additional benefit since several of the parameters (MCV, MCH, and MCHC) have tight normal variations, within species, that can provide additional information with respect to result accuracy. Many concerns related to specialty practices running multiple sick patients and oncology patients can be mitigated since there are few clinical conditions that drive significant variation in MCV, MCH, and MCHC for a population of patients.

Problems solved by technology

There is a fundamental flaw in that approach since a single patient result cannot be used to determine if it is appropriate to report.
One criticism of patient-based quality assurance for chemistry analyzers is that, unlike many hematology parameters, chemistry results can have wide reference intervals and can have significantly wider variations in clinically ill patients.
The veterinary market is very cost sensitive and controls are not run in the same manner as in human practices, which generally run fixed cell controls approximately at least once per 8-hour shift.
Due to flagging and other internal checks, these results are often not reported to the user.

Method used


Image

  • Automated calibration method and system for a diagnostic analyzer
  • Automated calibration method and system for a diagnostic analyzer
  • Automated calibration method and system for a diagnostic analyzer

Examples


Embodiment Construction

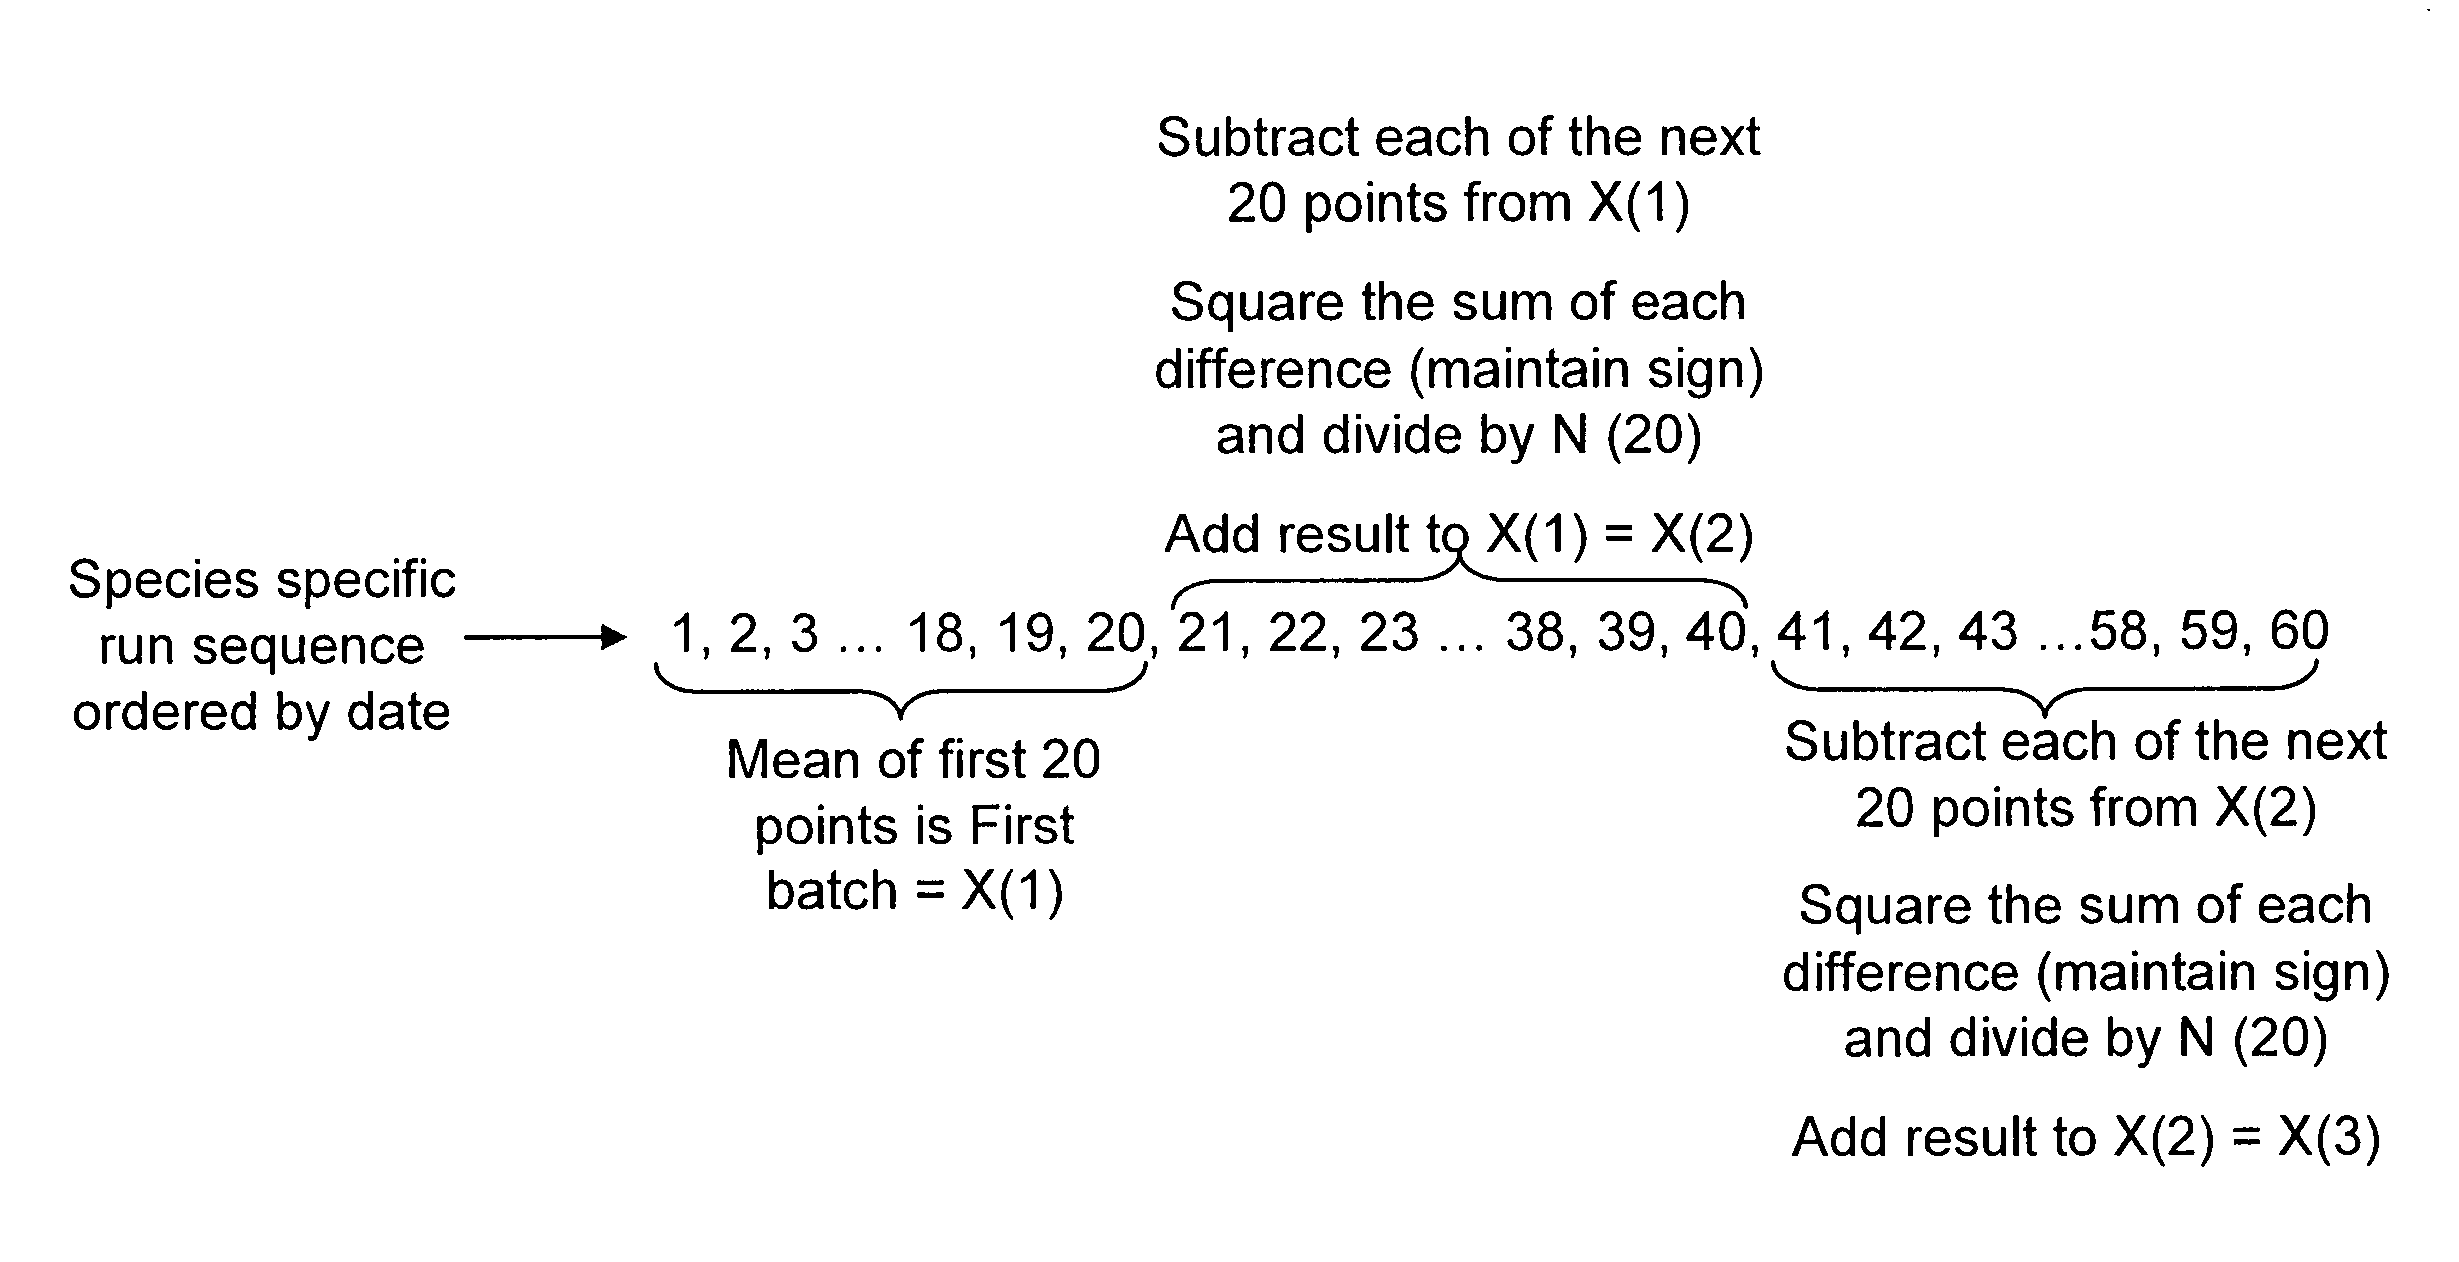
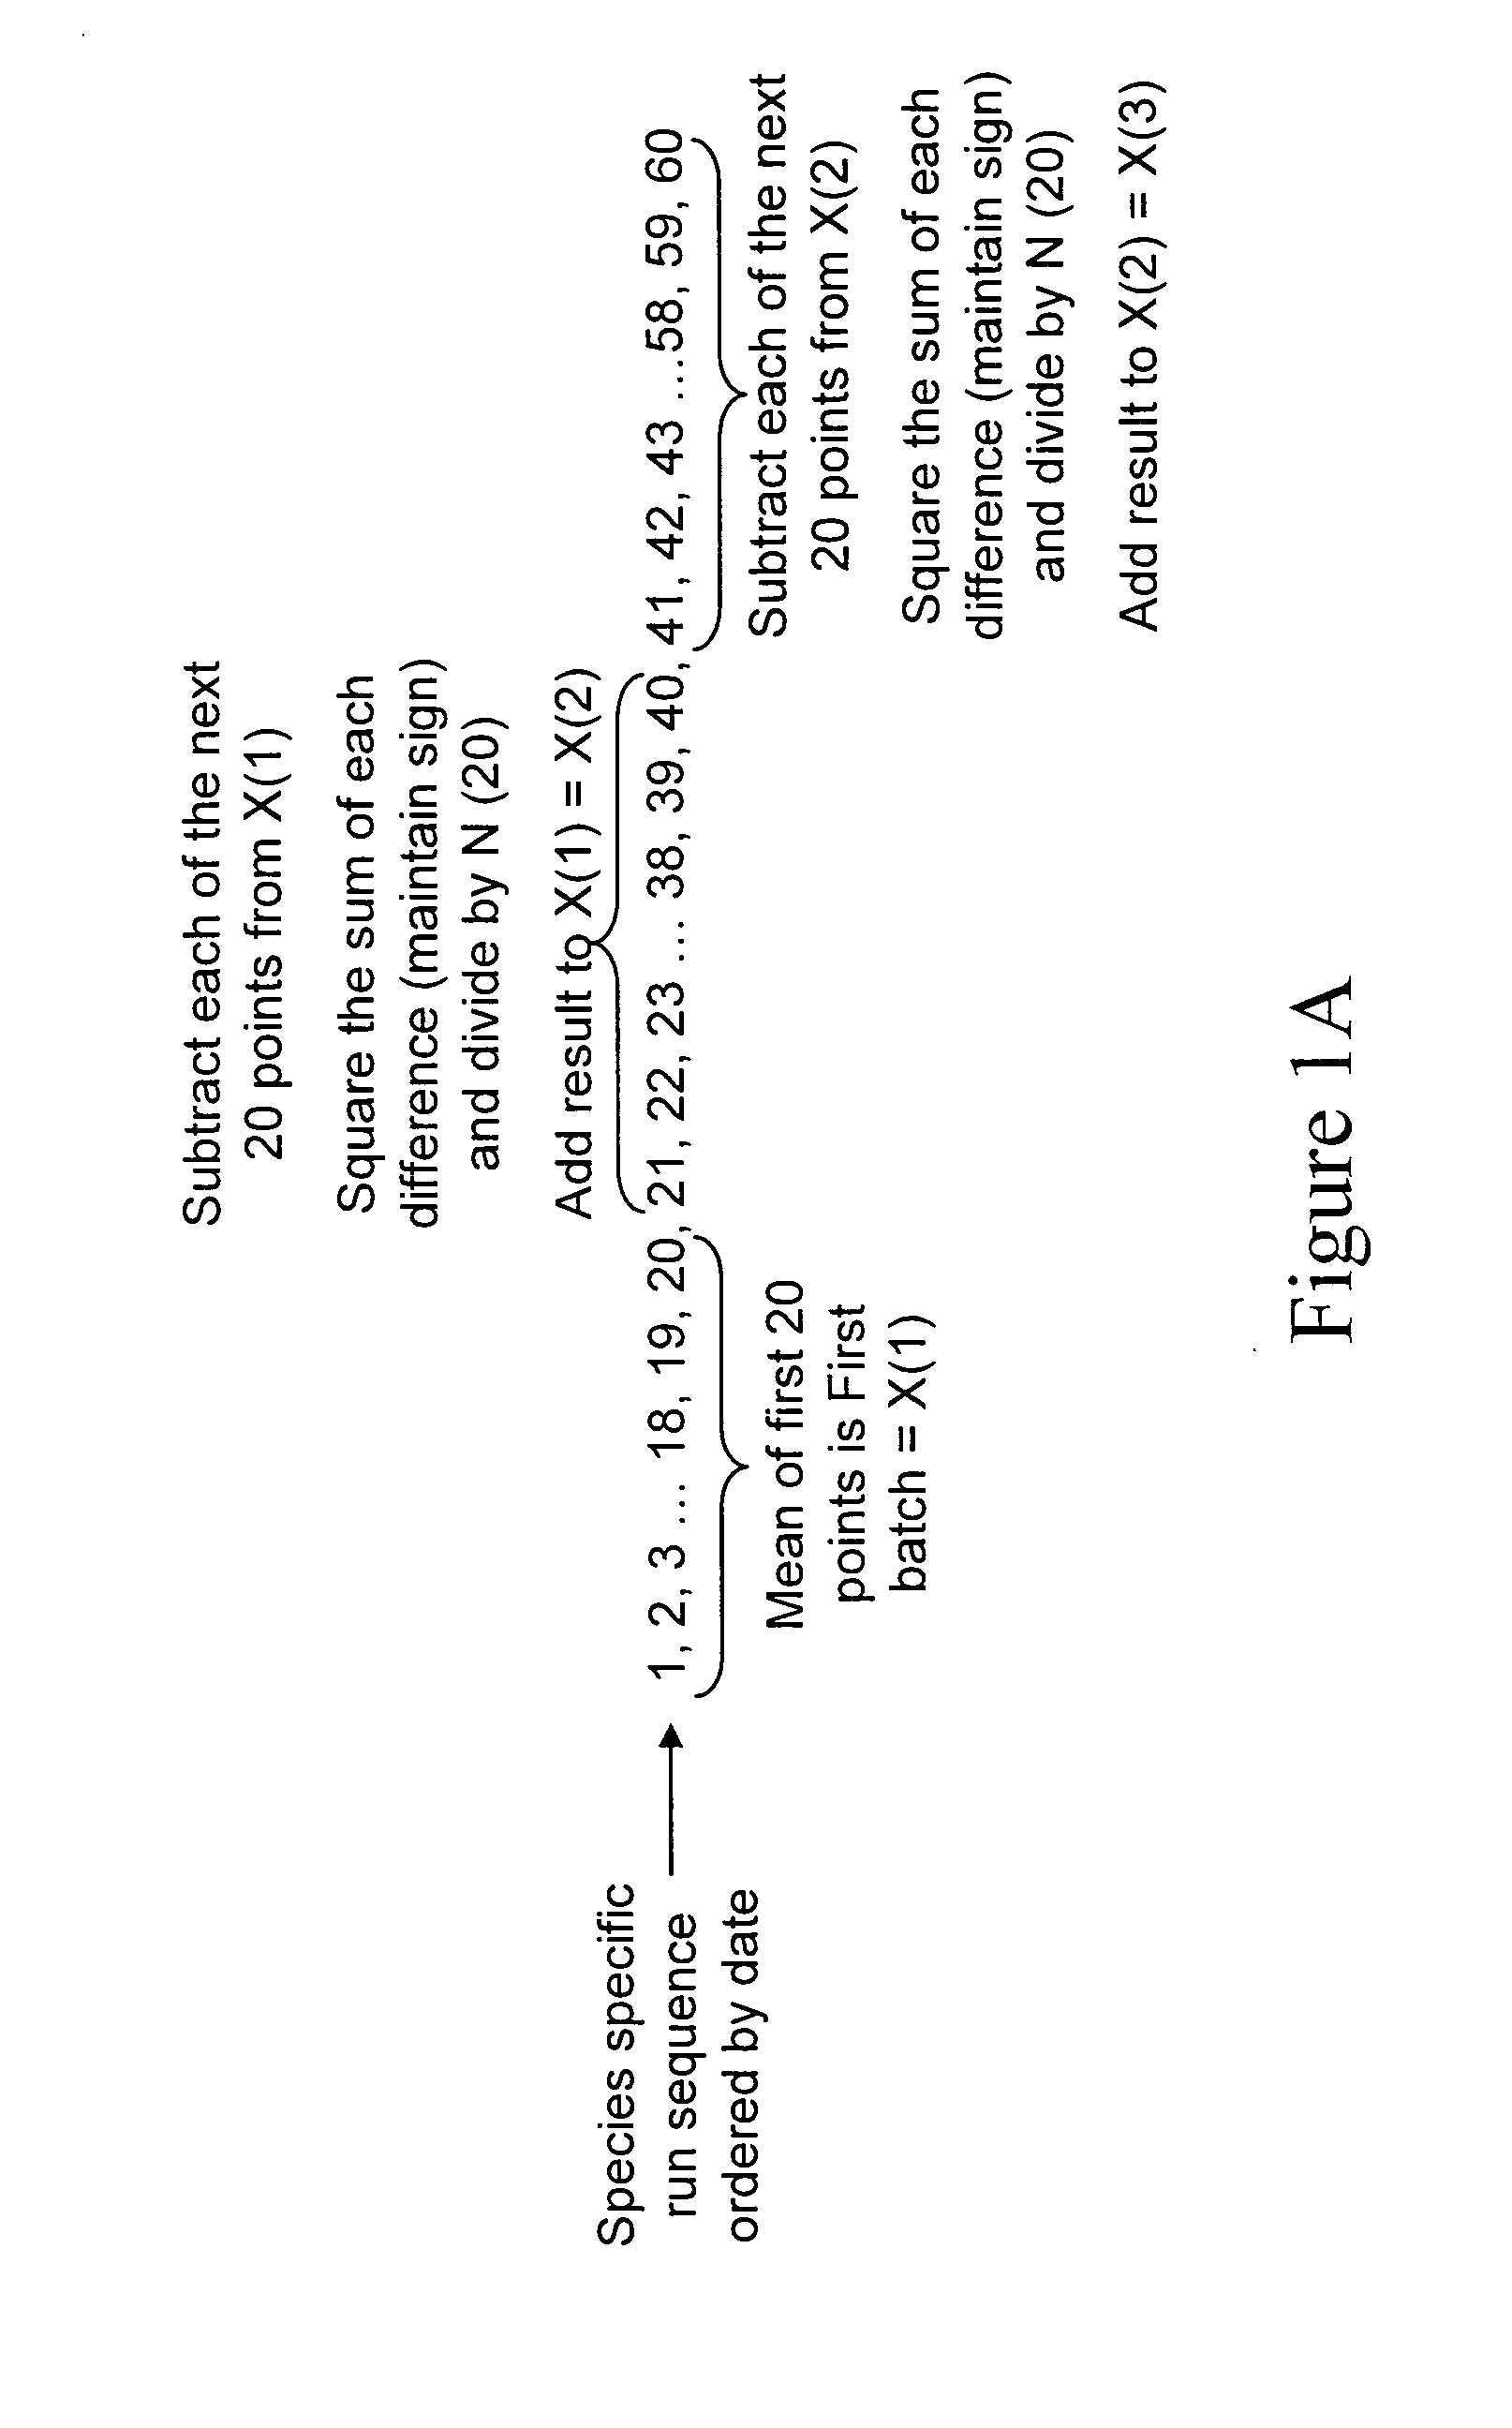
[0052]A preferred form of the method of the present invention, and system implementing the method, will now be described. In accordance with one form of the present invention, an automated method for calibrating in real time a diagnostic analyzer, such as a hematology analyzer, preferably includes the steps of receiving the diagnostic (e.g., hematology) results of patient samples calculated by the analyzer using the analyzer's pre-set parameters (such as optical gain, for example), and applying a weighted moving averages algorithm to the patient sample diagnostic results to obtain weighted averaged diagnostic results. The method further includes the steps of applying control chart rules to the weighted averaged diagnostic results, and creating from the control chart rules limits or ranges which are used to test the extent to which the weighted averaged diagnostic results reside within such limits or ranges. The method further includes the steps of comparing the weighted averaged dia...


PUM


Abstract

A method to track stability and performance of diagnostic instrumentation, especially for veterinary automated hematology analyzers, applies a weighted moving averages algorithm to the diagnostic results of patient samples calculated by the analyzer. Control chart rules are used to set limits or ranges in order to determine if weighted averaged diagnostic results are within or outside of such limits or ranges. If the weighted average diagnostic results are outside of such control chart rule limits, then fuzzy logic and a gradient descent algorithm are applied to the weighted averaged diagnostic results.

Description

CROSS-REFERENCE TO RELATED APPLICATIONS[0001]This application is related to U.S. Provisional Application Ser. No. 61 / 398,920, which was filed on Jul. 2, 2010, and is entitled “Automated Calibration Method and System for a Diagnostic Analyzer”, the disclosure of which is hereby incorporated by reference and on which priority is hereby claimed.BACKGROUND OF THE INVENTION[0002]1. Field of the Invention[0003]The present invention generally relates to diagnostic instruments for human and veterinary applications, and more specifically relates to methods and systems for calibrating such instruments.[0004]2. Description of the Prior Art[0005]Several studies have been published regarding patient-based quality assurance for automated analyzers. Subsets of these studies have demonstrated that patient-based results can provide information regarding analyzer performance (see, Ye J J, Ingels S C, and Parvin C A, “Performance Evaluation and Planning for Patient-Based Quality Control Procedures,” A...

Claims


Application Information

Patent Timeline
Patent Type & Authority Applications(United States)
IPC IPC(8): G06N7/02
CPCG01N2035/00702G01N35/00693
Inventor HAMMOND, JEREMY
Owner IDEXX LABORATORIES
Why Eureka
Try Eureka