

Cancer biomarkers
a biomarker and cancer technology, applied in the field of molecular classification of diseases, can solve the problems of significant morbidity, unneeded treatment and their associated side effects, and often different severity of side effects, and achieve the effects of improving predictive power, increasing likelihood of recurrence, and increasing the likelihood of recurren
- Summary
- Abstract
- Description
- Claims
- Application Information
AI Technical Summary
Benefits of technology
Problems solved by technology
Method used
Image

Examples
example 1
[0131]The following cell cycle gene (CCG) signature was tested for predicting time to chemical recurrence after radical prostatectomy.
31-CCG Prostate RecurrenceSignatureAURKABUB1CCNB1CCNB2CDC2CDC20CDC45LCDCA8CENPACKS2DLG7DTLFOXM1HMMRKIF23KPNA2MAD2L1MELKMYBL2NUSAP1PBKPRC1PTTG1RRM2TIMELESSTPX2TRIP13TTKUBE2CUBE2SZWINT
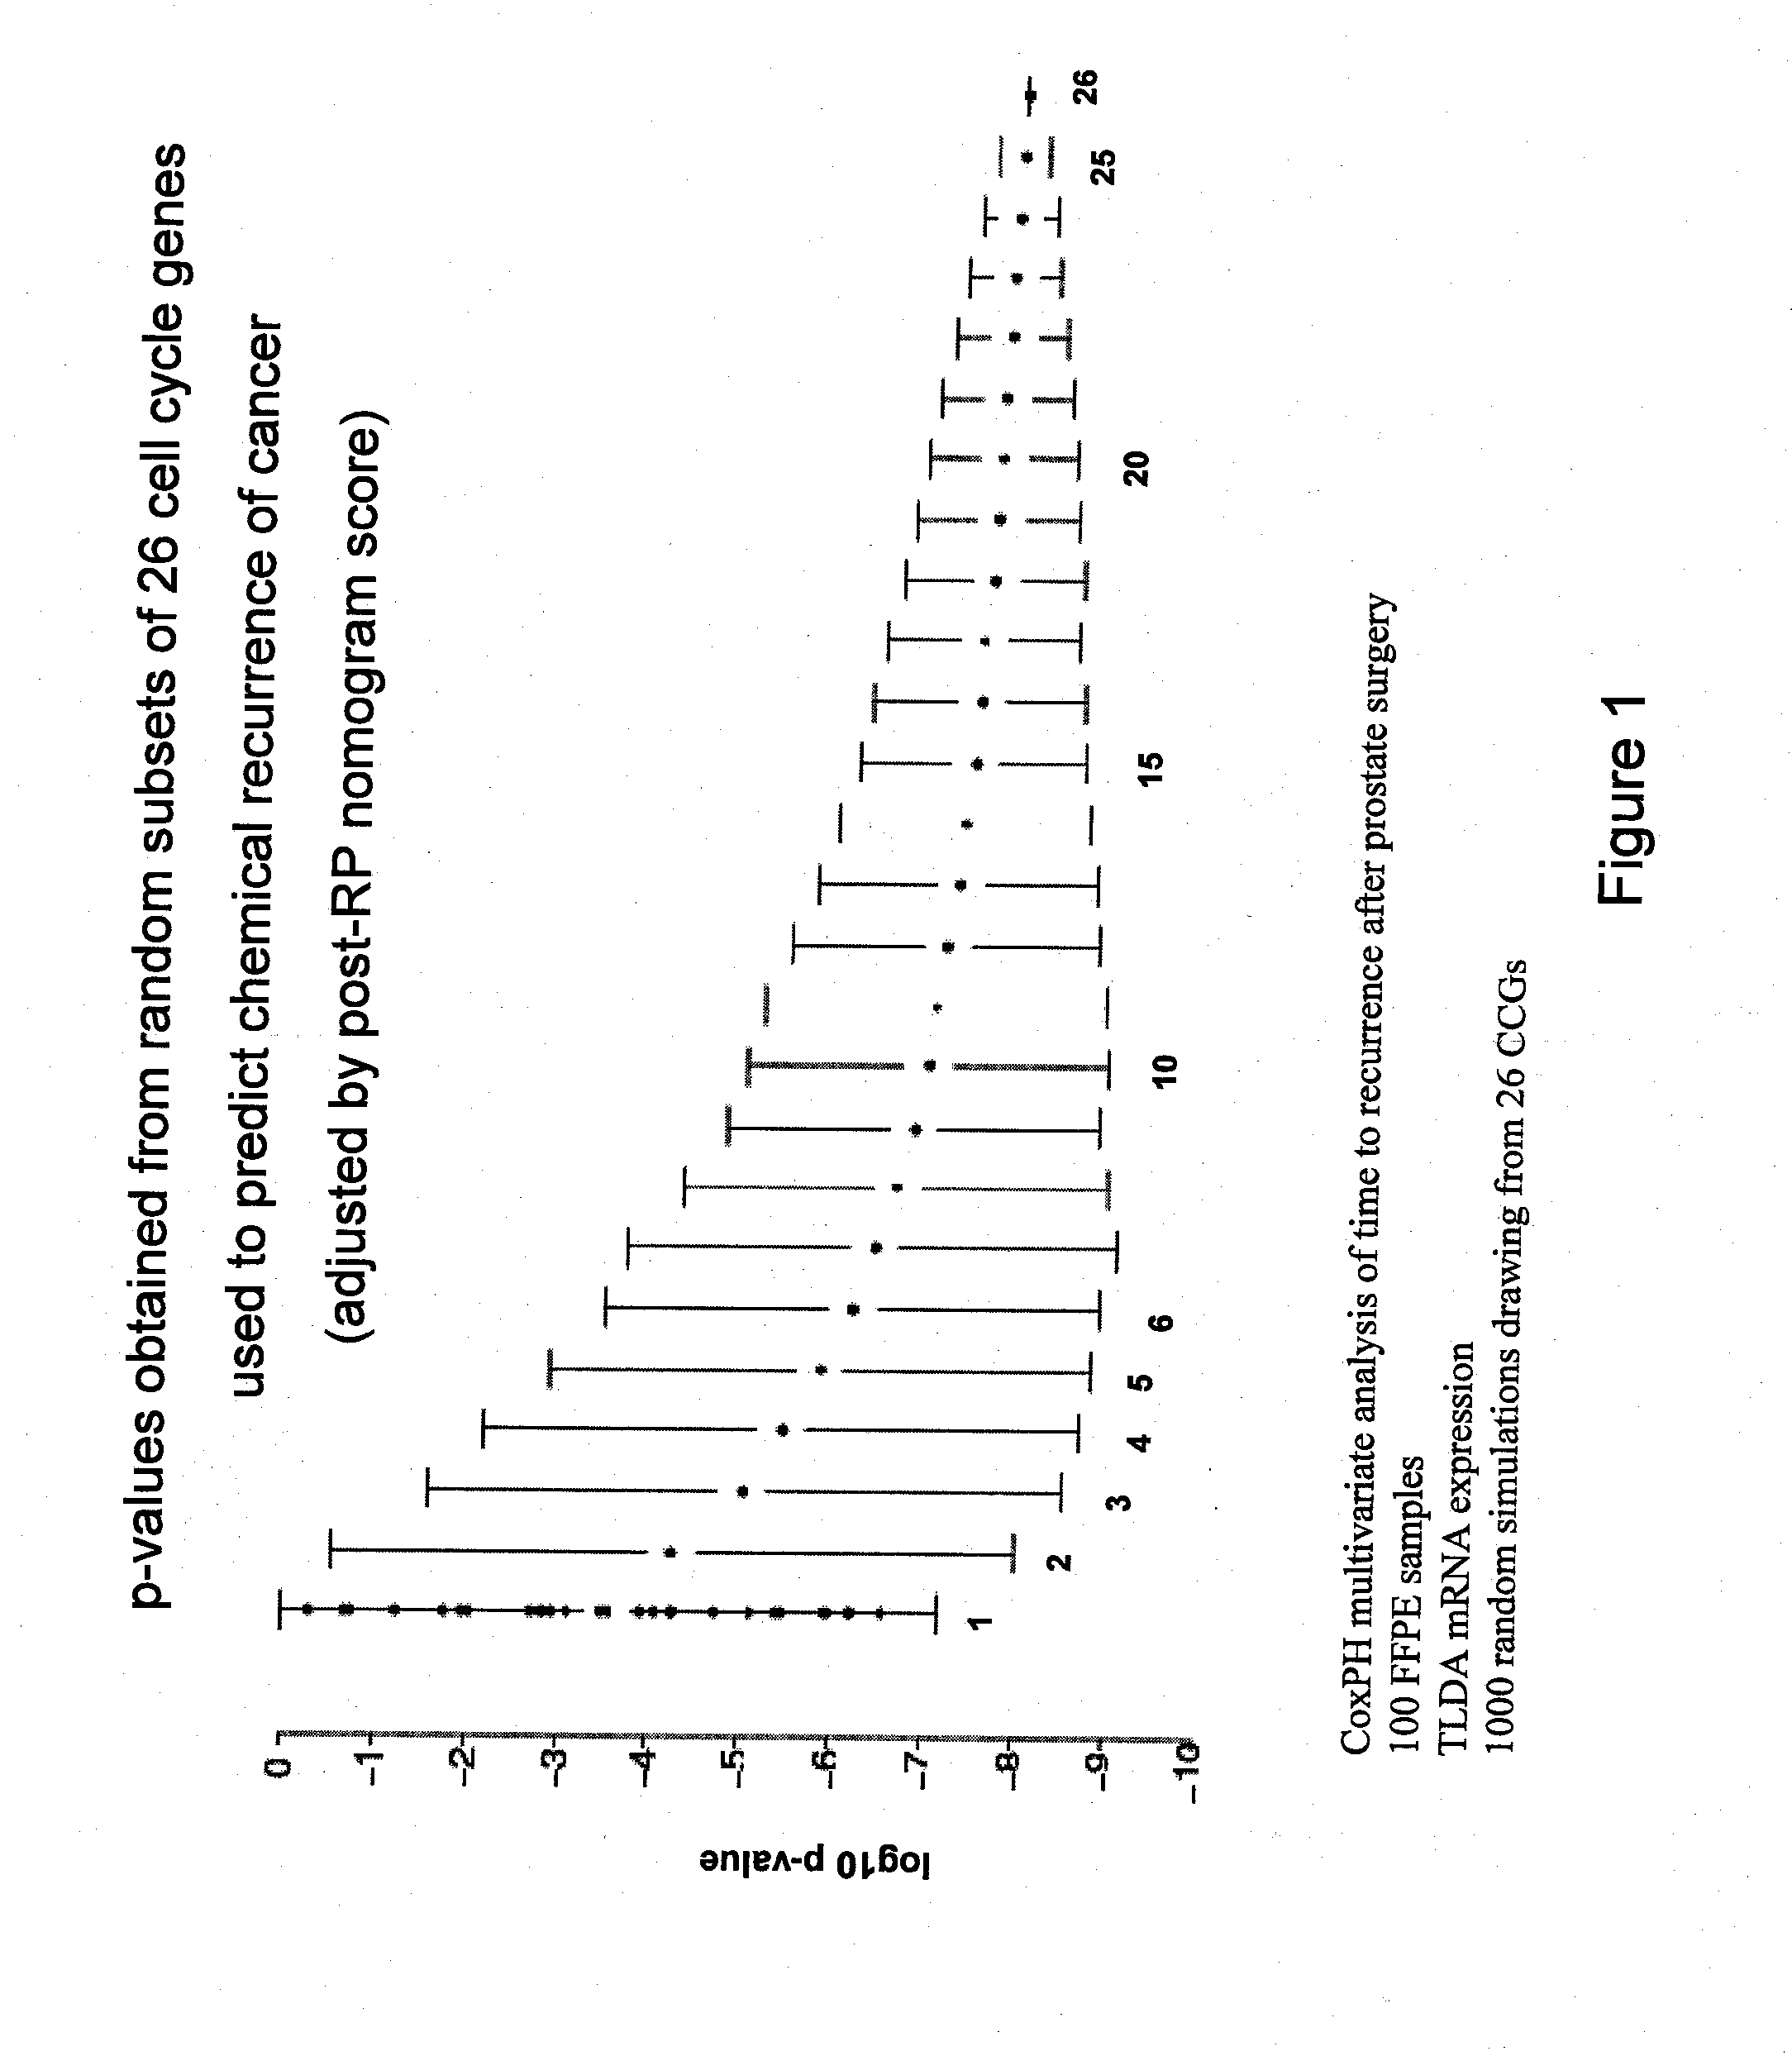
[0132]Mean mRNA expression for the above 31 CCGs was tested on 440 prostate tumor FFPE samples using a Cox Proportional Hazard model in Splus 7.1 (Insightful, Inc., Seattle Wash.). The p-value for the likelihood ratio test was 3.98×10⁻⁵.
[0133]The mean of CCG expression is robust to measurement error and individual variation between genes. In order to determine the optimal number of cell cycle genes for the signature, the predictive power of the mean was tested for randomly selected sets of from 1 to 30 of the CCGs listed above. This simulation showed that there is a threshold number of CCGs in a panel that provides significantly improved predictive power.
example 2
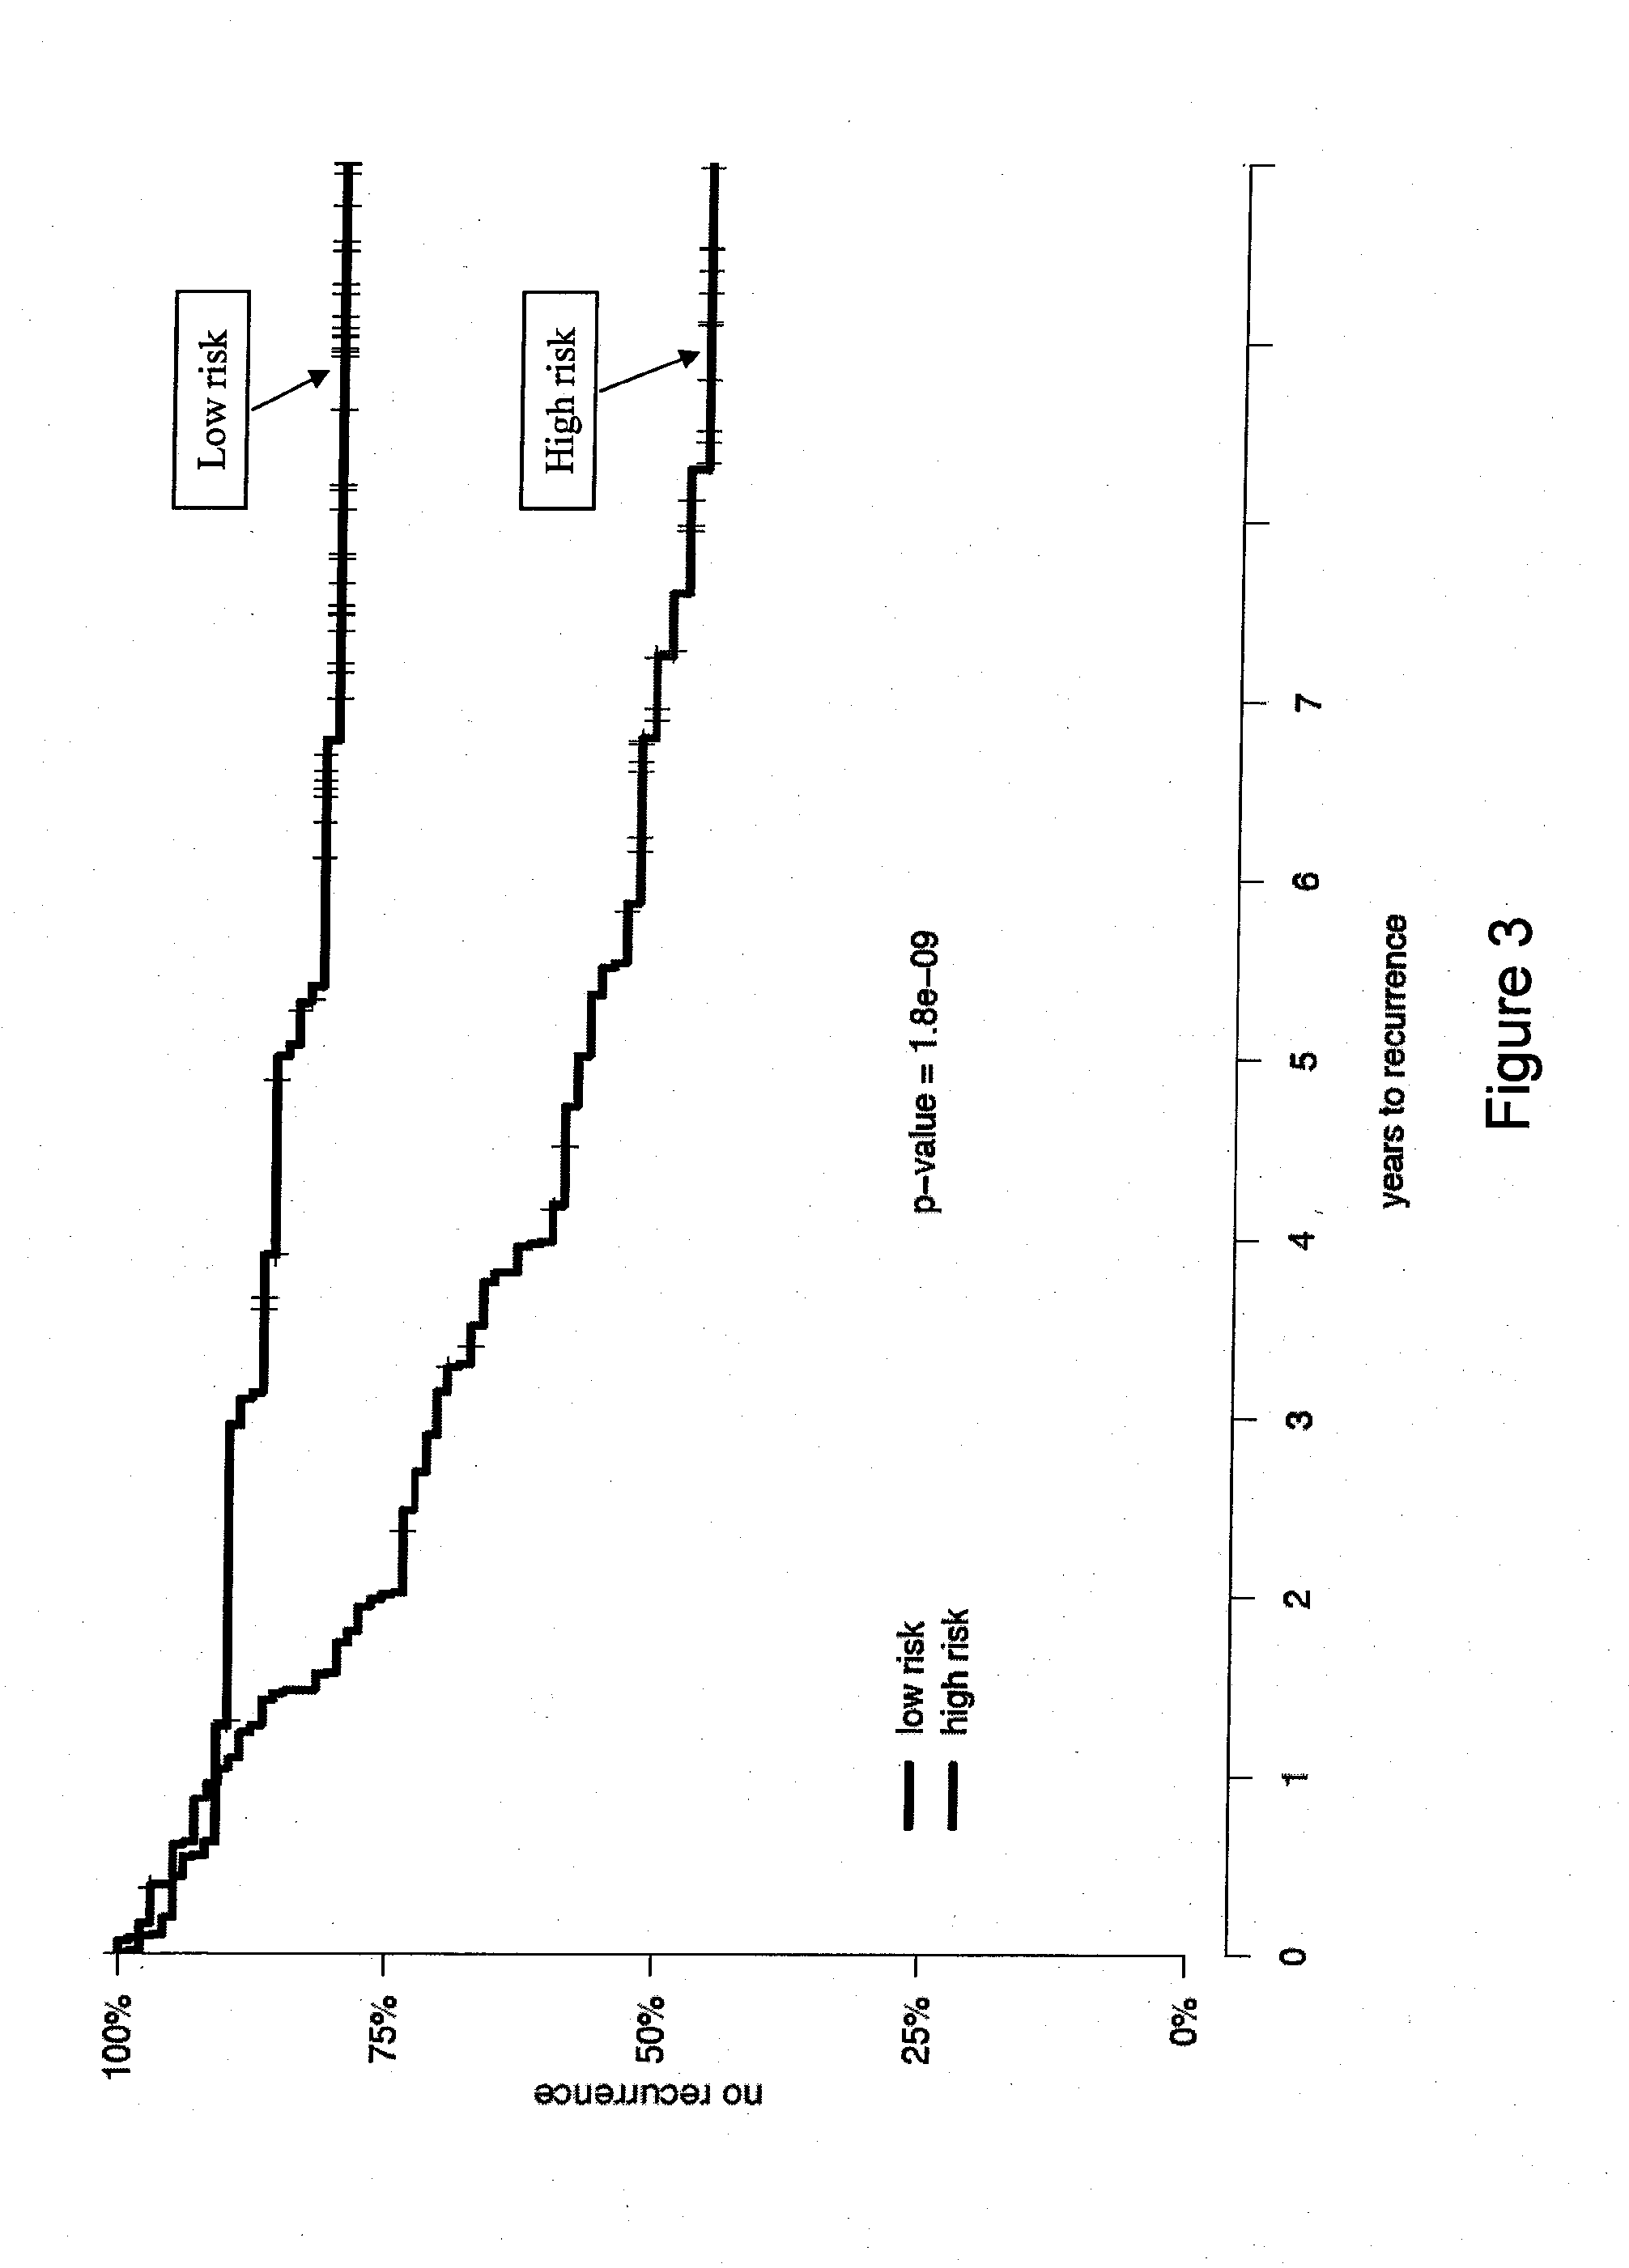
[0134]In a univariate analysis a set of 31 CCGs (Table 3) was found to be a significant predictor of biochemical recurrence (p-value=1.8×10⁻⁹) after RP in prostate cancer patients. This signature was further evaluated to determine whether it added to an established clinical nomogram for prostate cancer recurrence (the Kattan-Stephenson nomogram). In summary, the nomogram was a highly significant predictor of recurrence (p-value 1.6×10⁻¹⁰) and, after adjusting for the nomogram, the CCG signature was a significant predictor of biochemical recurrence (p-value 4.8×10⁻⁵, Table 6).
Patients and Methods
[0135]Eight hundred four consecutive RP patients were followed for a median of 9.5 years. The patient characteristics and the treatment outcomes of the entire cohort have been previously reported (Swanson et al., UROL ONCOL. (2007) 25:110-114). Tissue blocks and / or slides from the final pathological evaluation with enough tissue for analysis were available for 430 patients. The cohort was div...
example 3
[0142]The following study aimed at determining the optimal number of CCGs to include in the signature. As mentioned above, CCG expression levels are correlated to each other so it was possible that measuring a small number of genes would be sufficient to predict disease outcome. In fact, single CCGs from the 31-gene set in Table 3 (Panel C) add significantly to the Kattan-Stephenson nomogram, as shown in Table 9 below (after adjustment for the nomogram and an interaction term between the nomogram and CCG expression):
TABLE 9Genep-value*Genep-value*Genep-value*NUSAP12.8 × 10−7BUB18.3 × 10−5KPNA22.0 × 10−2DLG75.9 × 10−7PBK1.2 × 10−4UBE2C2.2 × 10−2CDC26.0 × 10−7TTK3.2 × 10−4MELK2.5 × 10−2FOXM11.1 × 10−6CDC45L7.7 × 10−4CENPA2.9 × 10−2MYBL21.1 × 10−6PRC11.2 × 10−3CKS25.7 × 10−2CDCA83.3 × 10−6DTL1.4 × 10−3MAD2L11.7 × 10−1CDC203.8 × 10−6CCNB11.5 × 10−3UBE2S2.0 × 10−1RRM27.2 × 10−6TPX21.9 × 10−3AURKA4.8 × 10−1PTTG11.8 × 10−5ZWINT9.3 × 10−3TIMELESS4.8 × 10−1CCNB25.2 × 10−5KIF231.1 × 10−2HMMR5...
PUM
| Property | Measurement | Unit |
|---|---|---|
| PSA | aaaaa | aaaaa |
| predictive power | aaaaa | aaaaa |
| physical | aaaaa | aaaaa |
Abstract
Description
Claims
Application Information