

Analytical Apparatus and Analytical Method
an analytical apparatus and a technology of an analytical apparatus, applied in the field of flow-type particle analysis method, can solve the problems of large size of the apparatus as a whole, high manufacturing cost, and inability to detect the shifting of the central wavelength (peak wavelength) of the fluorescen
- Summary
- Abstract
- Description
- Claims
- Application Information
AI Technical Summary
Benefits of technology
Problems solved by technology
Method used
Image

Examples
first embodiment
[0038]The following explains the present embodiment in which a spectral device and a multi detector are applied to a flow cytometer with reference to the accompanying drawings.
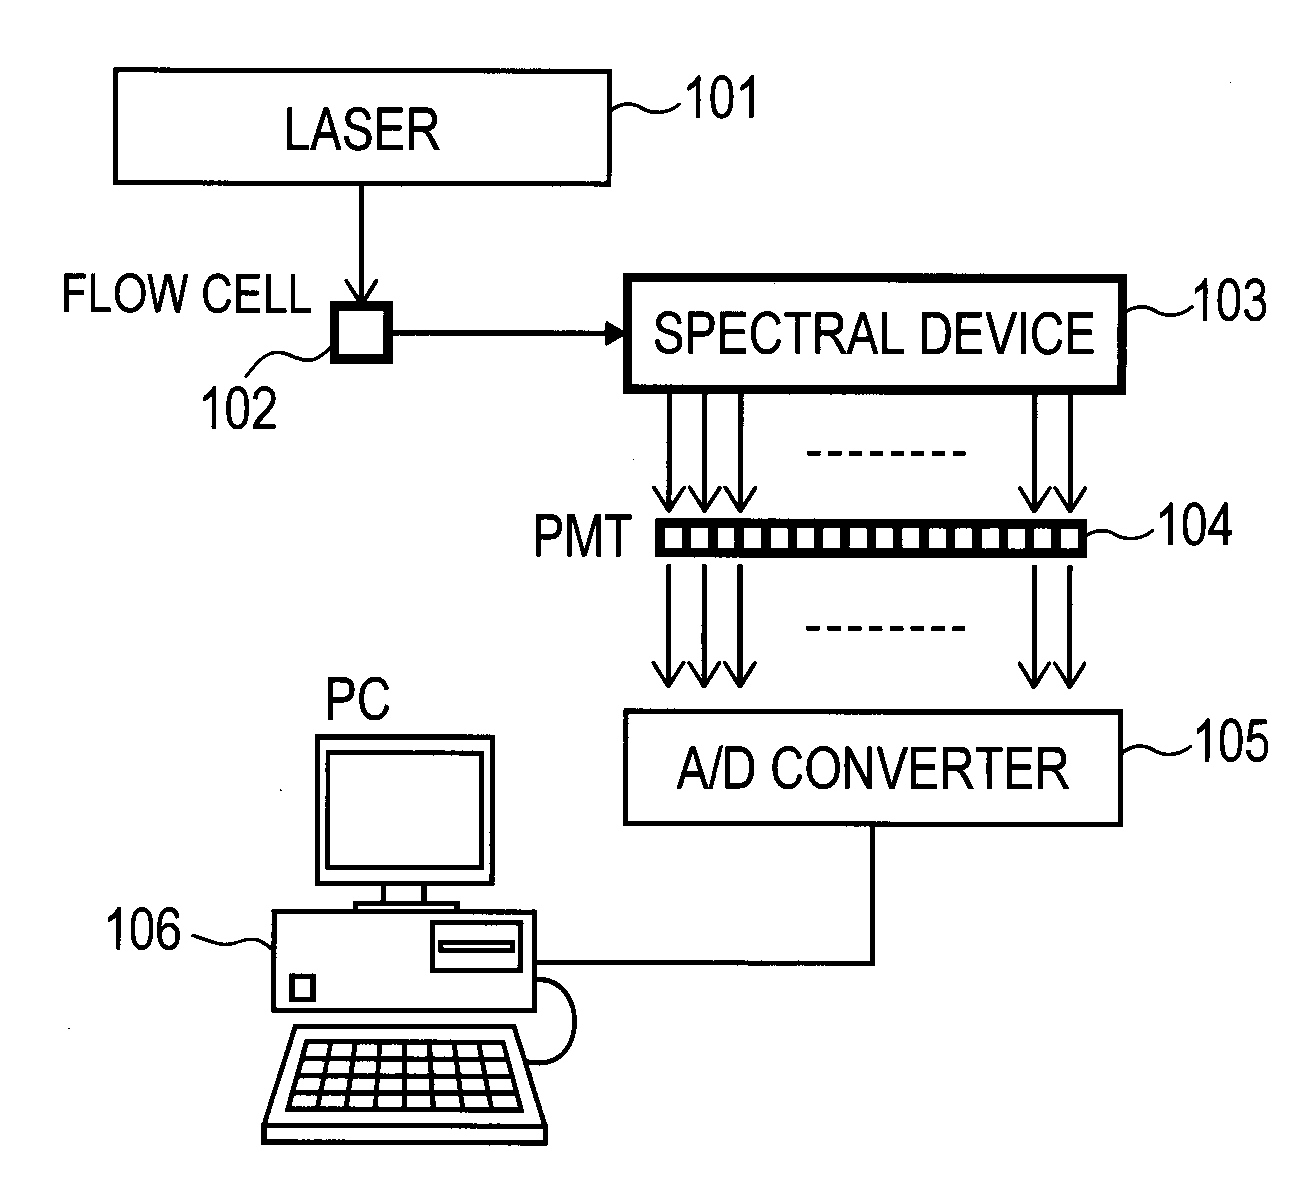
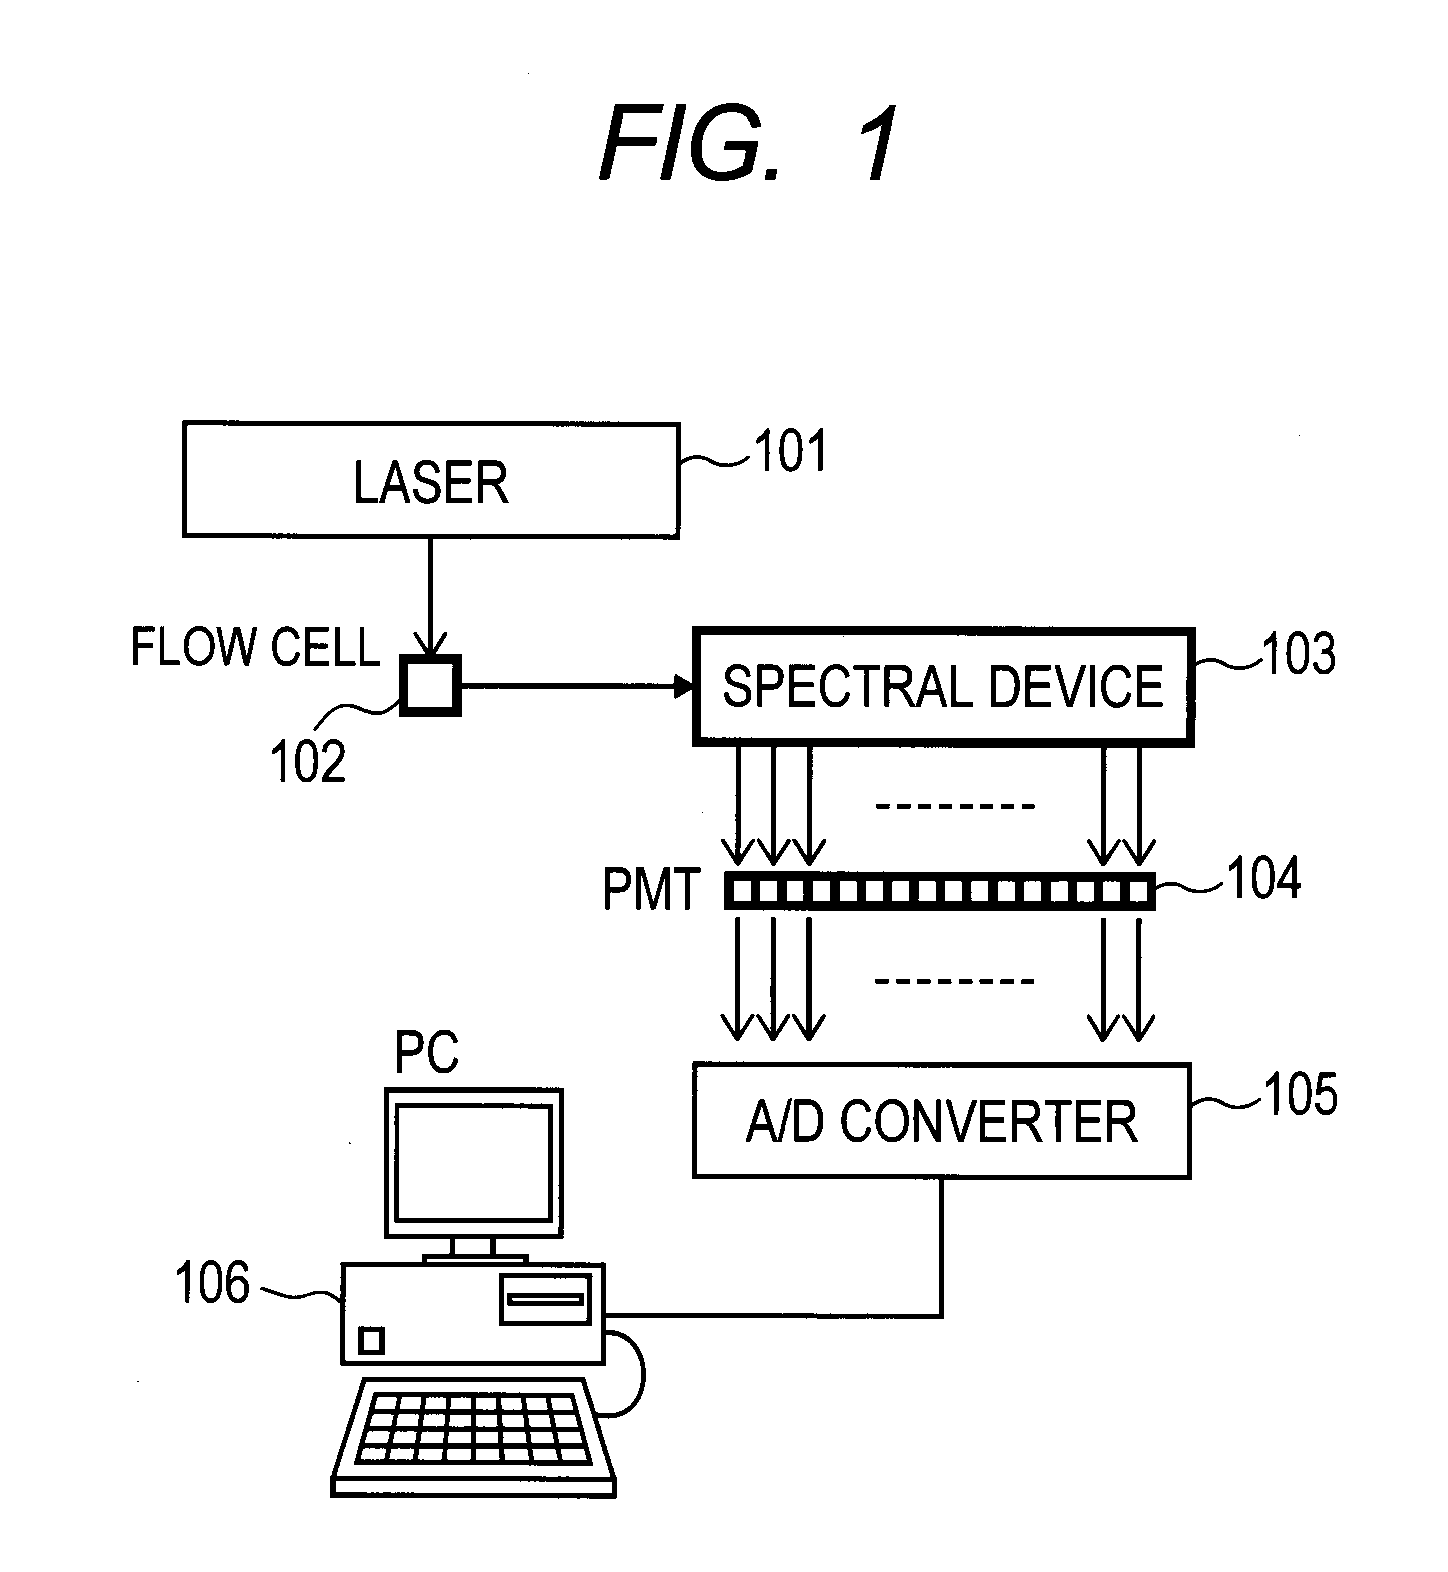
[0039]FIG. 1 is a schematic view of the flow cytometer. The solution (hereinafter, referred to as ‘analyte’) containing target particles preliminarily subjected to fluorescent label to be measured passes at a constant speed through a flow cell 102 from the top surface to the backside of the sheet in which
[0040]FIG. 1 is depicted. A laser beam emitted from a laser 101 is irradiated onto the flow cell 102. Upon the target particles passing through the flow cell 102, fluorochromes are excited by the laser beam so as to emit light. The emitted light is diffracted into a plurality of wavelength components with a spectral device 103 and the diffracted light is converted into electric signals with a plurality of PMTs. The electric signals outputted from the PMTS 104 are converted into digitalized signals with an A / D ...
second embodiment
[0098]In the present embodiment, another example of the method for calculating and displaying measured intensity information for the bands of wavelength at Step S140 of FIG. 5 explained in the first embodiment is described. The other steps are the same as those of the first embodiment, so that their explanations are omitted.
[0099]At Step S140, the intensities in the respective set bands are computed for the detected whole particles of the respective calibration samples. The intensities in the respective bands are calculated as the sum of the intensities (those measured by one channel of the PMT) of the wavelengths included in such respective bands. The calculated intensities in the respective bands are stored in the storing unit 210.
[0100]Then, in the band intensity information display area 400 of the display unit 240, a screen shown in FIG. 17 is displayed. In this screen, the distributions of the intensities in the respective bands of the selected calibration samples are retrieved...
third embodiment
[0105]In the third embodiment, another example of the method for calculating and displaying estimated measurement accuracy information at Step S170 of FIG. 5 explained in the first embodiment is described. The other steps are the same as those of the first embodiment, so that their explanations are omitted.
[0106]In FIG. 18, the detailed processing flow of Step S170 is shown according to the present embodiment, which processing is performed by the estimated measurement accuracy information calculation unit 270 shown in FIG. 6. To note, the following explanation is provided that it uses ‘m’ kinds of the calibration samples.
[0107]At Steps S401 to S405, the principal axes of the distributions of the intensities in the respective bands of the respective calibration samples as well as the reject rates are calculated. The reject rate is the proportion of the particles to be rejected by the cutoff value as noises. In the first place, at Step S401, ‘1’ is assigned to the variable indicating ...
PUM
 Abstract
Description
Claims
Application Information