Resistance biomarkers for HDAC inhibitors
- Summary
- Abstract
- Description
- Claims
- Application Information
AI Technical Summary
Benefits of technology
Problems solved by technology
Method used
Image
Examples
example 1
Definition and Calculation of S-Value
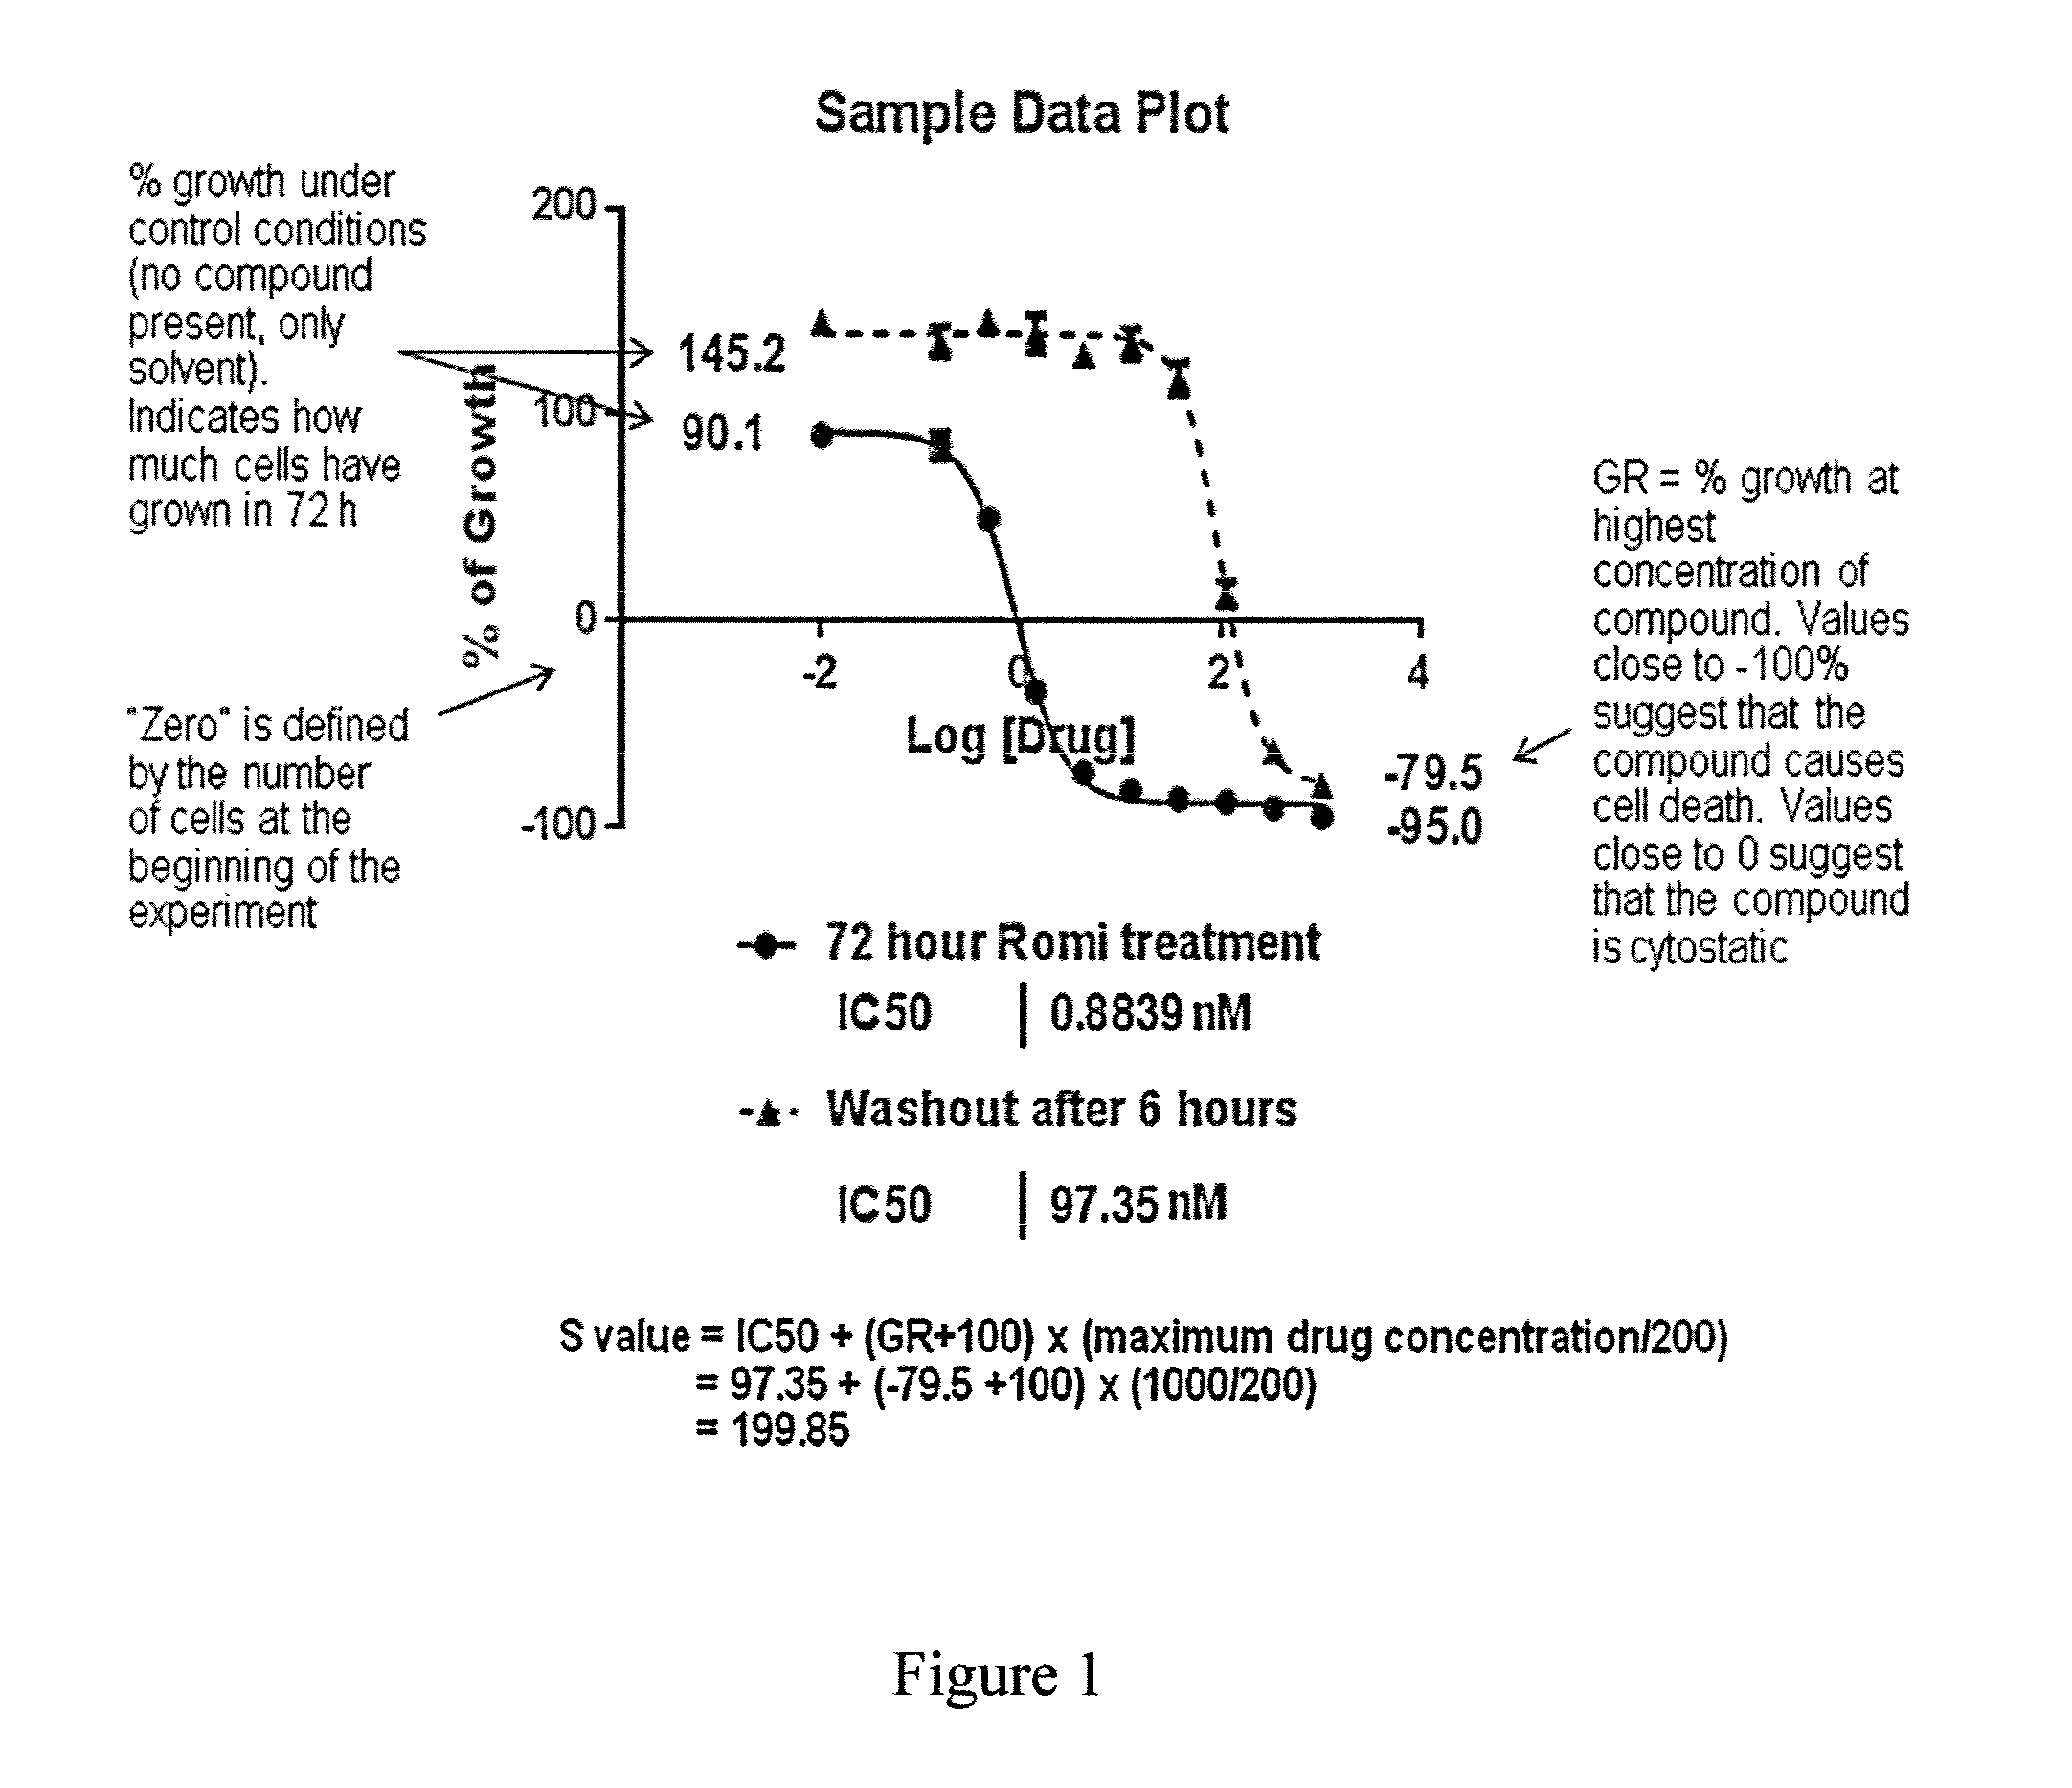
[0217]Sensitivity of cells to HDAC inhibitor treatment is expressed as their S-value (S), which is a dimensionless compound value generated by adding the values of IC50 and the growth rate (GR) at the maximum drug concentration used to determine the IC50. The term (maximum drug concentration / 200) is added in the equation below to achieve equal weighting of the S-value for IC50 and GR.
S=IC50+(GR+100)×(maximum drug concentration / 200)
See FIG. 1 for an example of an S value calculation and explanation of GR.
[0218]The S-Value is highly correlated with the Area Under the Curve (AUC) value obtained from inhibition vs. compound concentration graph, and these two values can be used interchangeably.
[0219]To determine cell growth IC50 and GR at a given drug concentration, growth was plotted against drug concentration as a percentage of the number of cells present at the beginning of the experiment. Cells were plated in 96-well plates and allowed to attach a...
example 2
Sensitivity to Romidepsin in Various Cell Lines
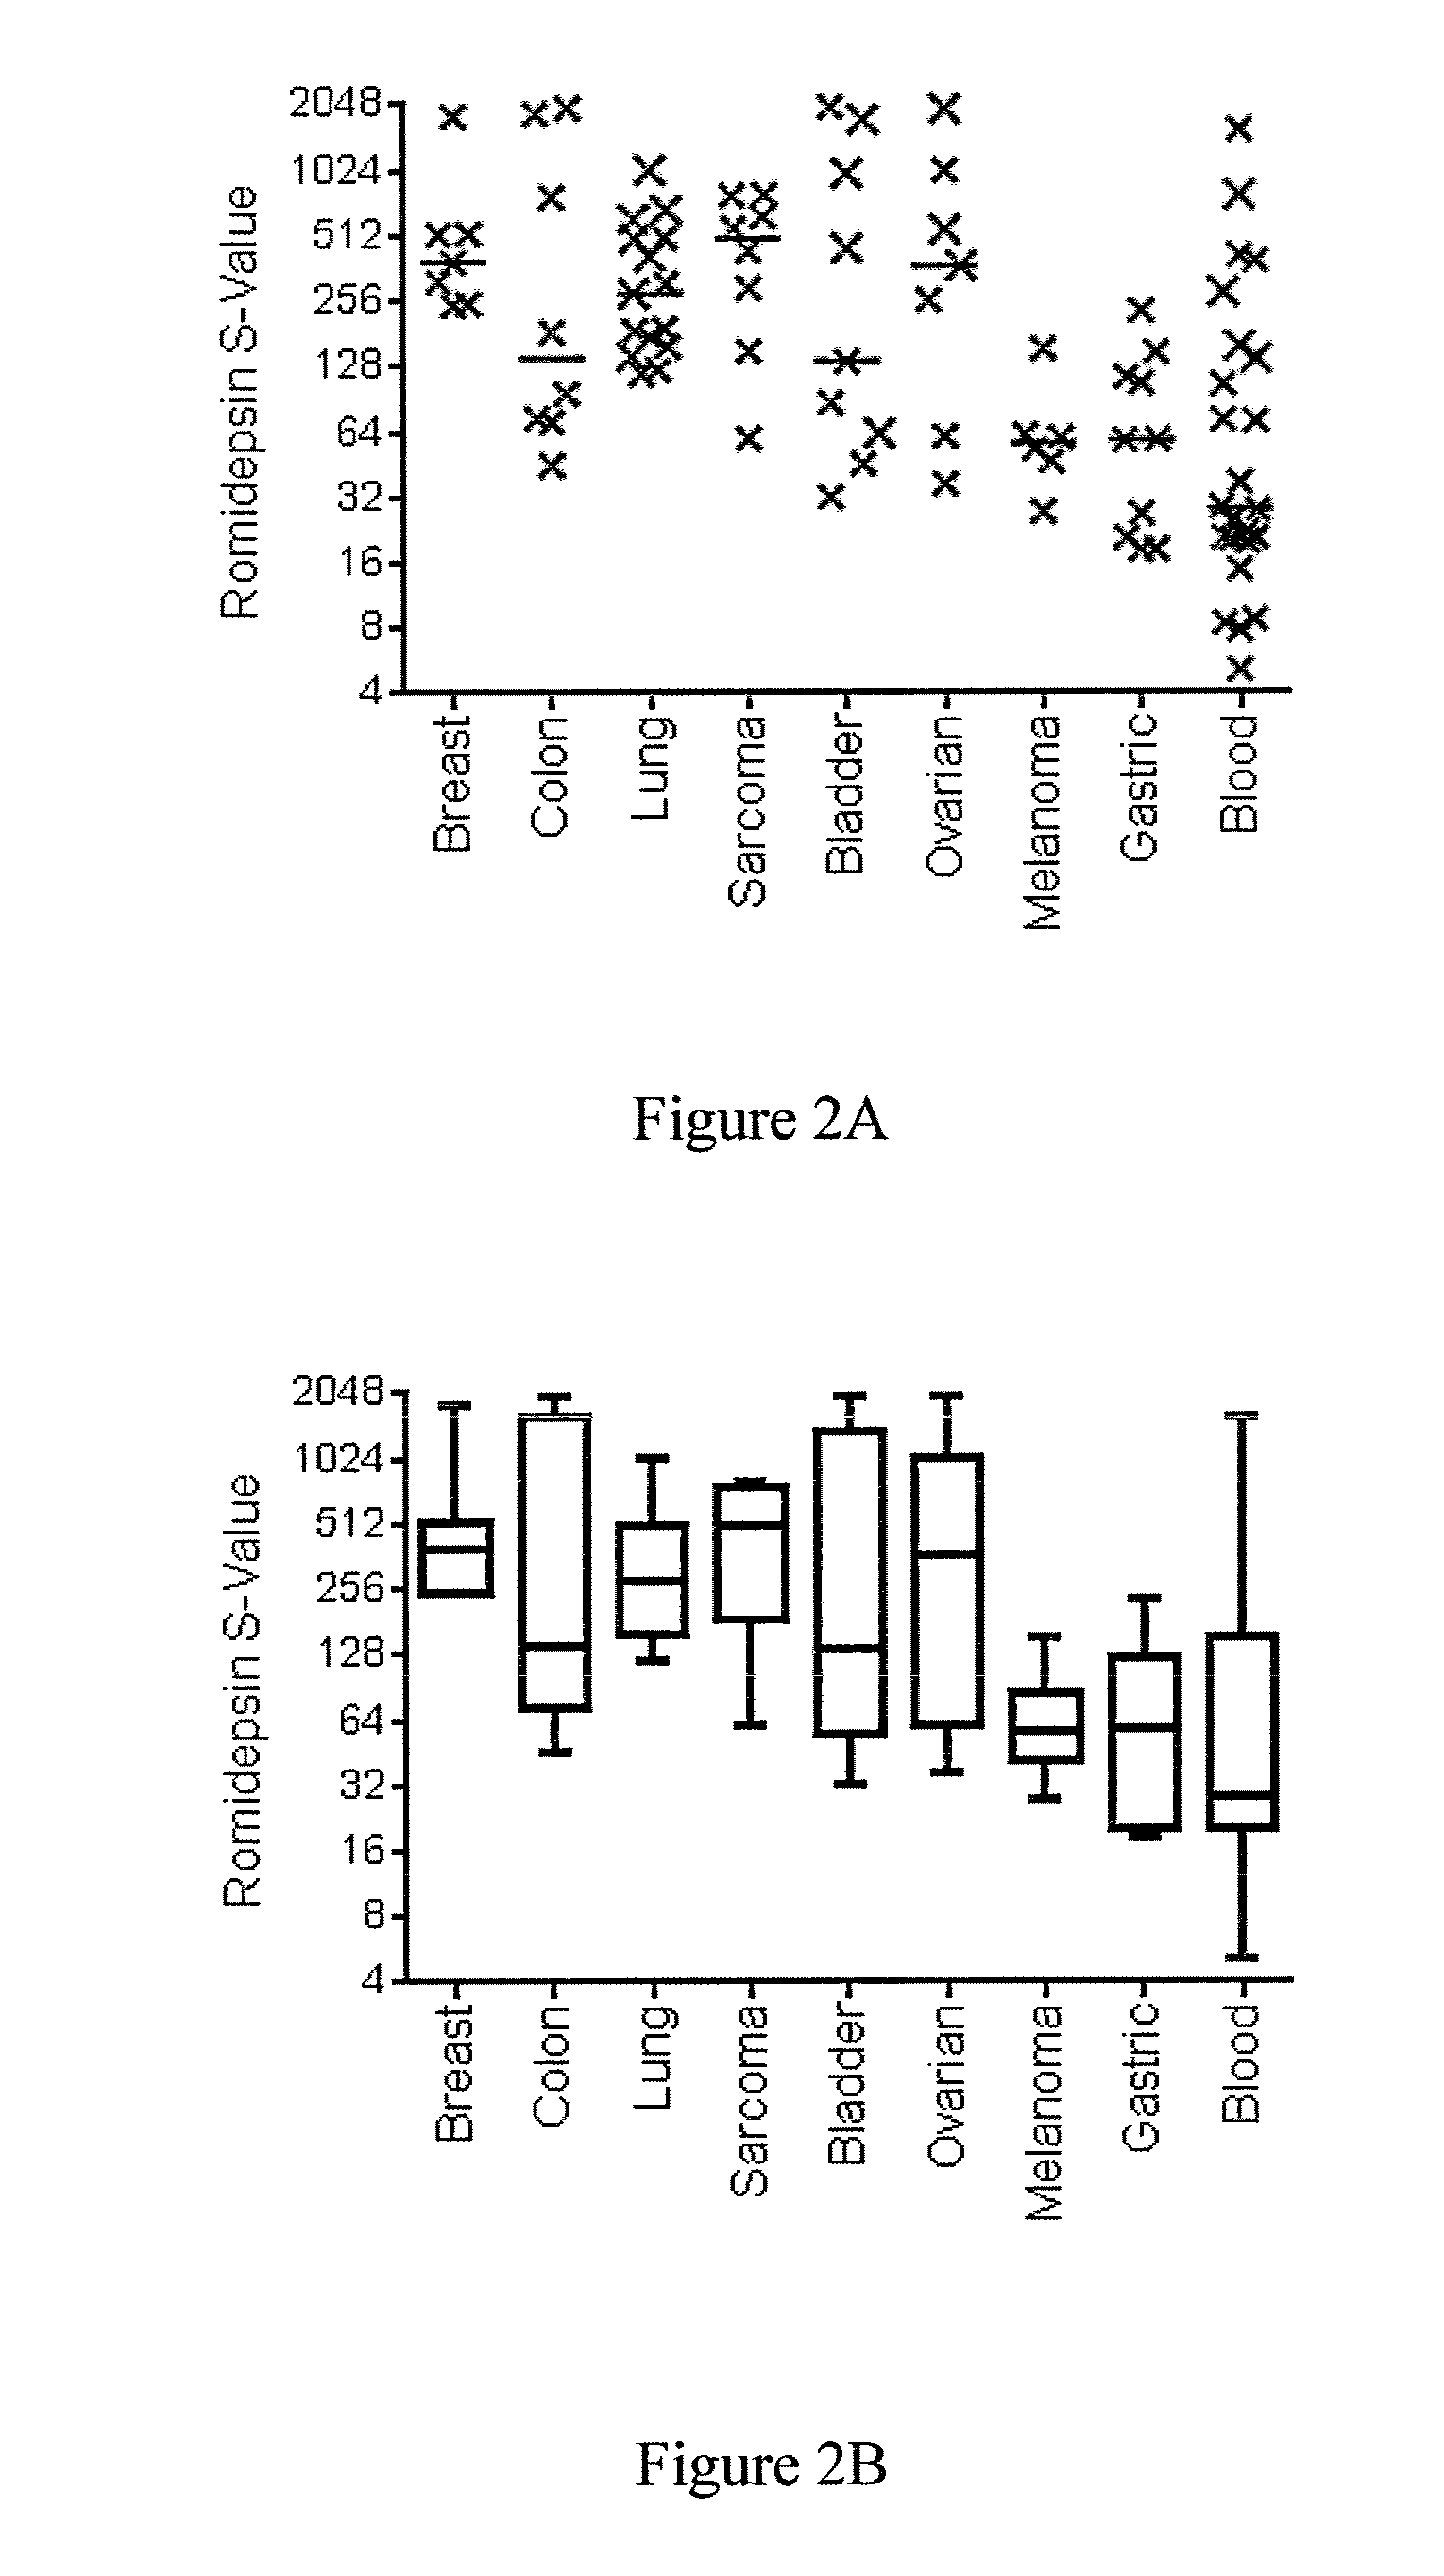
[0223]A cell line panel viability screen was used to compare the effects of a 6 hour and 72 hour treatment with romidepsin across a wide variety of cell lines. Although the majority of the tested cell lines showed sensitivity to romidepsin in the 72 hour assay, the 6 hour exposure revealed significant differences in sensitivity to romidepsin in various cell lines. The S-Value was computed for the 6 h treatment and ranged from 5 for the most sensitive cell lines to 2000 for the most resistant cell lines. The results are shown in FIGS. 2A and 2B. To identify genes whose expression correlated with sensitivity to HDAC inhibitor treatment, we applied two way ANOVA to select genes that were correlated with sensitivity. We used 24 solid tumor cell lines of breast, colon and ovary origin, since lines from these 3 tumor types had a large spread of S values, and identified 254 unique probes that were significantly different between these two grou...
example 3
TSPYL5 Expression Correlates with Resistance to Romidepsin in Cell Line Screen
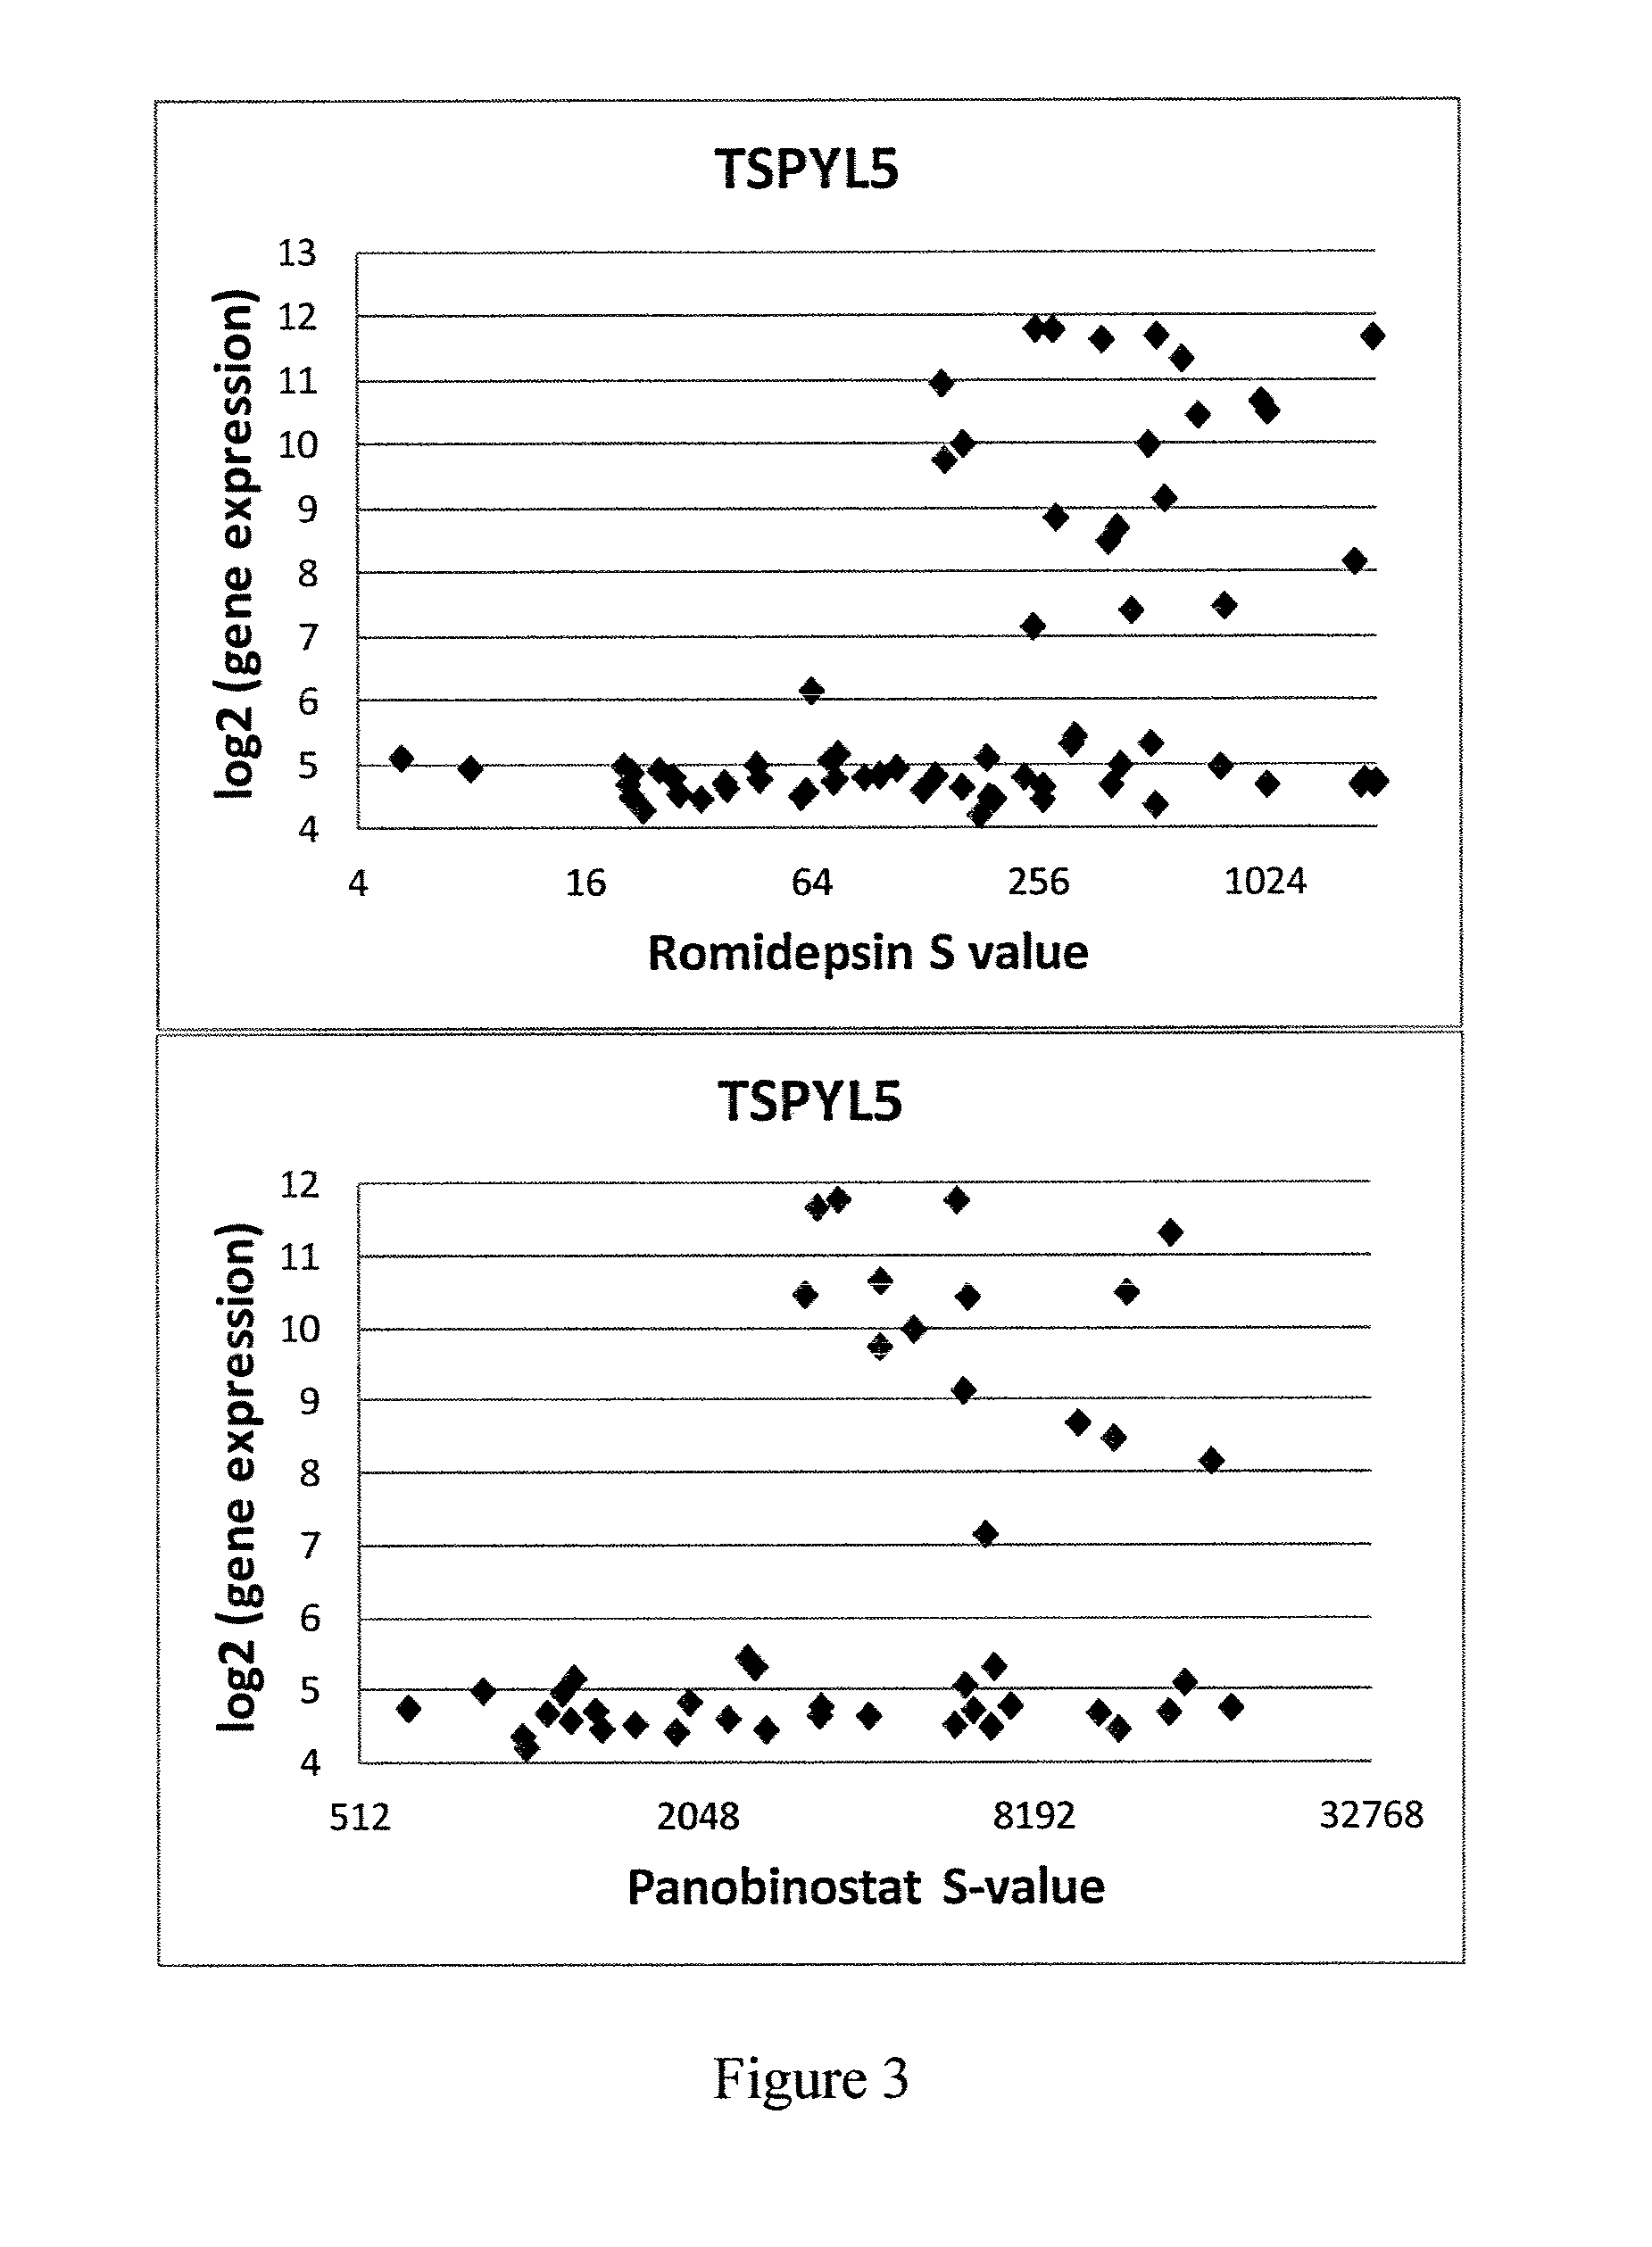
[0224]A cell line panel viability screen was used to compare the effects of romidepsin across a wide variety of cell lines and is shown in FIG. 3.
[0225]The data indicates that the expression of TSPYL5 correlated with resistance to romidepsin in the tested cell lines. It was demonstrated that no cell line expressing high levels of TSPYL5 was sensitive to treatment with romidepsin or panobinostat, while all cell lines sensitive to treatment with these two HDAC inhibitors had baseline expression of TSPYL5.
PUM
 Abstract
Description
Claims
Application Information
 - R&D
- Intellectual Property
- Life Sciences
- Materials
- Tech Scout
- Unparalleled Data Quality
- Higher Quality Content
- 60% Fewer Hallucinations
Browse by: Latest US Patents, China's latest patents, Technical Efficacy Thesaurus, Application Domain, Technology Topic, Popular Technical Reports.
© 2025 PatSnap. All rights reserved.Legal|Privacy policy|Modern Slavery Act Transparency Statement|Sitemap|About US| Contact US: help@patsnap.com


