
System For Improved Interpretation of Physiological Data and Presentation of Physiological Condition Management Information

a technology for managing information and physiological data, applied in the field of system for improving interpretation of physiological data and presentation of physiological condition management information, can solve the problems of cumbersome user interpretation and decision, difficult graphical, tabular or numerical display of measured physiological data (e.g., blood glucose measurement from a cgm), user interpretation, etc., to facilitate managing a physiological condition, easy to understand and user-friendly

Active Publication Date: 2014-12-25
BECTON DICKINSON & CO
View PDF5 Cites 62 Cited by
  • Summary
  • Abstract
  • Description
  • Claims
  • Application Information

AI Technical Summary

Benefits of technology

The present invention provides a method and system for managing a physiological condition by measuring physiological data parameters, interpreting them, and outputting the information in an easy-to-comprehend and user-friendly way. This can help users understand and manage their physiological condition better.

Problems solved by technology

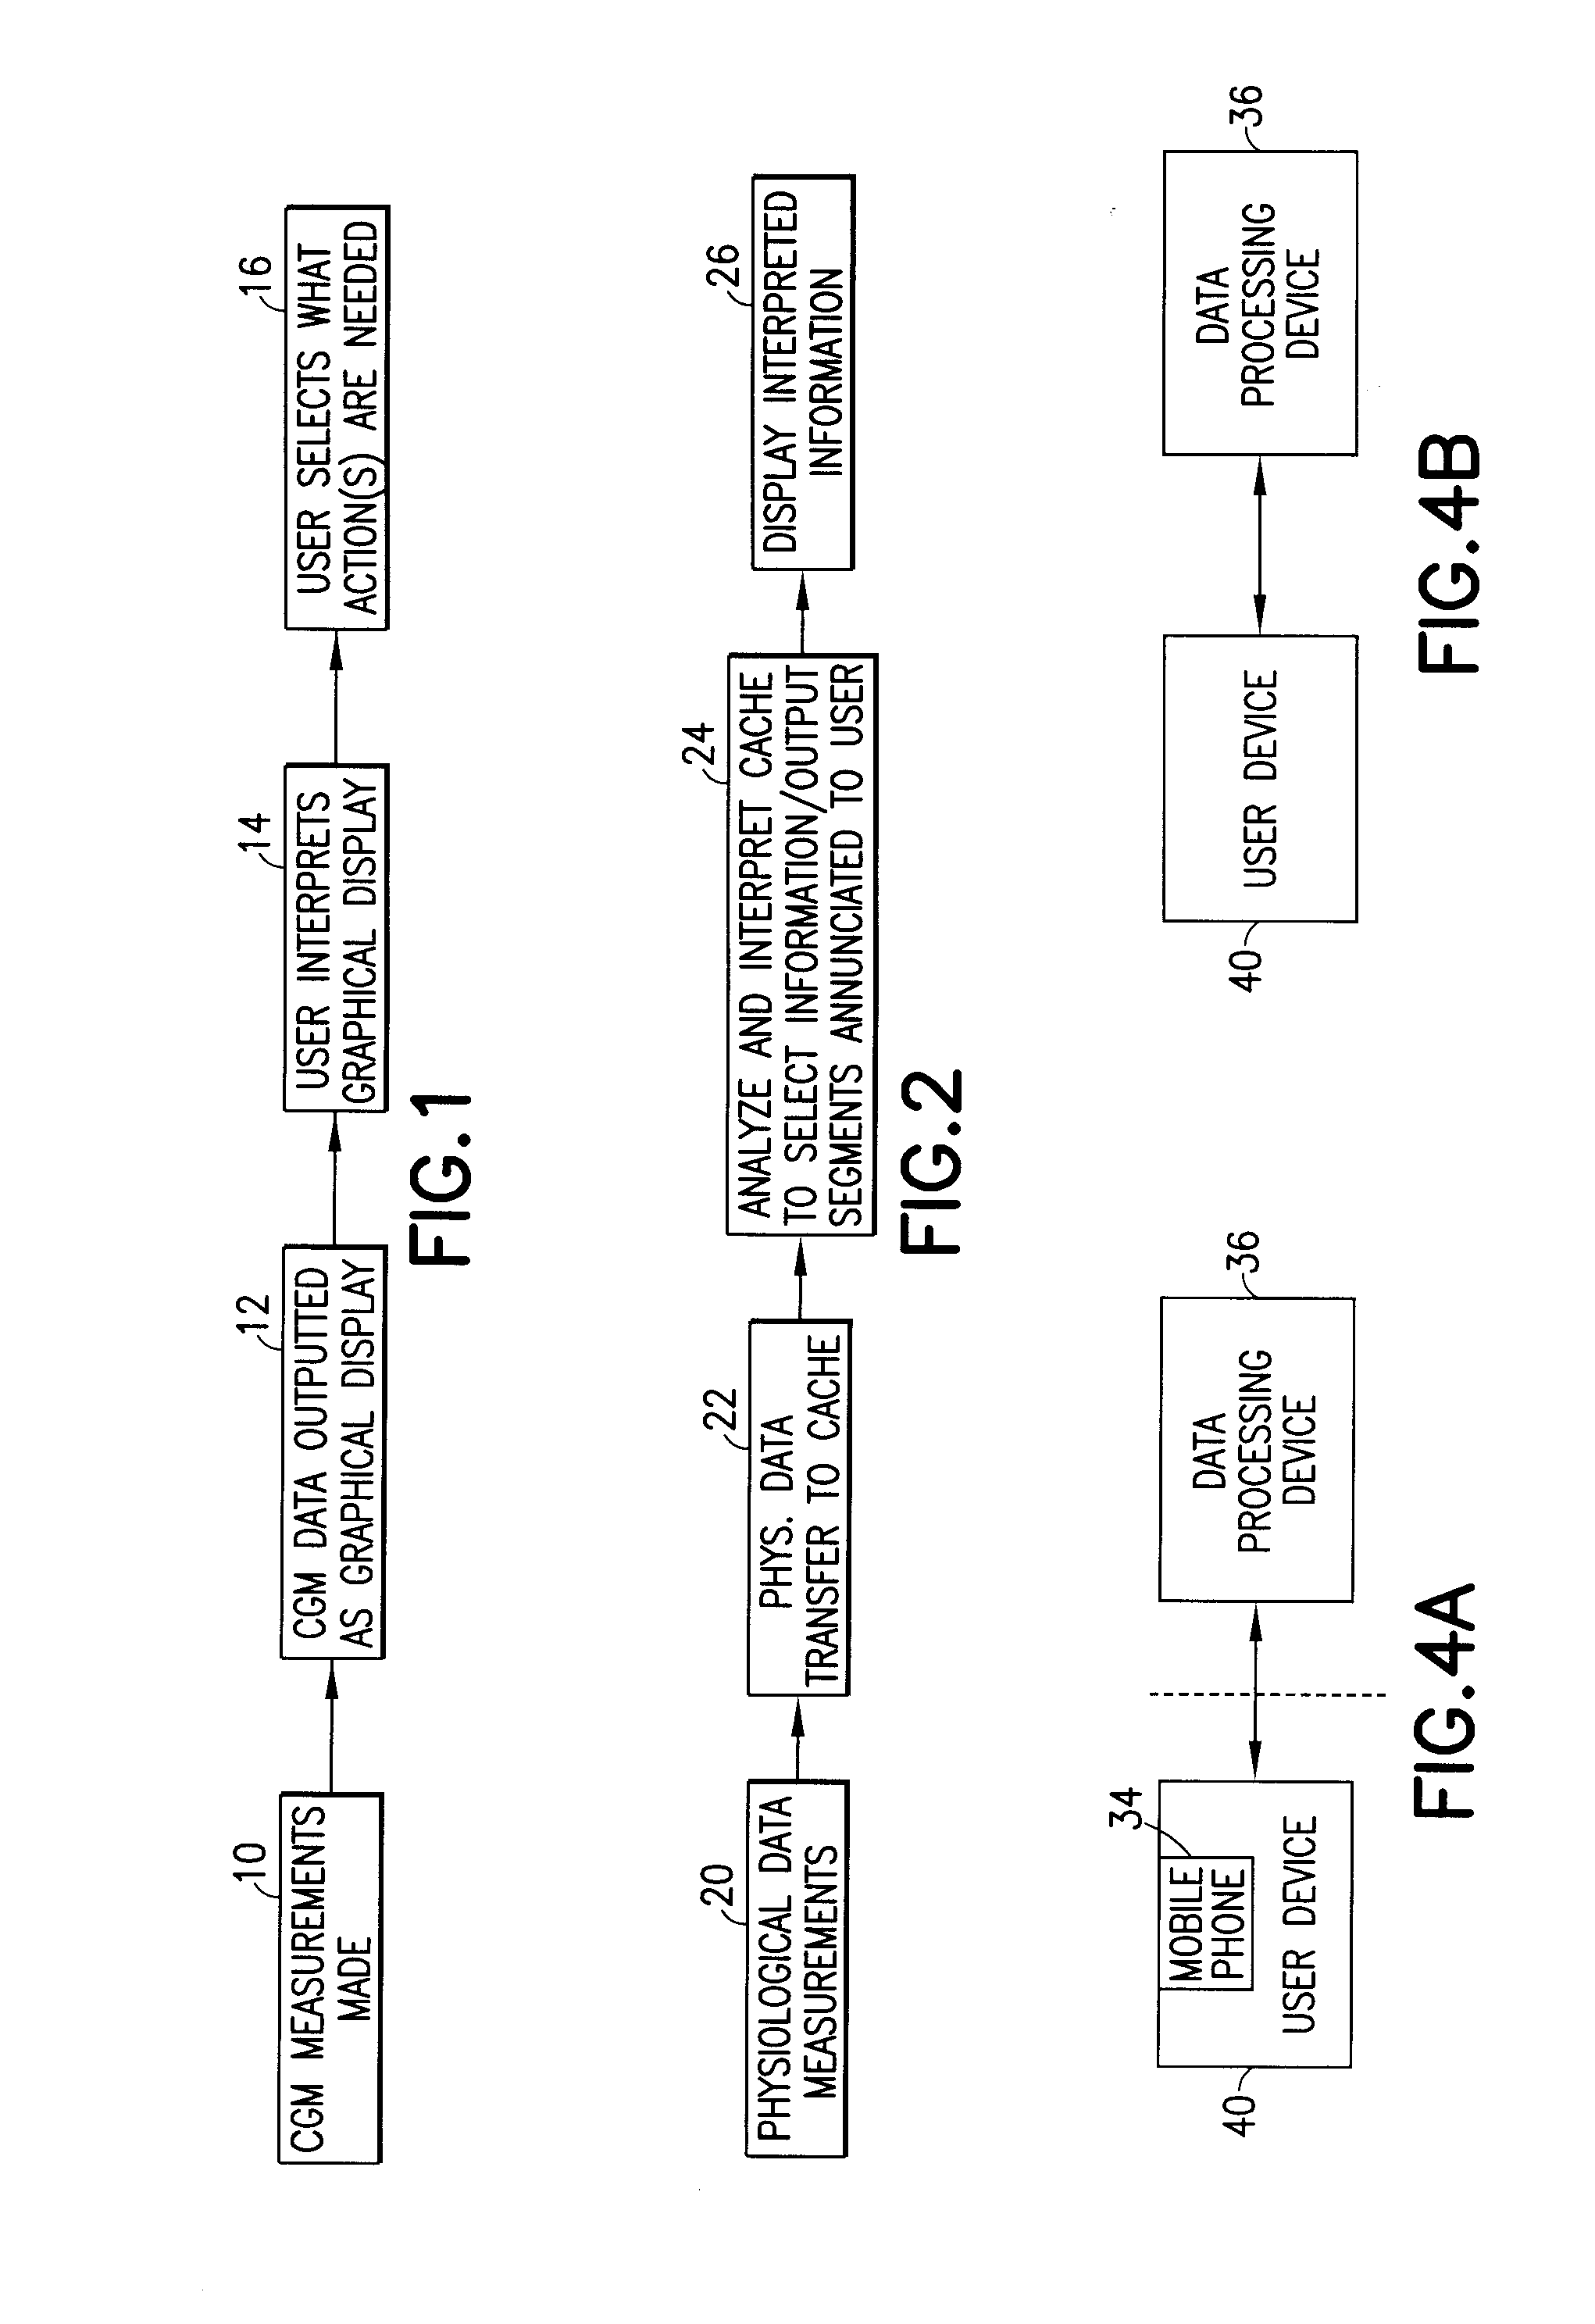
Nonetheless, the graphical, tabular or numerical display of measured physiological data (e.g., blood glucose measurements from a CGM) is difficult and, in many cases, cumbersome for a user to interpret and decide what action(s) is needed to manage a physiological condition, as depicted in blocks 14 and 16 of FIG. 1.
Further, even relatively simple alphanumeric displays such as the device screens depicted in FIGS. 6A-6D of U.S. Pat. No. 7,022,072 can be difficult for a user to interpret, that is, specific outlier data (e.g., measured values outside a threshold) are merely reported, but no user-friendly information is provided to indicate, for example, what the outlier data signifies about the user's monitored physiological condition or how such data can be mitigated.
In existing physiological condition monitors or measuring devices, measured physiological data is merely presented as data, leaving the user with the difficult task of interpreting what the data means.
The majority of T1D Exchange participants are reluctant to download and view their data because it takes too much time and they do not receive meaningful information from the data.
T1D Exchange participants find the data simply too difficult to interpret and use in a meaningful manner and prefer to manage their diabetes test by test, injection by injection, relying instead on their healthcare provider to advise them when they need to make significant changes to their diabetes management regimens.
The display of more monitored data, even if done in an attractive graphical manner, does not necessarily make that data useful to a healthcare provider, particularly in a critical care setting such as an OR or ICU.
Some form of interpretation of that data is often needed, and the cognitive load on the practitioner actually increases with added data.

Method used


Image

  • System For Improved Interpretation of Physiological Data and Presentation of Physiological Condition Management Information
  • System For Improved Interpretation of Physiological Data and Presentation of Physiological Condition Management Information
  • System For Improved Interpretation of Physiological Data and Presentation of Physiological Condition Management Information

Examples


Embodiment Construction

[0031]Overview

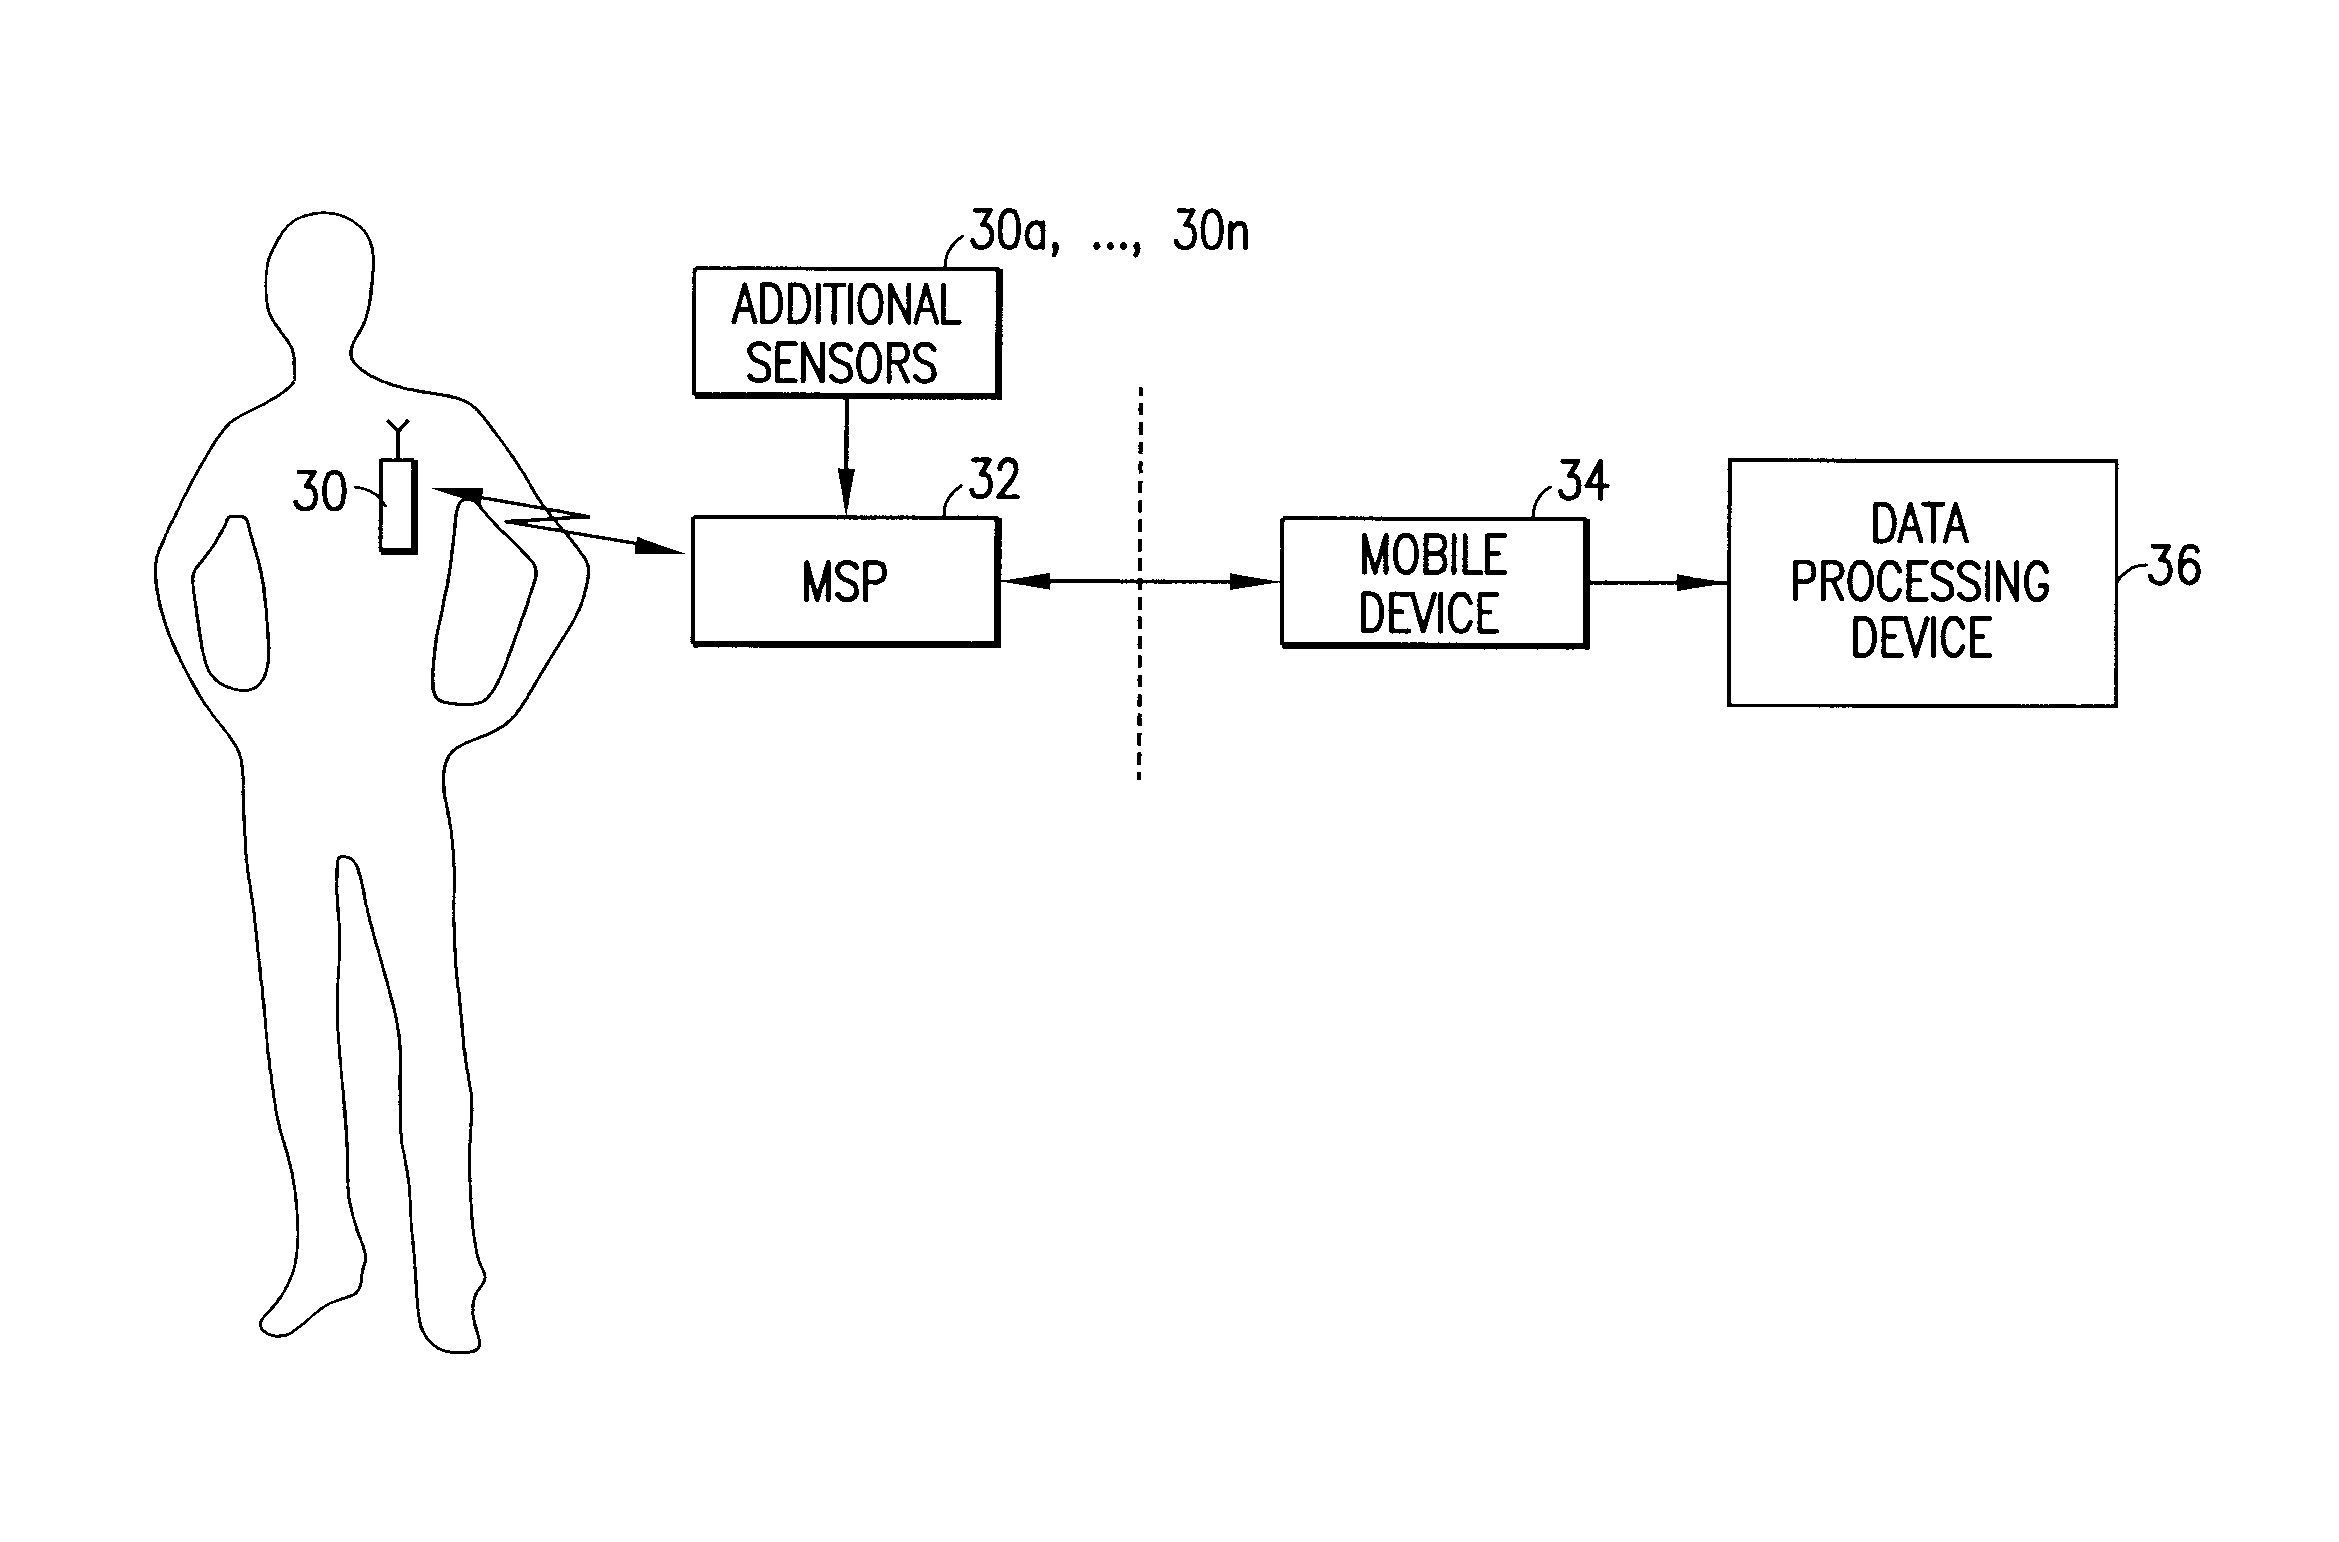
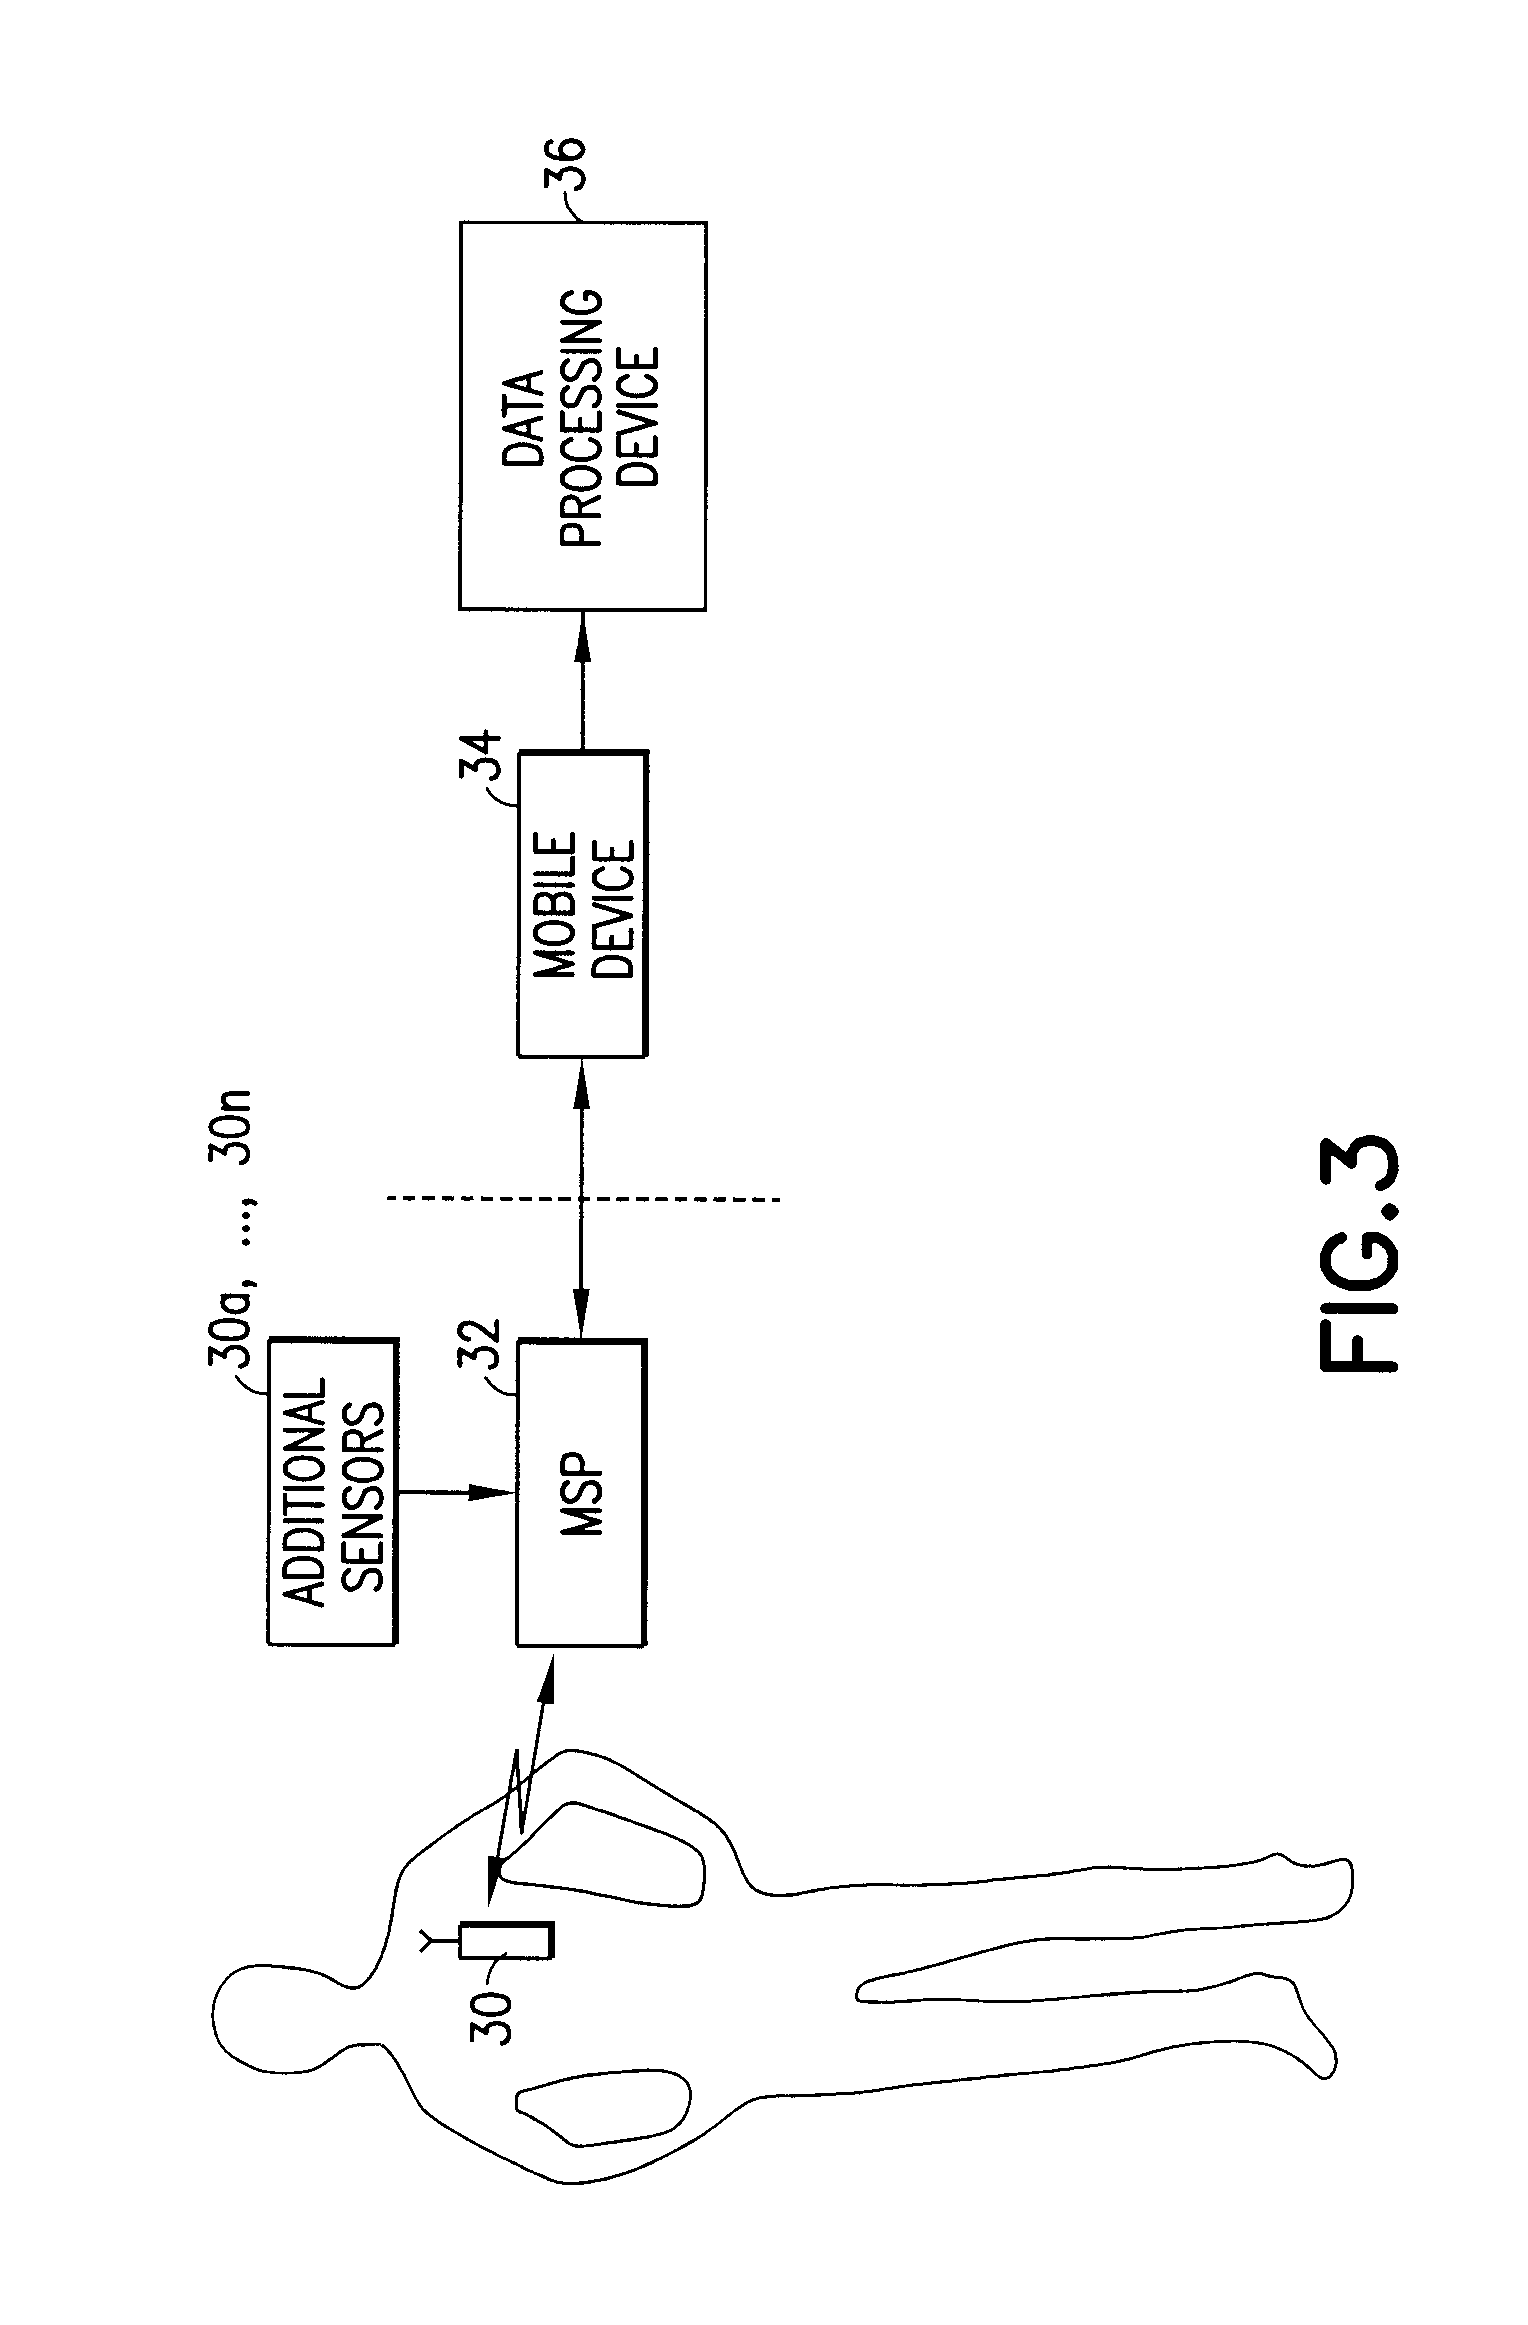
[0032]In accordance with illustrative embodiments of the present invention and with reference to FIG. 2, a physiological condition monitoring device provides a user with information derived from measured data (block 20) that is easy for the user to understand and use. For example, the physiological condition monitoring device can present the information to the user in a video mode wherein a video image of a person or other entity explains selected and interpreted measured data to the user. For example, with reference to block 24 of FIG. 2, the physiological data and other optional information can be interpreted and then information that a user needs to know can be determined based on the interpreted data (e.g., selected data points and / or data patterns, or retrospectively or prospectively determined data points) and, for example, a prescribed medical treatment protocol or, optionally, recommended user actions to prevent or lessen the impact of the selected data points ...


PUM


Abstract

Systems, devices and methods for managing a physiological condition are configured to store predetermined output segments of content, analyze physiological data and other user information, and generate user-friendly information that provides an interpretation of the data (e.g., identifies selected data points, or determines pattern of physiological data over selected period(s)). An output segment management system with rules engine and method combines selected output segments to generate a presentation or message (e.g., with text, graphical, multimedia, video and / or audio information). The resulting presentation or message provides user information such as an explanation of selected data with selected user information incorporated therein, and optional recommendations (e.g., suggested user actions based on a designated protocol such as a clinical protocol).

Description

BACKGROUND OF THE INVENTION[0001]1. Field of the Invention[0002]The present invention relates generally to apparatuses, methods and systems for sensing or measuring physiological data, analyzing the data, and outputting user-friendly information providing an interpretation of the data for improved management of one or more physiological conditions.[0003]2. Description of Related Art[0004]With reference to blocks 10 and 12 of FIG. 1, continuous glucose monitors (CGMs) provide a user such as a patient, clinician or caregiver with a patient's glucose measurements throughout the day (e.g., a glucose measurement every one to five minutes 24 hours per day). Accordingly, the quantity of data provided to the CGM user is tremendous. This data is typically presented to the end user as a graphical display wherein the glucose values measured by the CGM are plotted as a function of time of day. Examples of such data are the graphical display of blood glucose measurements over a 14 hour period sh...

Claims


Application Information

Patent Timeline
Patent Type & Authority Applications(United States)
IPC IPC(8): A61B5/00G06F19/00H04W4/80
CPCG06F19/345A61B5/72A61B5/02438A61B5/14532A61B5/7275G16H50/20G16H15/00H04W4/80A61B5/002A61B5/742G08C17/02G16H50/30G16H40/67Y02A90/10G16Z99/00G16H20/10G16H20/60
Inventor PETISCE, JAMESDIRESTA, ELLENBURNS, DEBORAHMASON, DAVIDKANDERIAN, SAMI
Owner BECTON DICKINSON & CO
Learn More