Determining a Controller Performance Measure

a technology of performance measurement and controller, applied in the direction of electric controllers, ignition automatic control, instruments, etc., can solve the problems of cumbersome and time-consuming, high computational effort, etc., and achieve the effect of maximizing the objective function, improving method accuracy, and simplifying evaluation

Inactive Publication Date: 2015-07-30
SIEMENS AG
View PDF1 Cites 0 Cited by
  • Summary
  • Abstract
  • Description
  • Claims
  • Application Information

AI Technical Summary

Benefits of technology

[0049]Thereby, a simple scheme for selecting frequencies that may simplify evaluation and maximizing the objective function may be provided.
[0050]According to an embodiment

Problems solved by technology

However, this is very cumbersome and time-consum

Method used


Image

  • Determining a Controller Performance Measure
  • Determining a Controller Performance Measure
  • Determining a Controller Performance Measure

Examples


Embodiment Construction

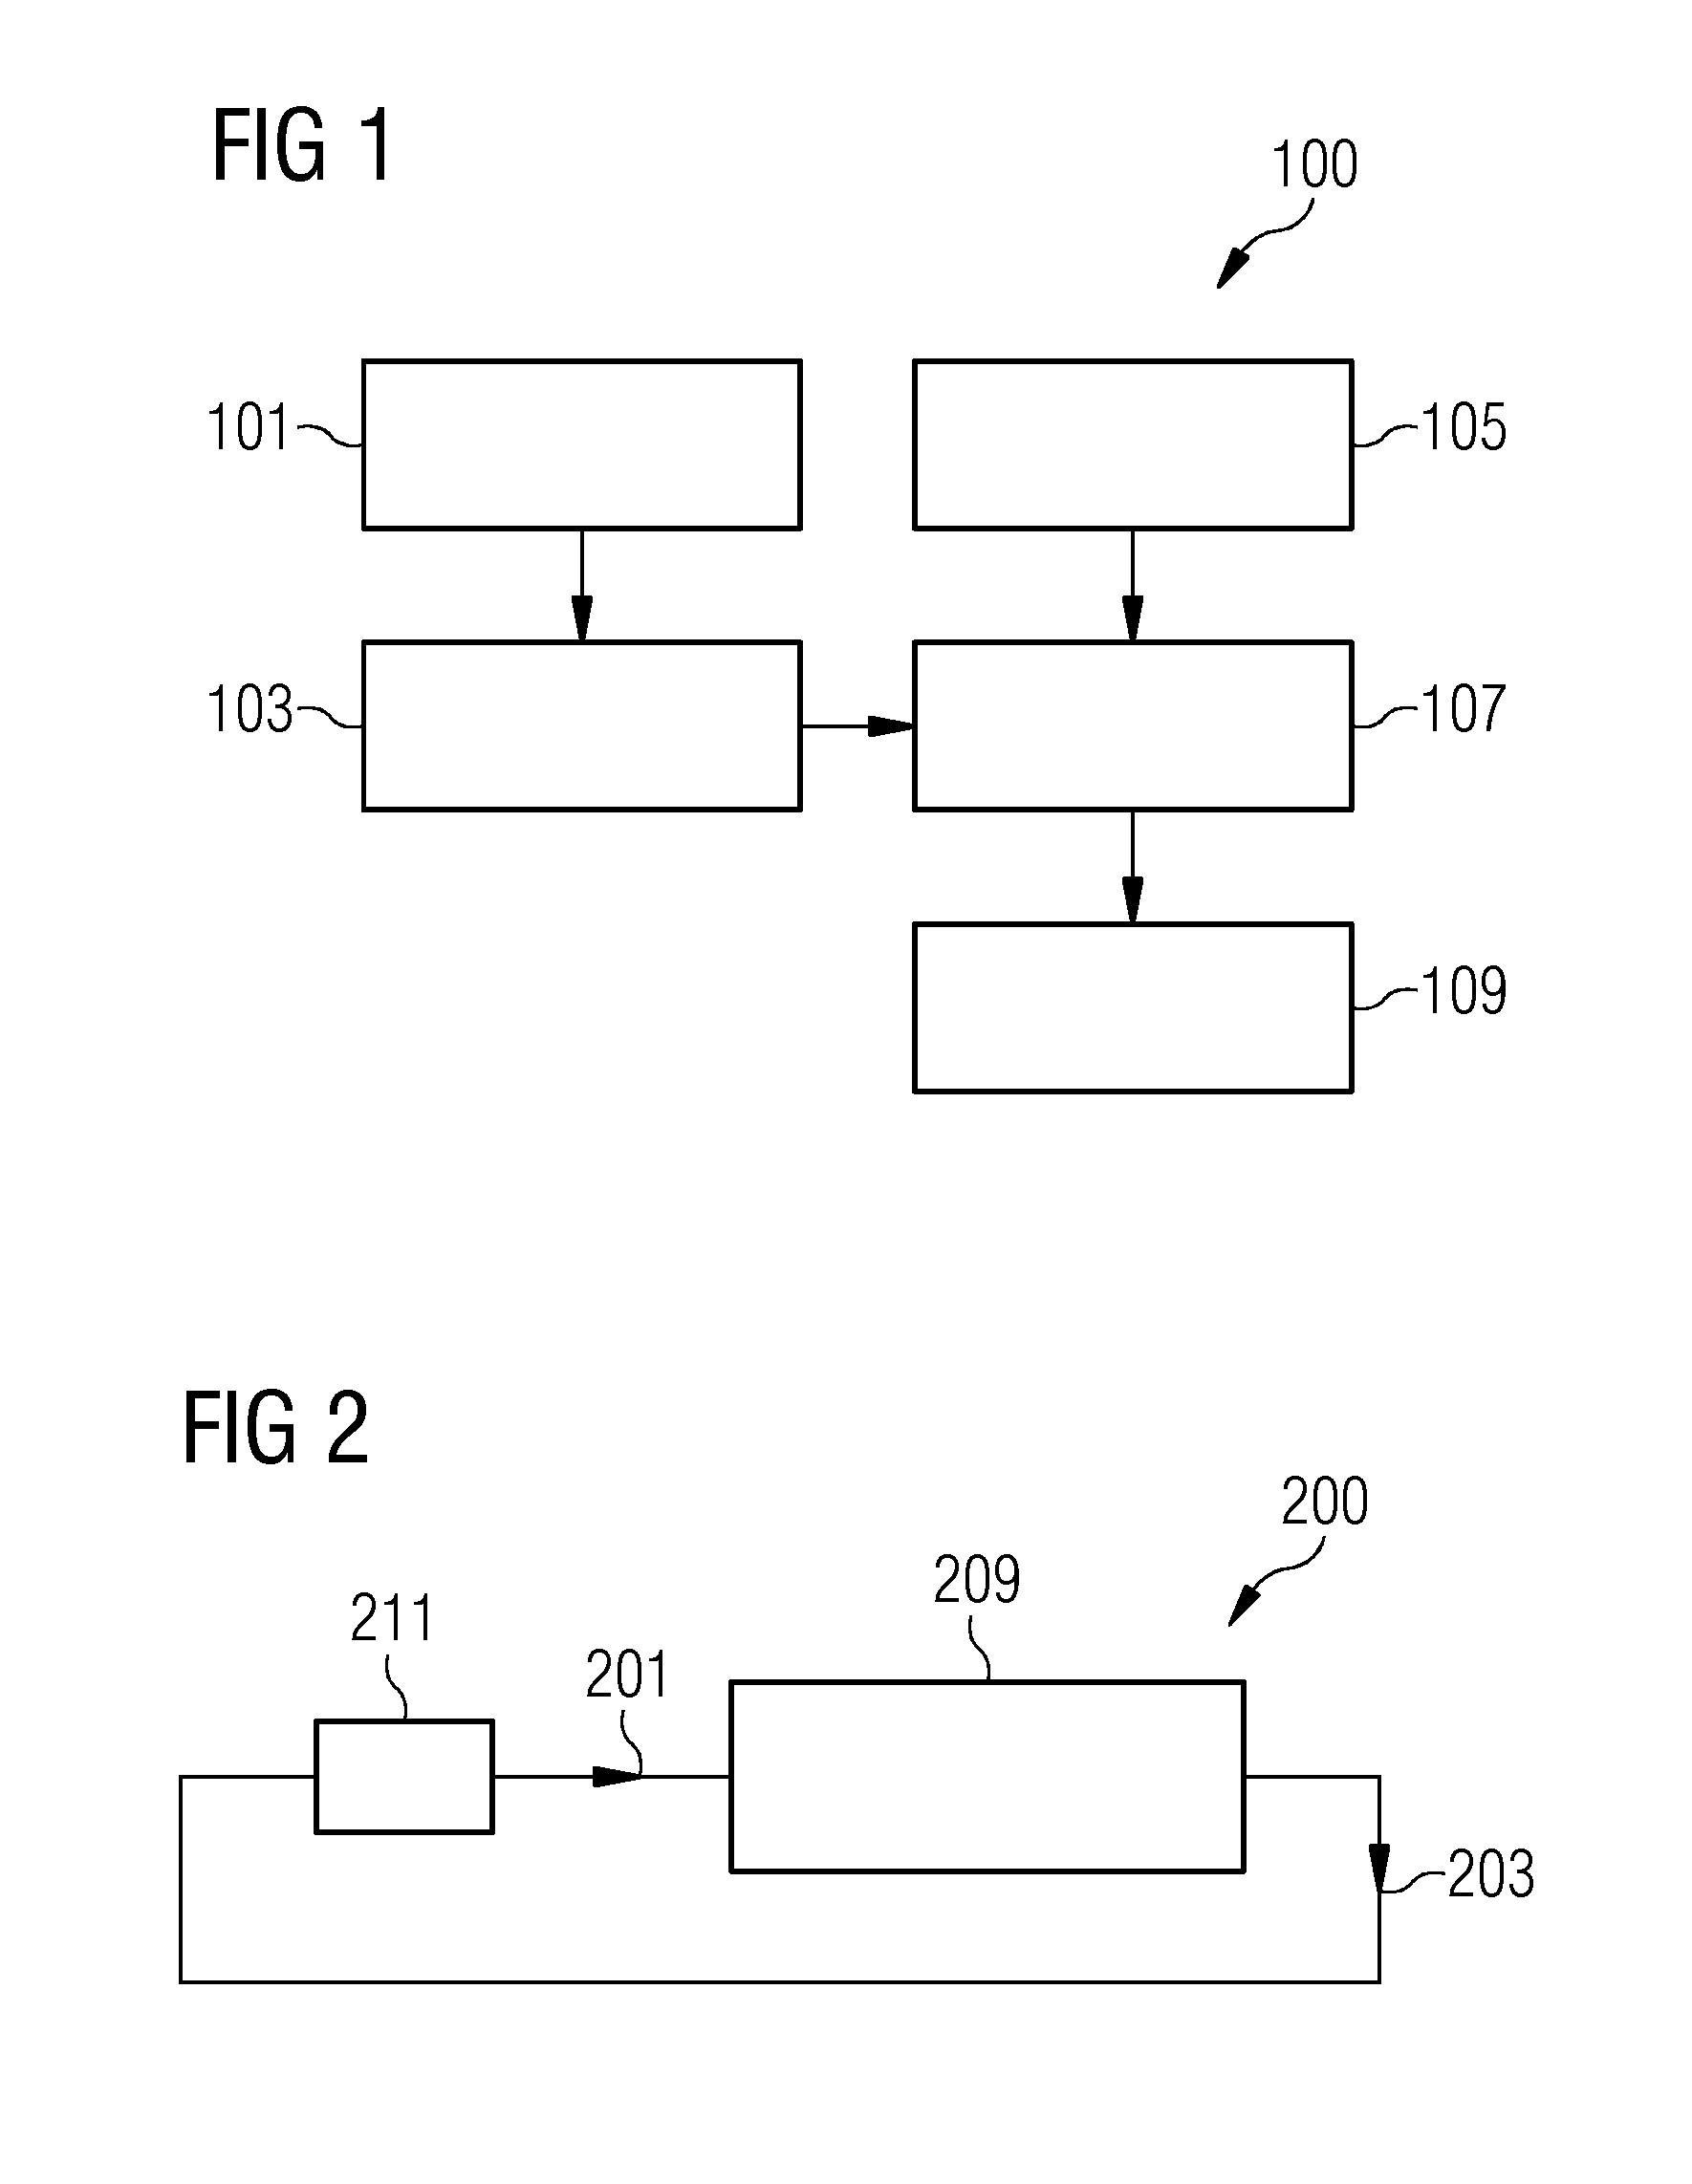
[0068]FIG. 1 illustrates a block diagram of a method 100 for determining a performance measure of a controller according to an embodiment. In act 101, in a first mode or first configuration, first system input data and first system output data are obtained under relay-based tune mode (e.g., when a relay controller is arranged upstream of a system to be controlled, as is illustrated in FIG. 2).

[0069]For example, in this first configuration in act 101, a first controller (e.g., including a relay controller) receives the first system output data and supplies first controller output to the system as the first system input data.

[0070]The first system input data and the first system output data are later used during act 103 to estimate a system delay D between the first system input data and the first system output data using a Hilbert transform relations method. The Hilbert transform relations method uses or is based on the first system input data and the first system output data having ...


PUM


Abstract

A performance measure of a second controller adapted to control a system is determined. First system input data and first system output data are obtained, while a first controller receives the first system output data and supplies first controller output to the system as the first system input data. A system delay is estimated between the first system input data and the first system output data using a Hilbert transform relations method. Second system output data is obtained, while the second controller receives a difference between second system output data and reference data and supplies second controller output to the system as second system input data. A minimum system output variance is estimated based on the estimated system delay and an impulse response of the system. The performance measure is estimated based on the estimated minimum system output variance and a variance of the second system output data.

Description

[0001]This application claims the benefit of EP 14152501.4, filed on Jan. 24, 2014, which is hereby incorporated by reference in its entirety.FIELD[0002]The present embodiments relate to determining a performance measure of a controller.BACKGROUND[0003]Estimation of the most famous control loop performance measure, Harris index, needs a priori information on the system time delay that is not known. Thereby, conventional methods to determine a control loop performance measure may involve setting different system delays by trial and error and use these to calculate a number of Harris indices from which the lowest may be selected to represent a true estimation of the control loop performance measure. However, this is very cumbersome and time-consuming and also requires high computational efforts. For example, it may be a usual practice to assume a range of time delay values in a diophantine equation while estimating minimum variance from routine operating data. Hence, according to the ...

Claims


Application Information

Patent Timeline
IPC IPC(8): G05B15/02
CPCG05B15/02G05B11/06G05B13/042G05B23/02G06F17/14G05B13/024
Inventor SIVALINGAM, SELVANATHAN
Owner SIEMENS AG
Why Eureka
Try Eureka