Ecosystem Services Index, Exchange and Marketplace and Methods of Using Same

a technology of ecosystem services and indexes, applied in the field of ecosystem services, can solve the problems of a large amount of technical expertise, and a large amount of workstations costing tens of thousands of dollars each, and achieve the effect of reducing the number of workstations

Inactive Publication Date: 2016-07-14
MOLL GARY ALLISON +2
View PDF3 Cites 31 Cited by
  • Summary
  • Abstract
  • Description
  • Claims
  • Application Information

AI Technical Summary

Benefits of technology

[0029]There is further provided in accordance with an exemplary embodiment of the invention, a method of providing an ecosystem services index marketplace, comprising: creating a universal ecosystem services index capable of placing a value on ecosystem services; assigning

Problems solved by technology

Throughout most of its initial 40 years of history, geographic information system (“GIS”) technology was relatively expensive and required very significant technical expertise to operate.
Typical systems required specialized hardware for map digitizing, and specialized workstations costing tens of thousands of dollars each.
This led to strong technical advances in each field, but also to professional and social fragmentation of knowledge.
In the 1980s, this combination led to substantial

Method used


Image

  • Ecosystem Services Index, Exchange and Marketplace and Methods of Using Same
  • Ecosystem Services Index, Exchange and Marketplace and Methods of Using Same
  • Ecosystem Services Index, Exchange and Marketplace and Methods of Using Same

Examples


example 1

[0192]Taking a scenario where the service in question is riparian forest cover, the remote sensing system is used initially to assess historic and current riparian forest cover. This is based on spectral information from satellite data, in this case using the infrared bands of imagery in order to distinguish riparian forest based on its water content. It is also based on distance uphill from streams and rivers, which is an analysis of the National Hydrological Dataset (NHD) of hydrological centerlines and the National Elevation Dataset (NED) for terrain elevation. By looking for “wet” vegetation horizontally and vertically near known water features, the system can consistently identify “riparian forest.” Once this is done, and a contract is issued for the restoration or protection of such areas, subsequent remote sensing data is used to perform “change detection.” The system assesses the presence or absence of riparian forest, and determines information about its quality. This infor...

example 2

[0193]Example 2 is a comparison between the EPA EnviroAtlas tool and the systems and methodology of the present invention. The EPA EnviroAtlas consists of a large digital library including a spatial data library which allows users to research published information on a wide variety of topics and build maps using spatial data for analysis using desktop GIS. The EnviroAtlas and the ESI system (i.e. of the present invention) are very different and those differences start with their fundamental approach to the environmental analysis and the corresponding interface with users.

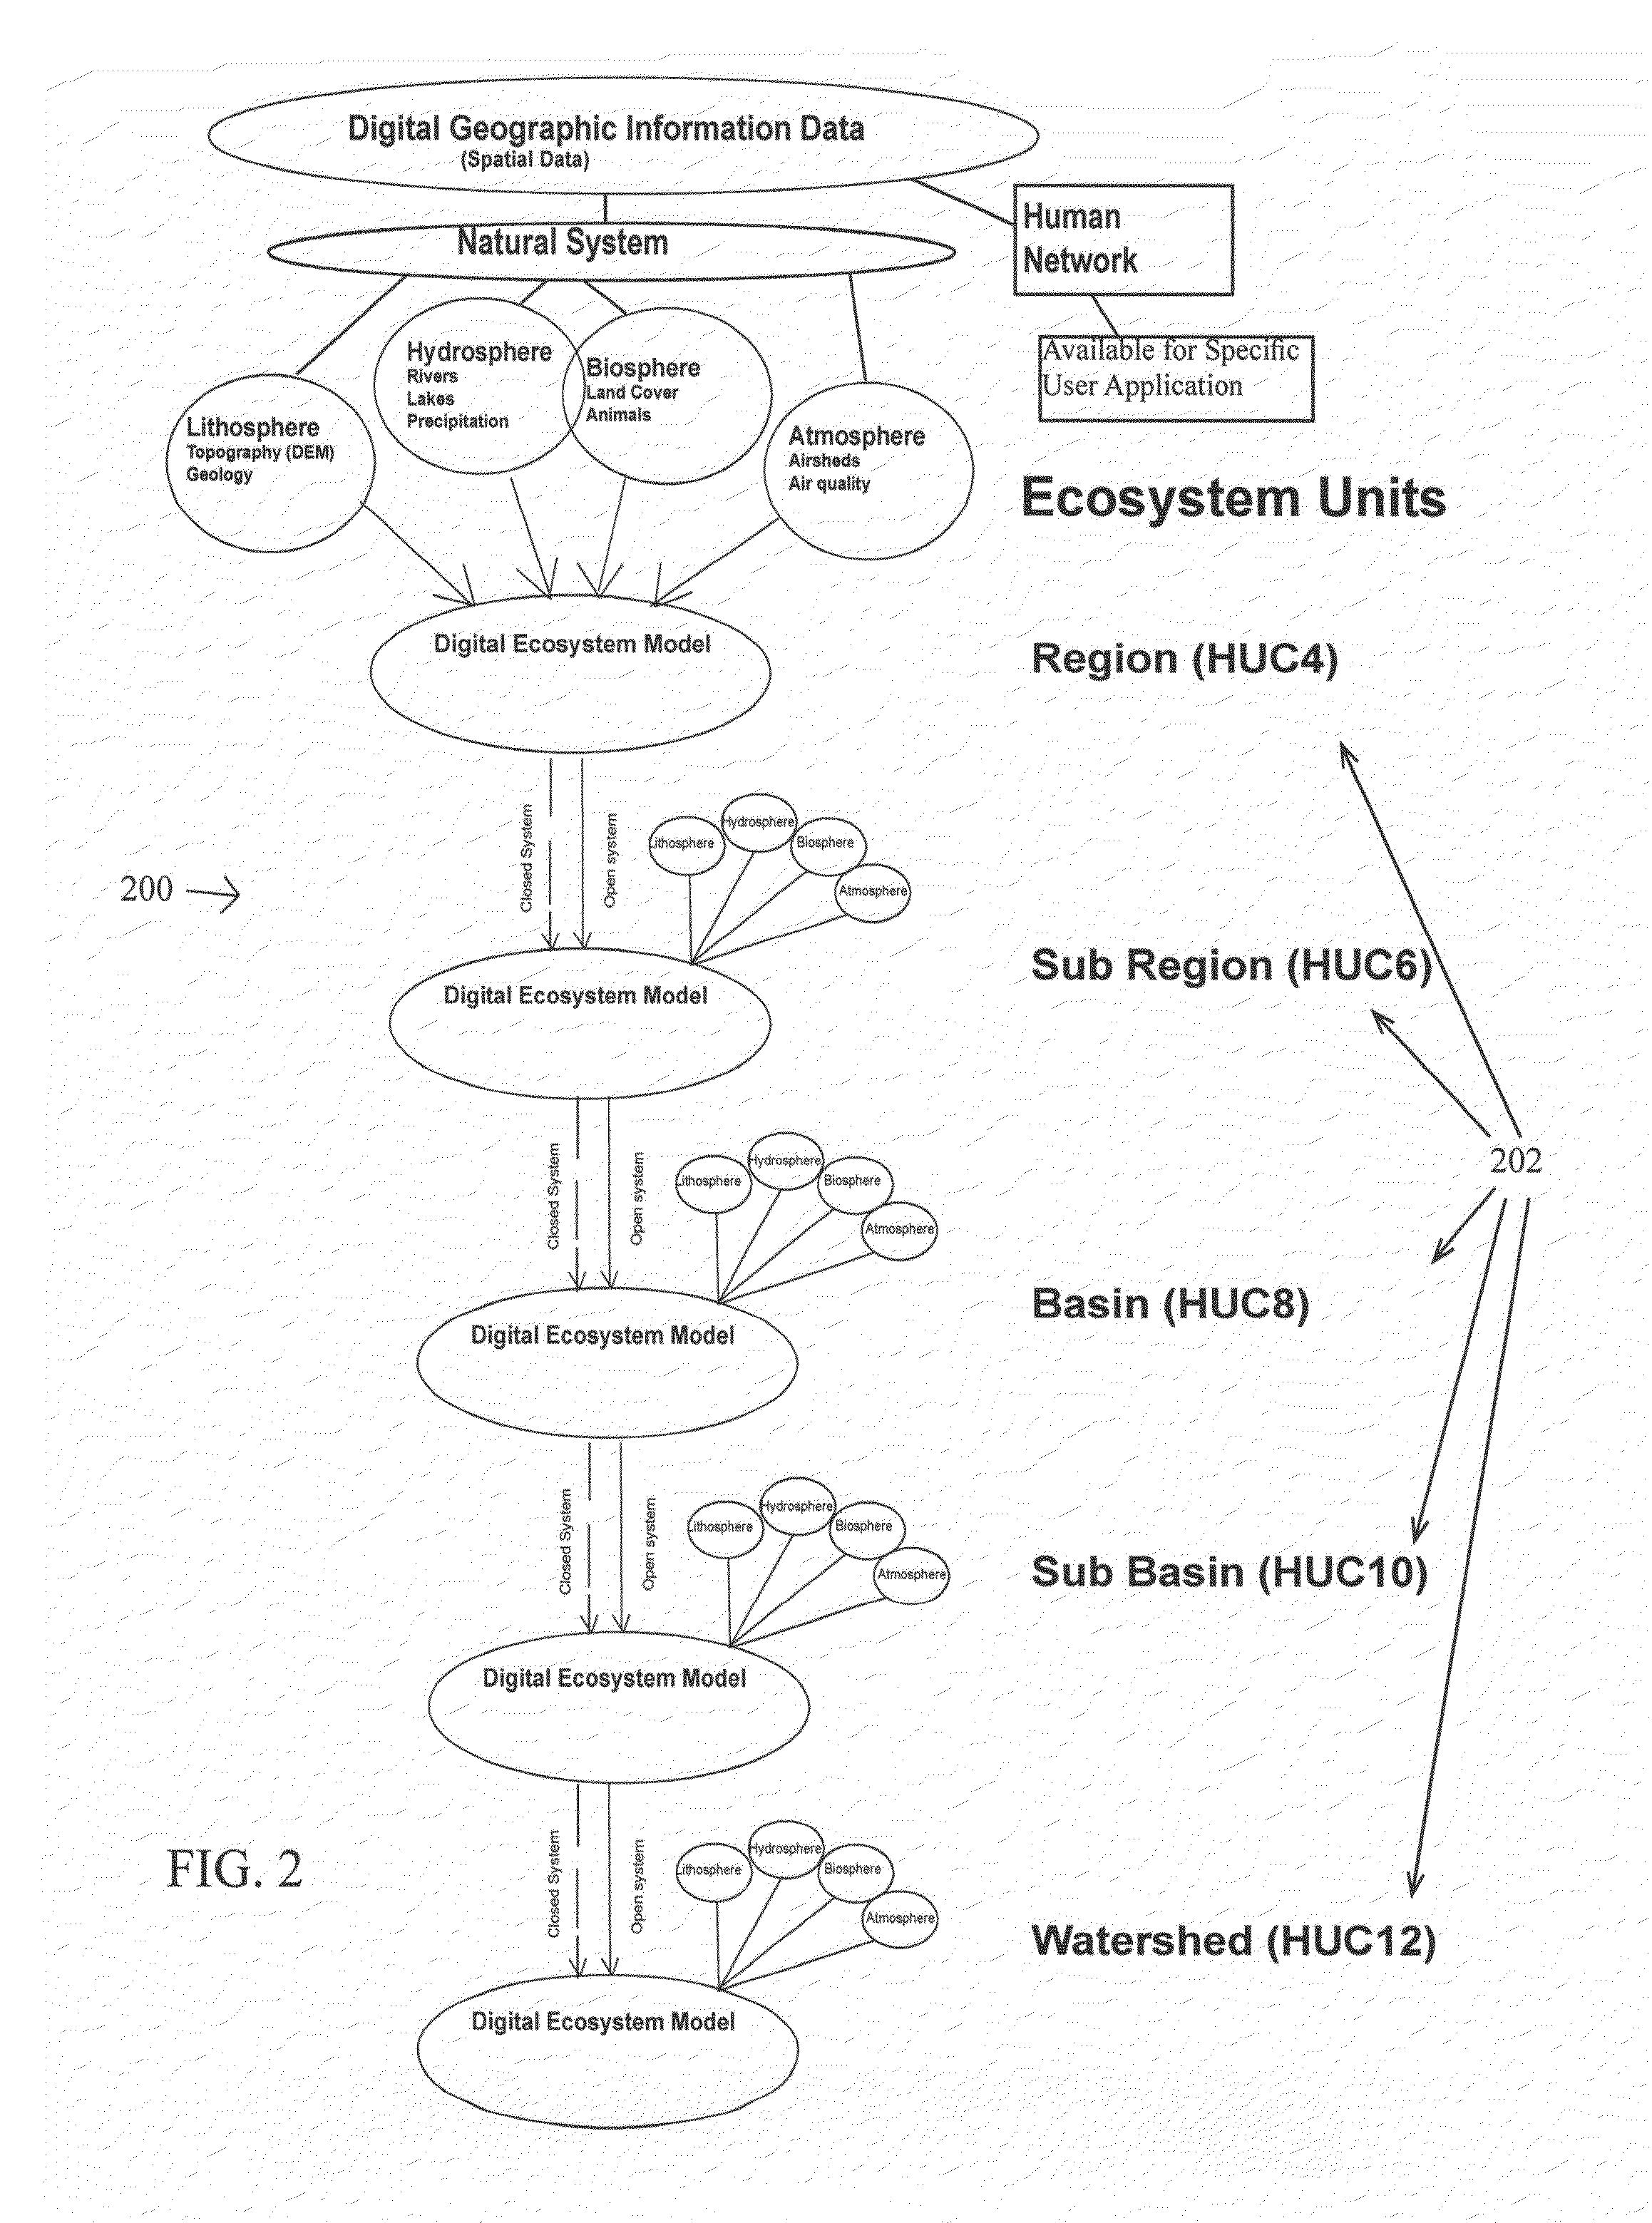
[0194]In some embodiments of the invention, environmental analysis conducted with the ESI system is based on an analysis of an ecological unit, like watersheds. Watershed units are spatially documented as GIS shape files and categorized by Hydrologic Unit Codes (HUC) from 2 to 14. However, the EnviroAtlas does not require environmental analysis to be conducted by environmental units and in fact shows users how to co...

example 3

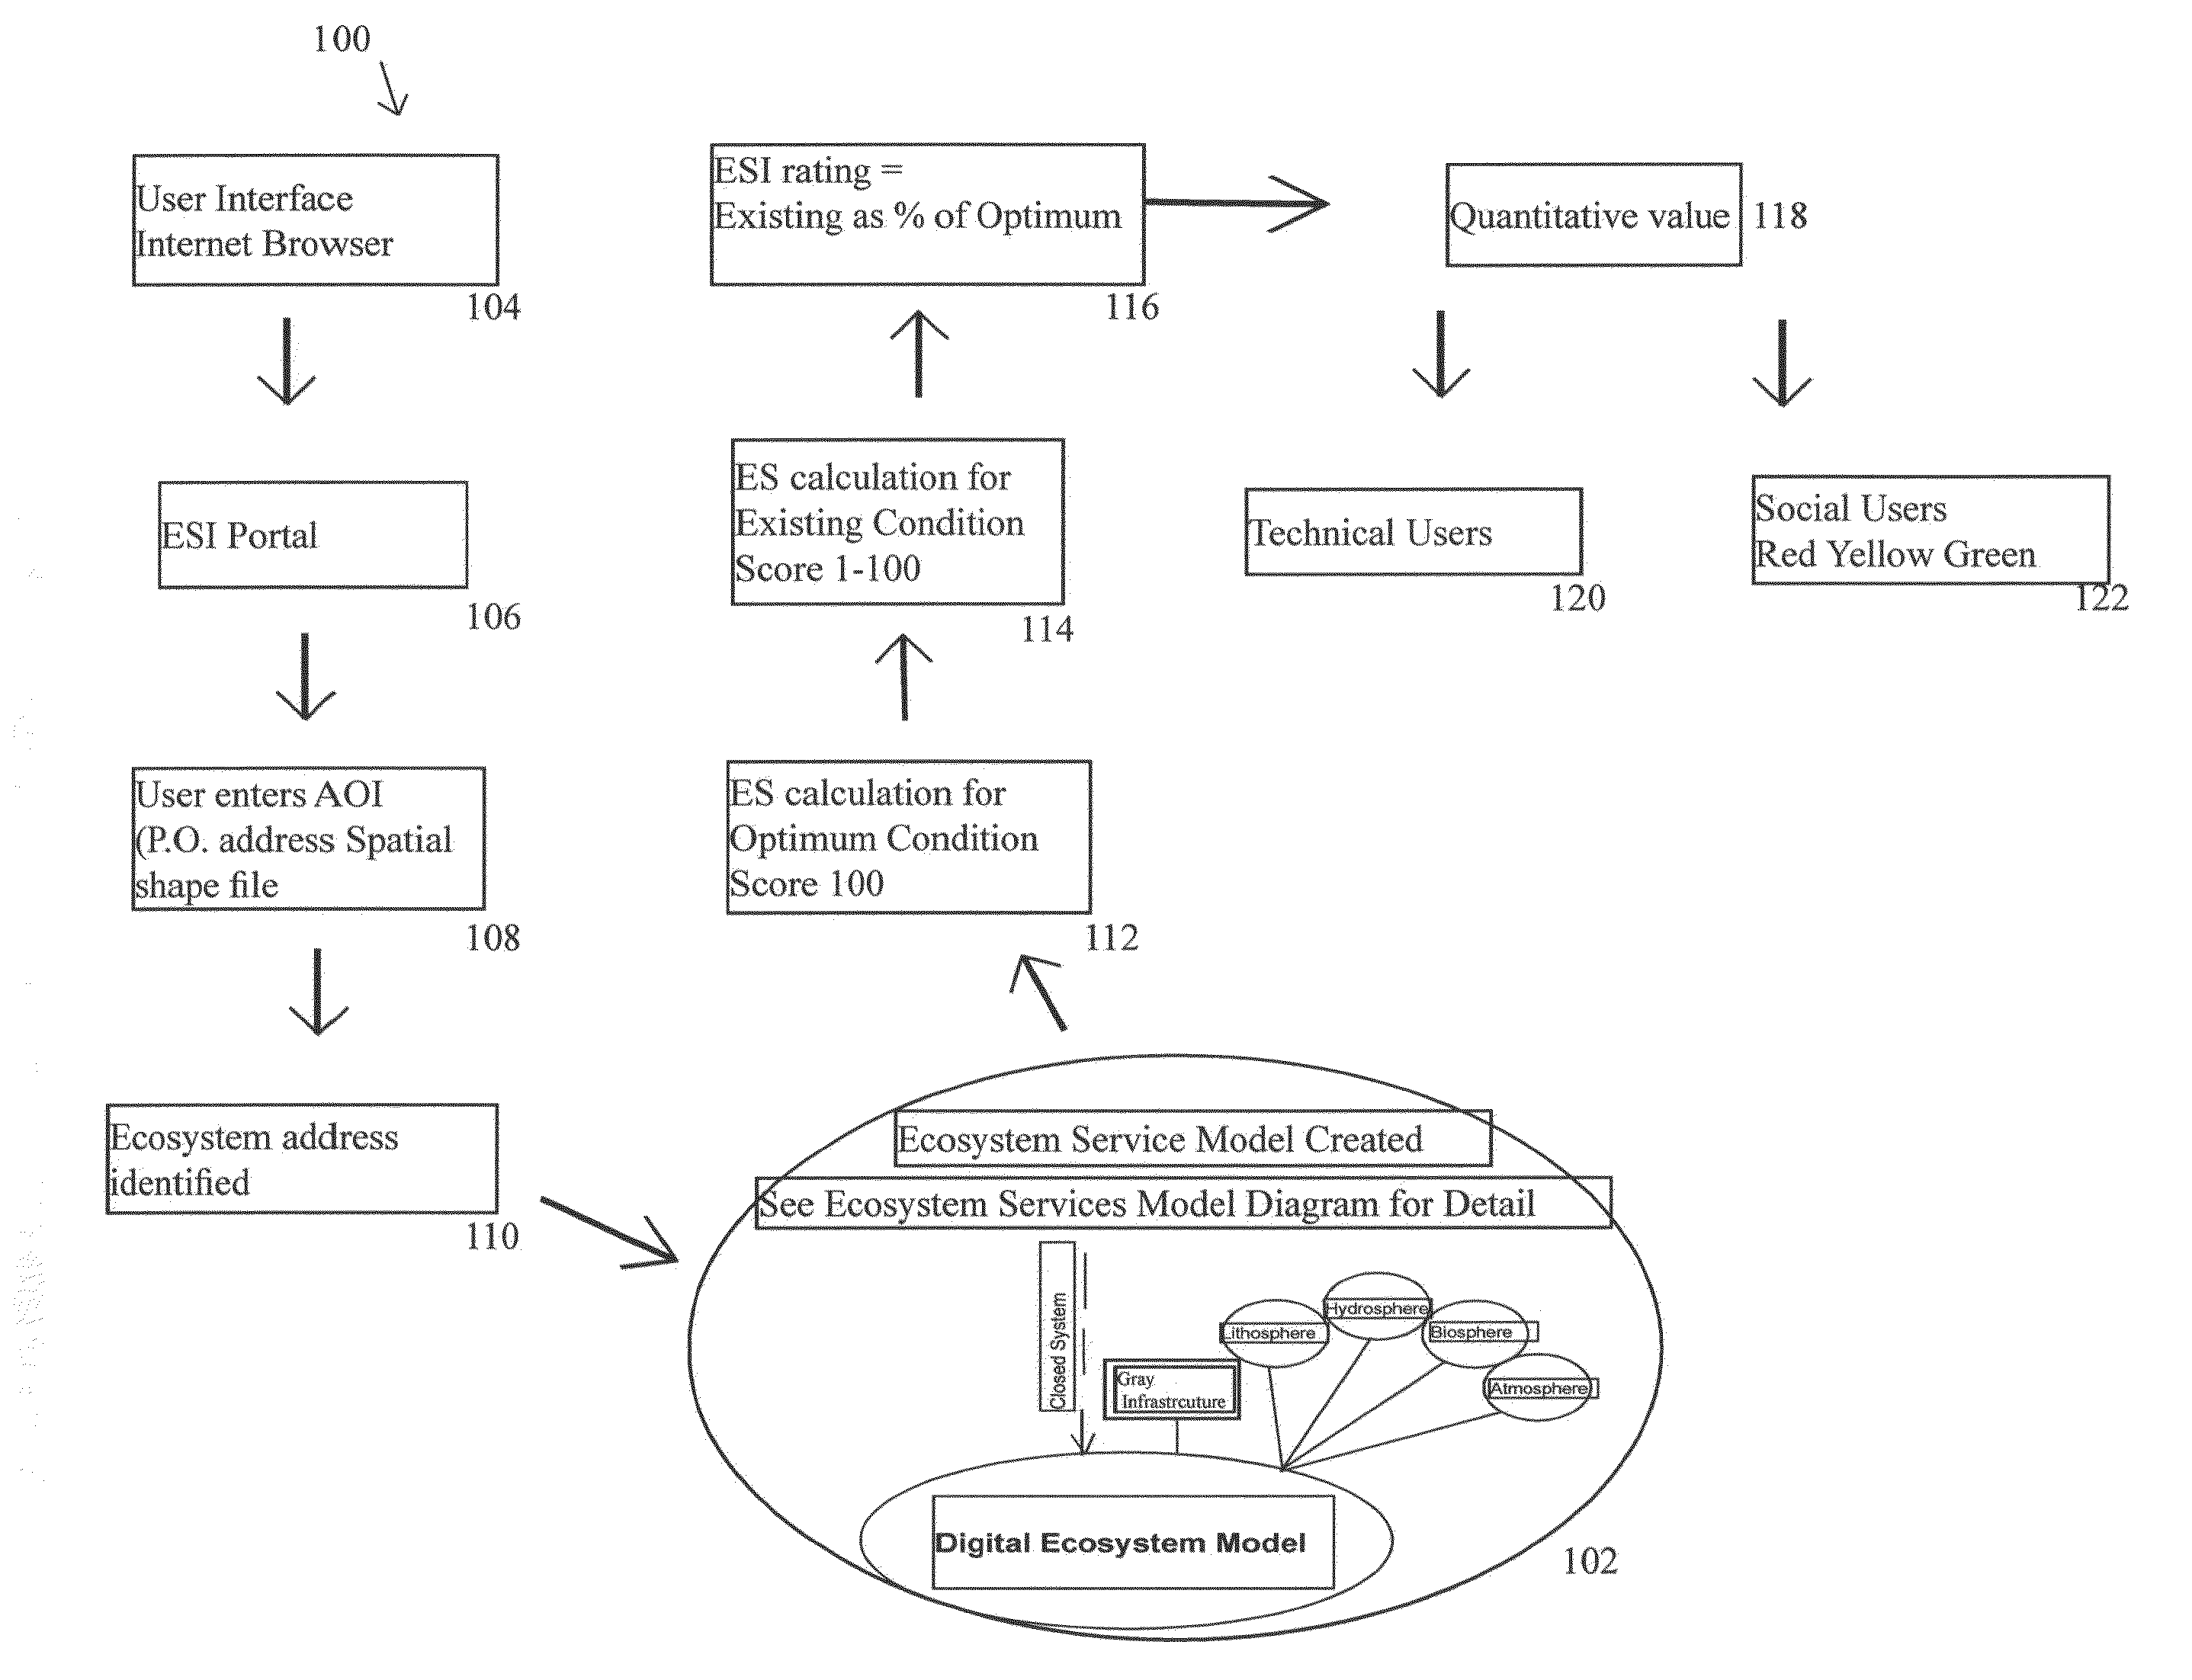
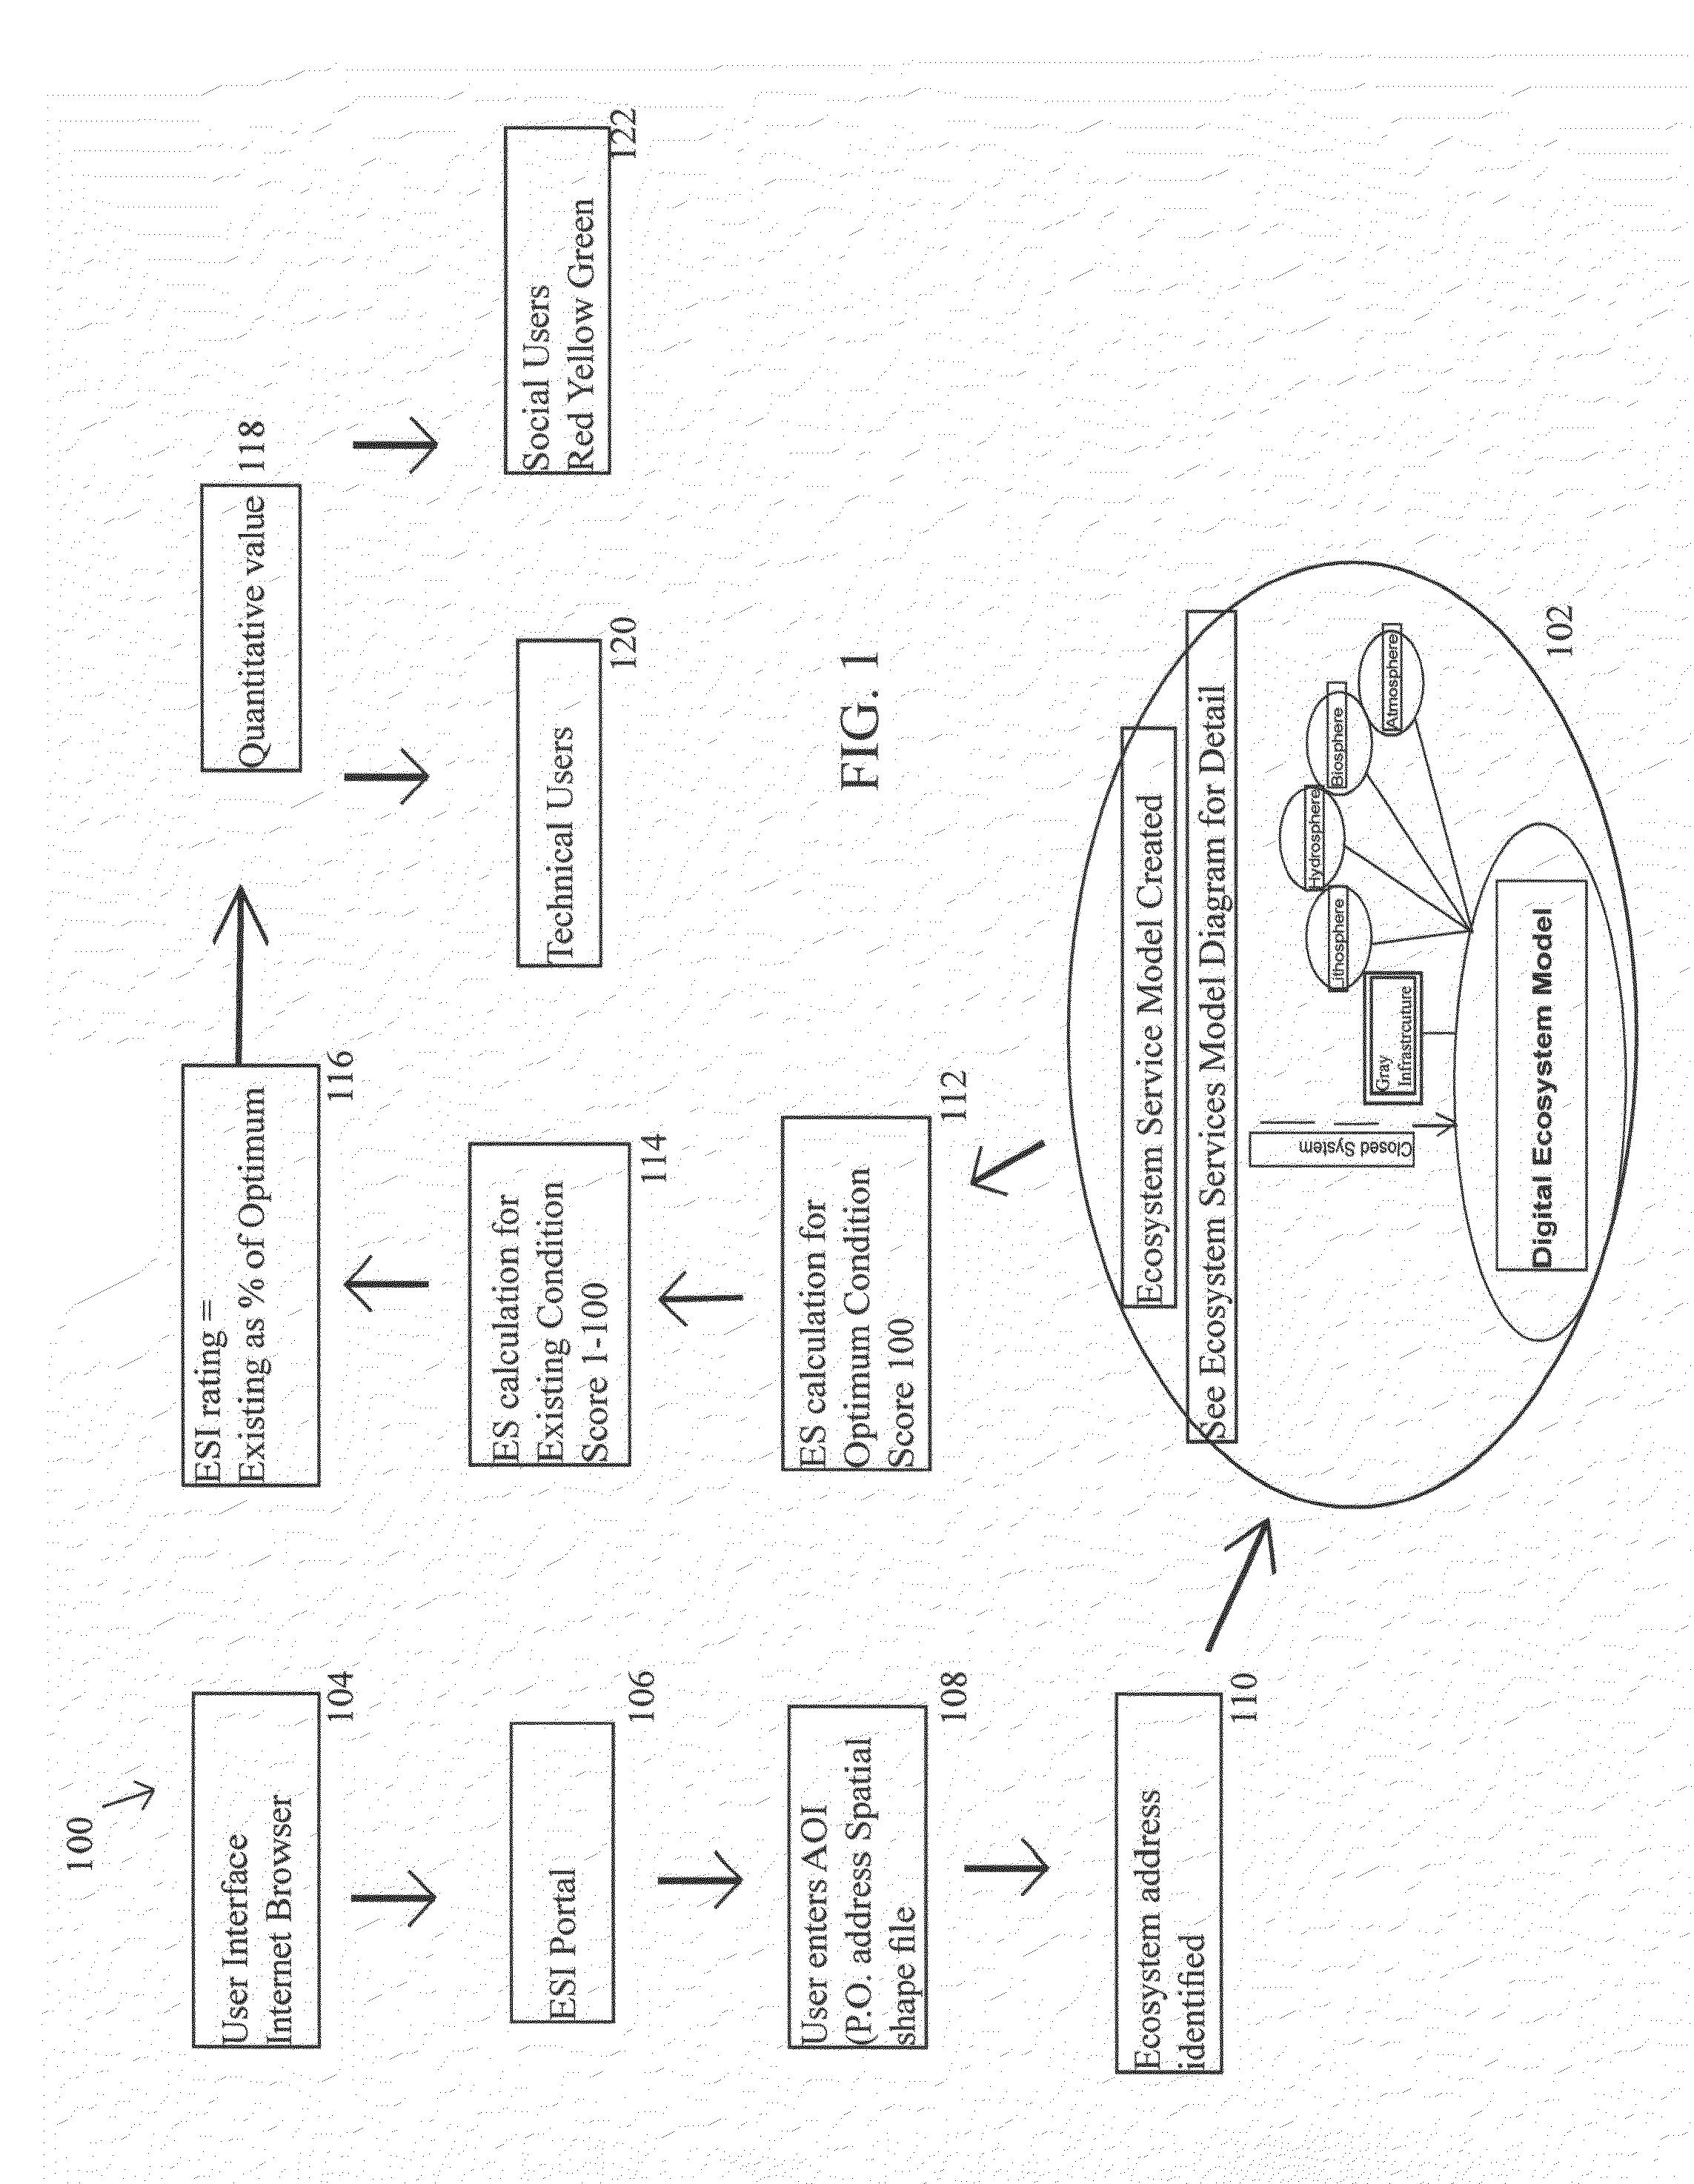
[0199]Referring to FIG. 11, an exemplary user scenario 1100 is presented where the user is utilizing the ESI system and methods described herein to determine possible courses of action given a particular objective. In this scenario, the user owns a parcel which is suffering from an erosion problem and is trying to figure out what can be done to ameliorate it (other motivations could be other forms of altering ecological conditions, earning credits, offsetting ecological performance losses elsewhere and the like). After entering in identifying information about the user's parcel, the Area of Interest, the system retrieves information related to the currently known ecosystem services available at the parcel's location. These currently known ecosystem services are typically available from a plurality of publically available information resources. The combination of the currently available ecosystem resources and the physical coordinates of the AOI contribute to assigning the AOI an Eco...


PUM


Abstract

A method of calculating an ecosystem services index score, comprising: receiving area of interest information from a user of an ecosystem services index calculating system; assigning an ecoaddress to the area of interest by a processor of the system; retrieving ecosystem services information about the area of interest from at least one database; retrieving ecosystem services information about the area of interest on at least one scale size larger or smaller than the area of interest from at least one database; and, deriving a multi-scale ecosystem services index score blending the retrieved ecosystem services information about the area of interest.

Description

FIELD AND BACKGROUND OF THE INVENTION[0001]The present invention, in some embodiments thereof, relates to ecosystem services and more particularly, but not exclusively, to an environmental performance index and uses of the same.[0002]Throughout most of its initial 40 years of history, geographic information system (“GIS”) technology was relatively expensive and required very significant technical expertise to operate. Typical systems required specialized hardware for map digitizing, and specialized workstations costing tens of thousands of dollars each. Setting up these systems required substantial technical and scientific background, typically the equivalent of a Master's degree. Given these requirements, it is perhaps not surprising that uses became highly specialized and highly professionalized. Essentially, each scientific discipline and each governmental department or program began to use geographic information technology separately and incrementally. Foresters used GIS for sta...

Claims


Application Information

Patent Timeline
IPC IPC(8): G06F17/30G06Q50/26
CPCG06F17/3087G06F17/30321G06F17/30241G06Q50/26G06F17/30997G06F17/30525G06F17/3053
Inventor MOLL, GARY ALLISONMONDELLO, CHARLESFLAXMAN, MICHAEL
Owner MOLL GARY ALLISON
Why Eureka
Try Eureka