
System and method for residential utility monitoring and improvement of energy efficiency

a technology for residential utilities and monitoring systems, applied in data processing applications, instruments, computing, etc., can solve the problems of residential customers' significant expense of installing such devices, processing analysis is generally limited to electrical disaggregation, and other forms of energy consumption analysis, so as to achieve the effect of improving energy efficiency in a dwelling

Inactive Publication Date: 2016-09-15
KAUFFMAN DANIEL +1
View PDF0 Cites 48 Cited by
  • Summary
  • Abstract
  • Description
  • Claims
  • Application Information

AI Technical Summary

Benefits of technology

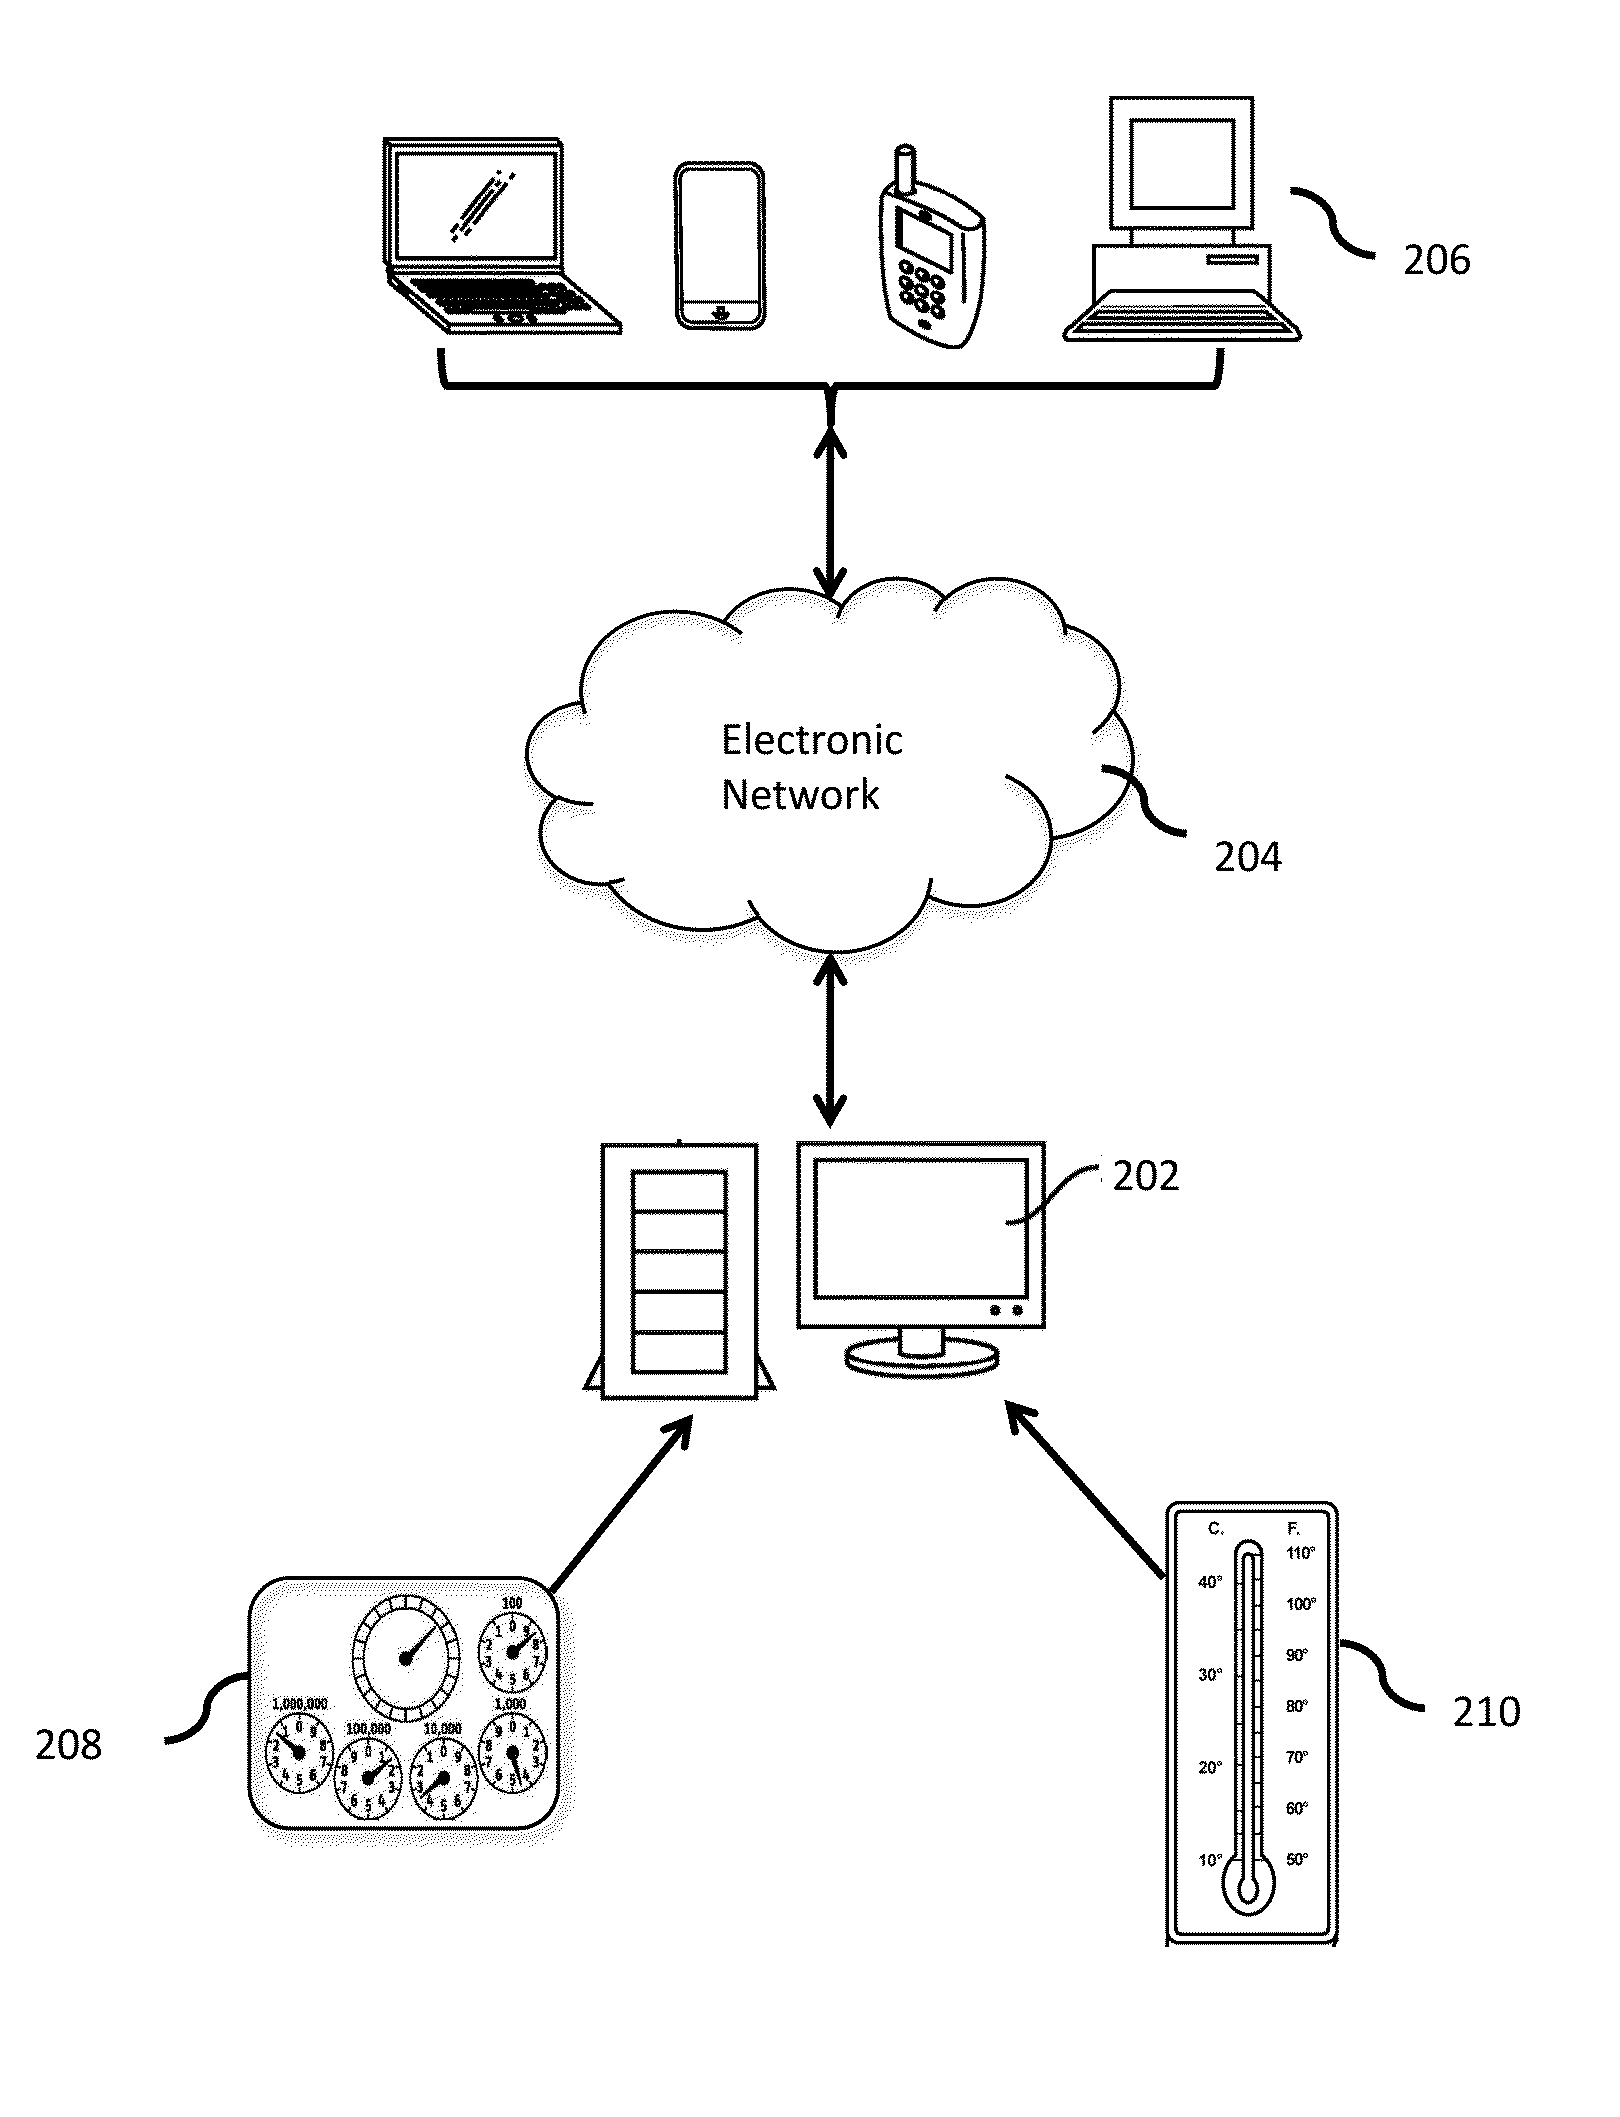
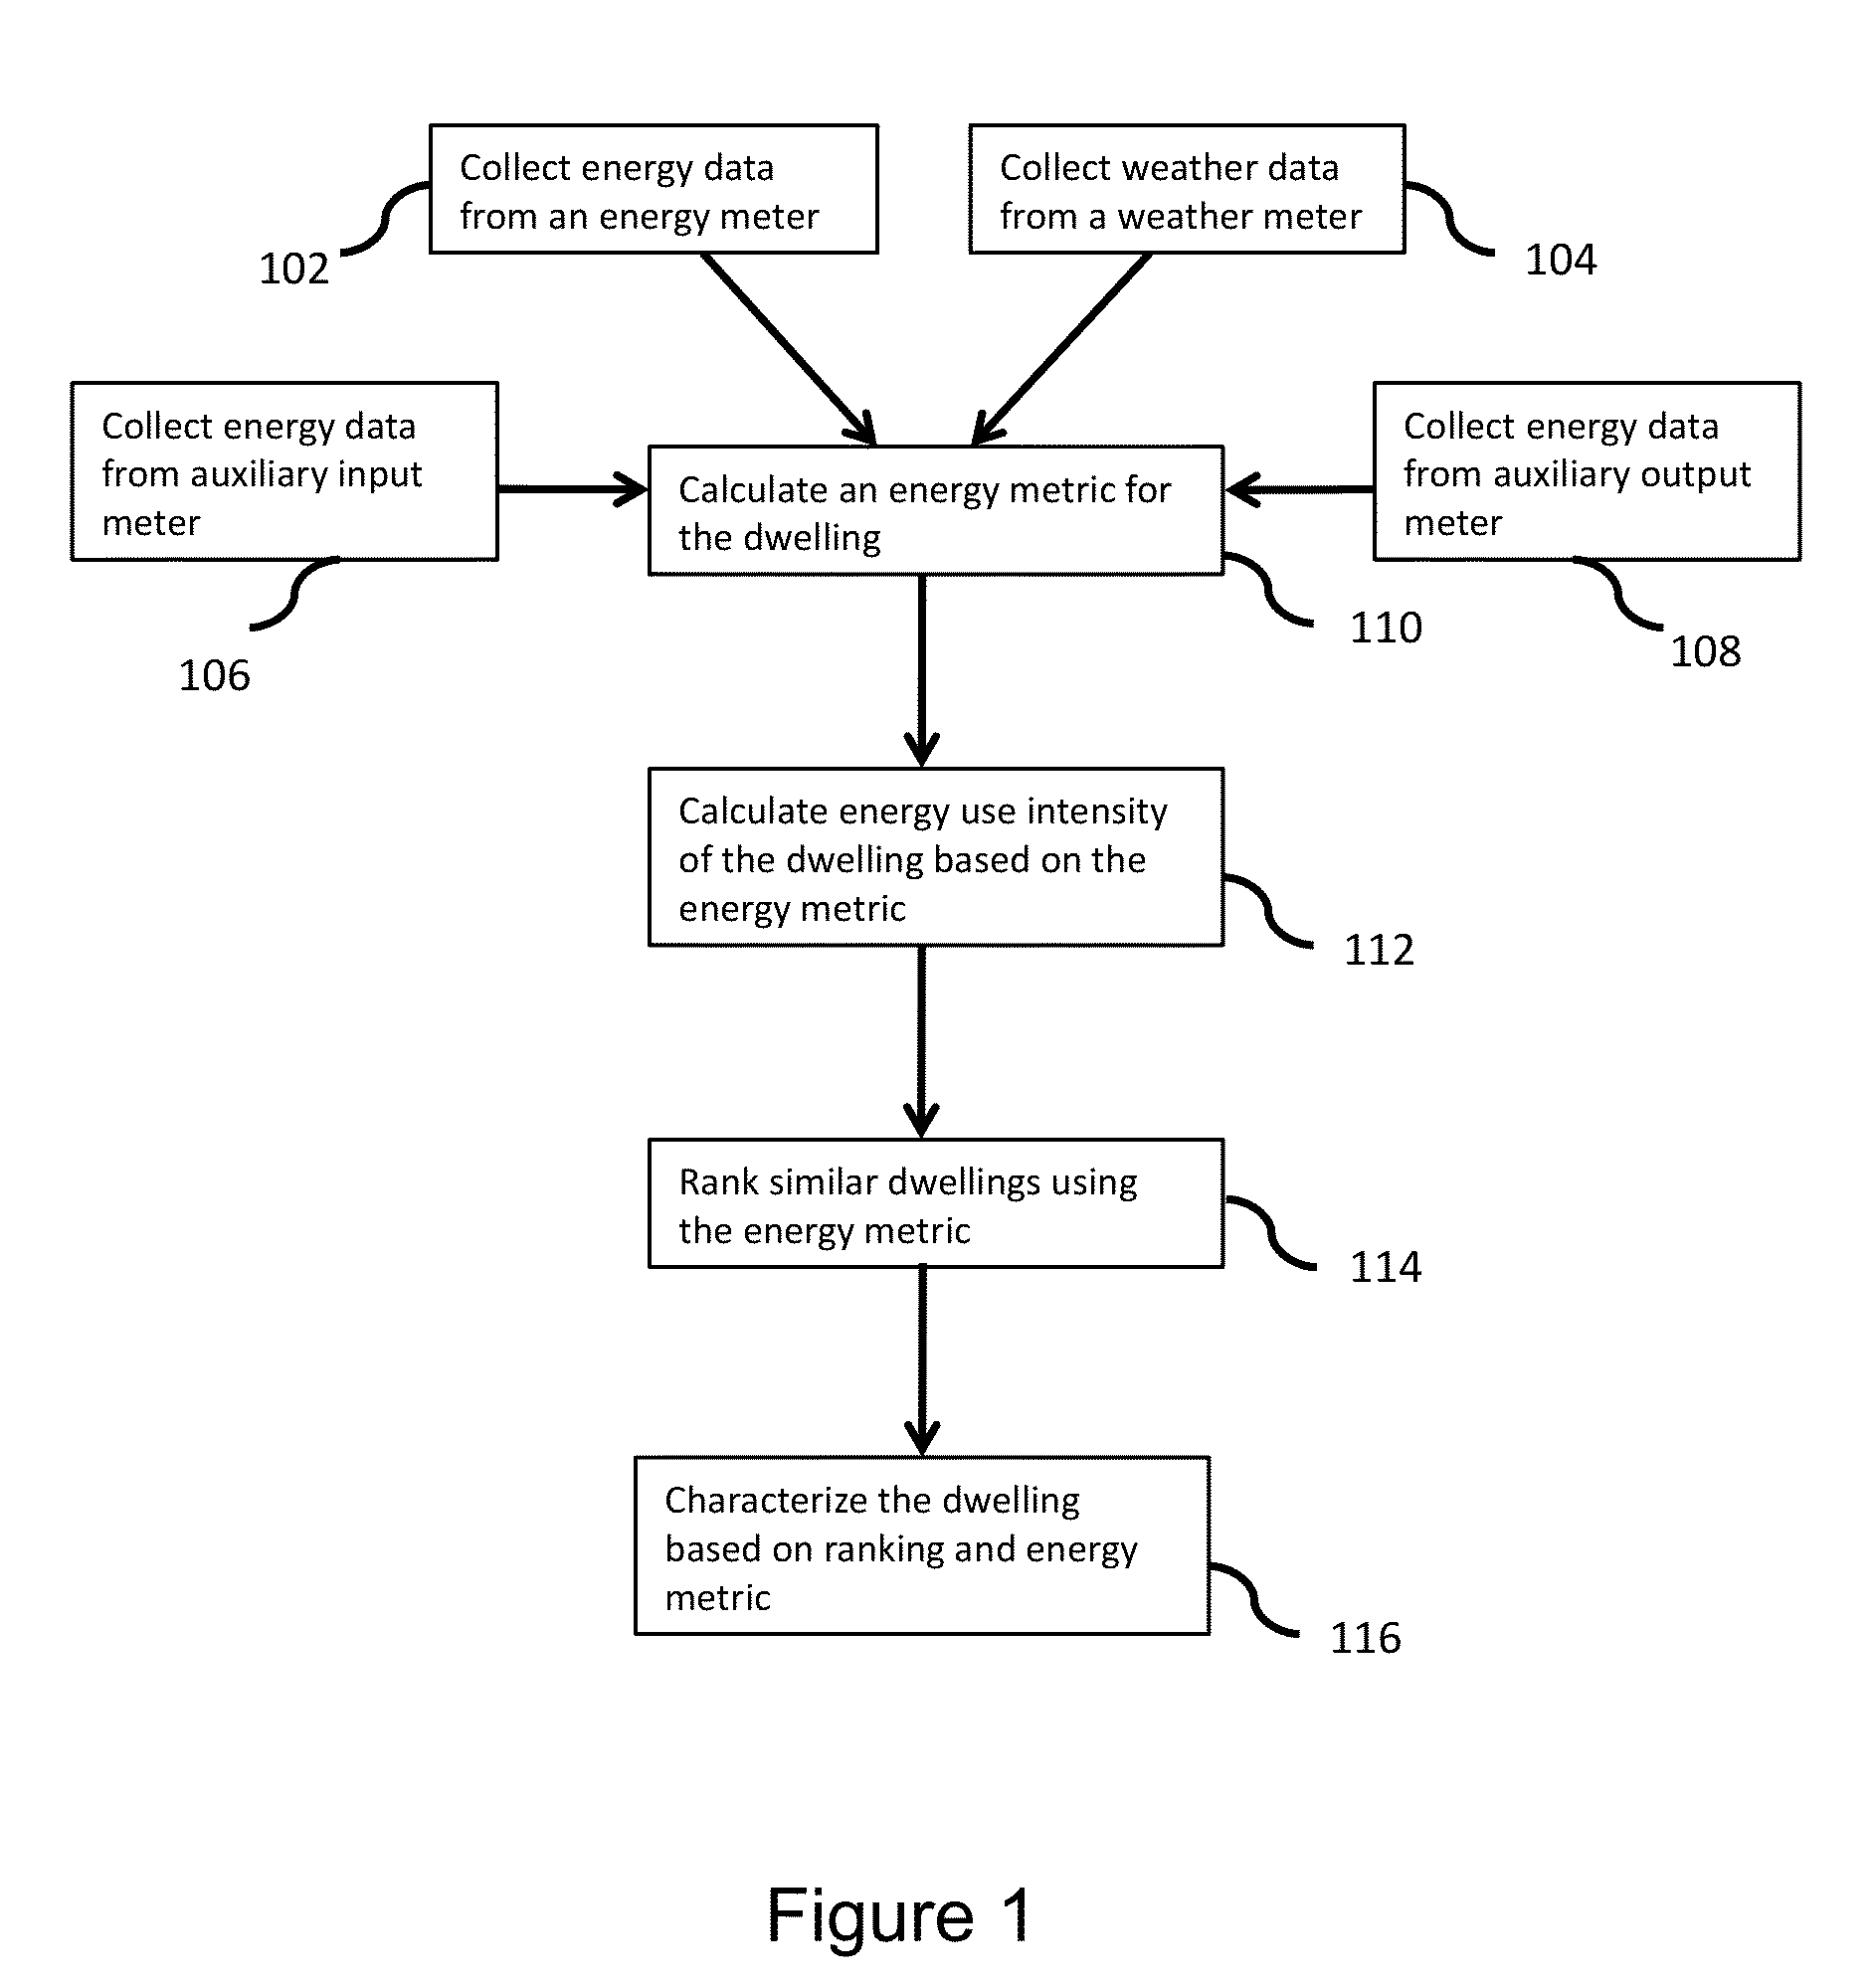
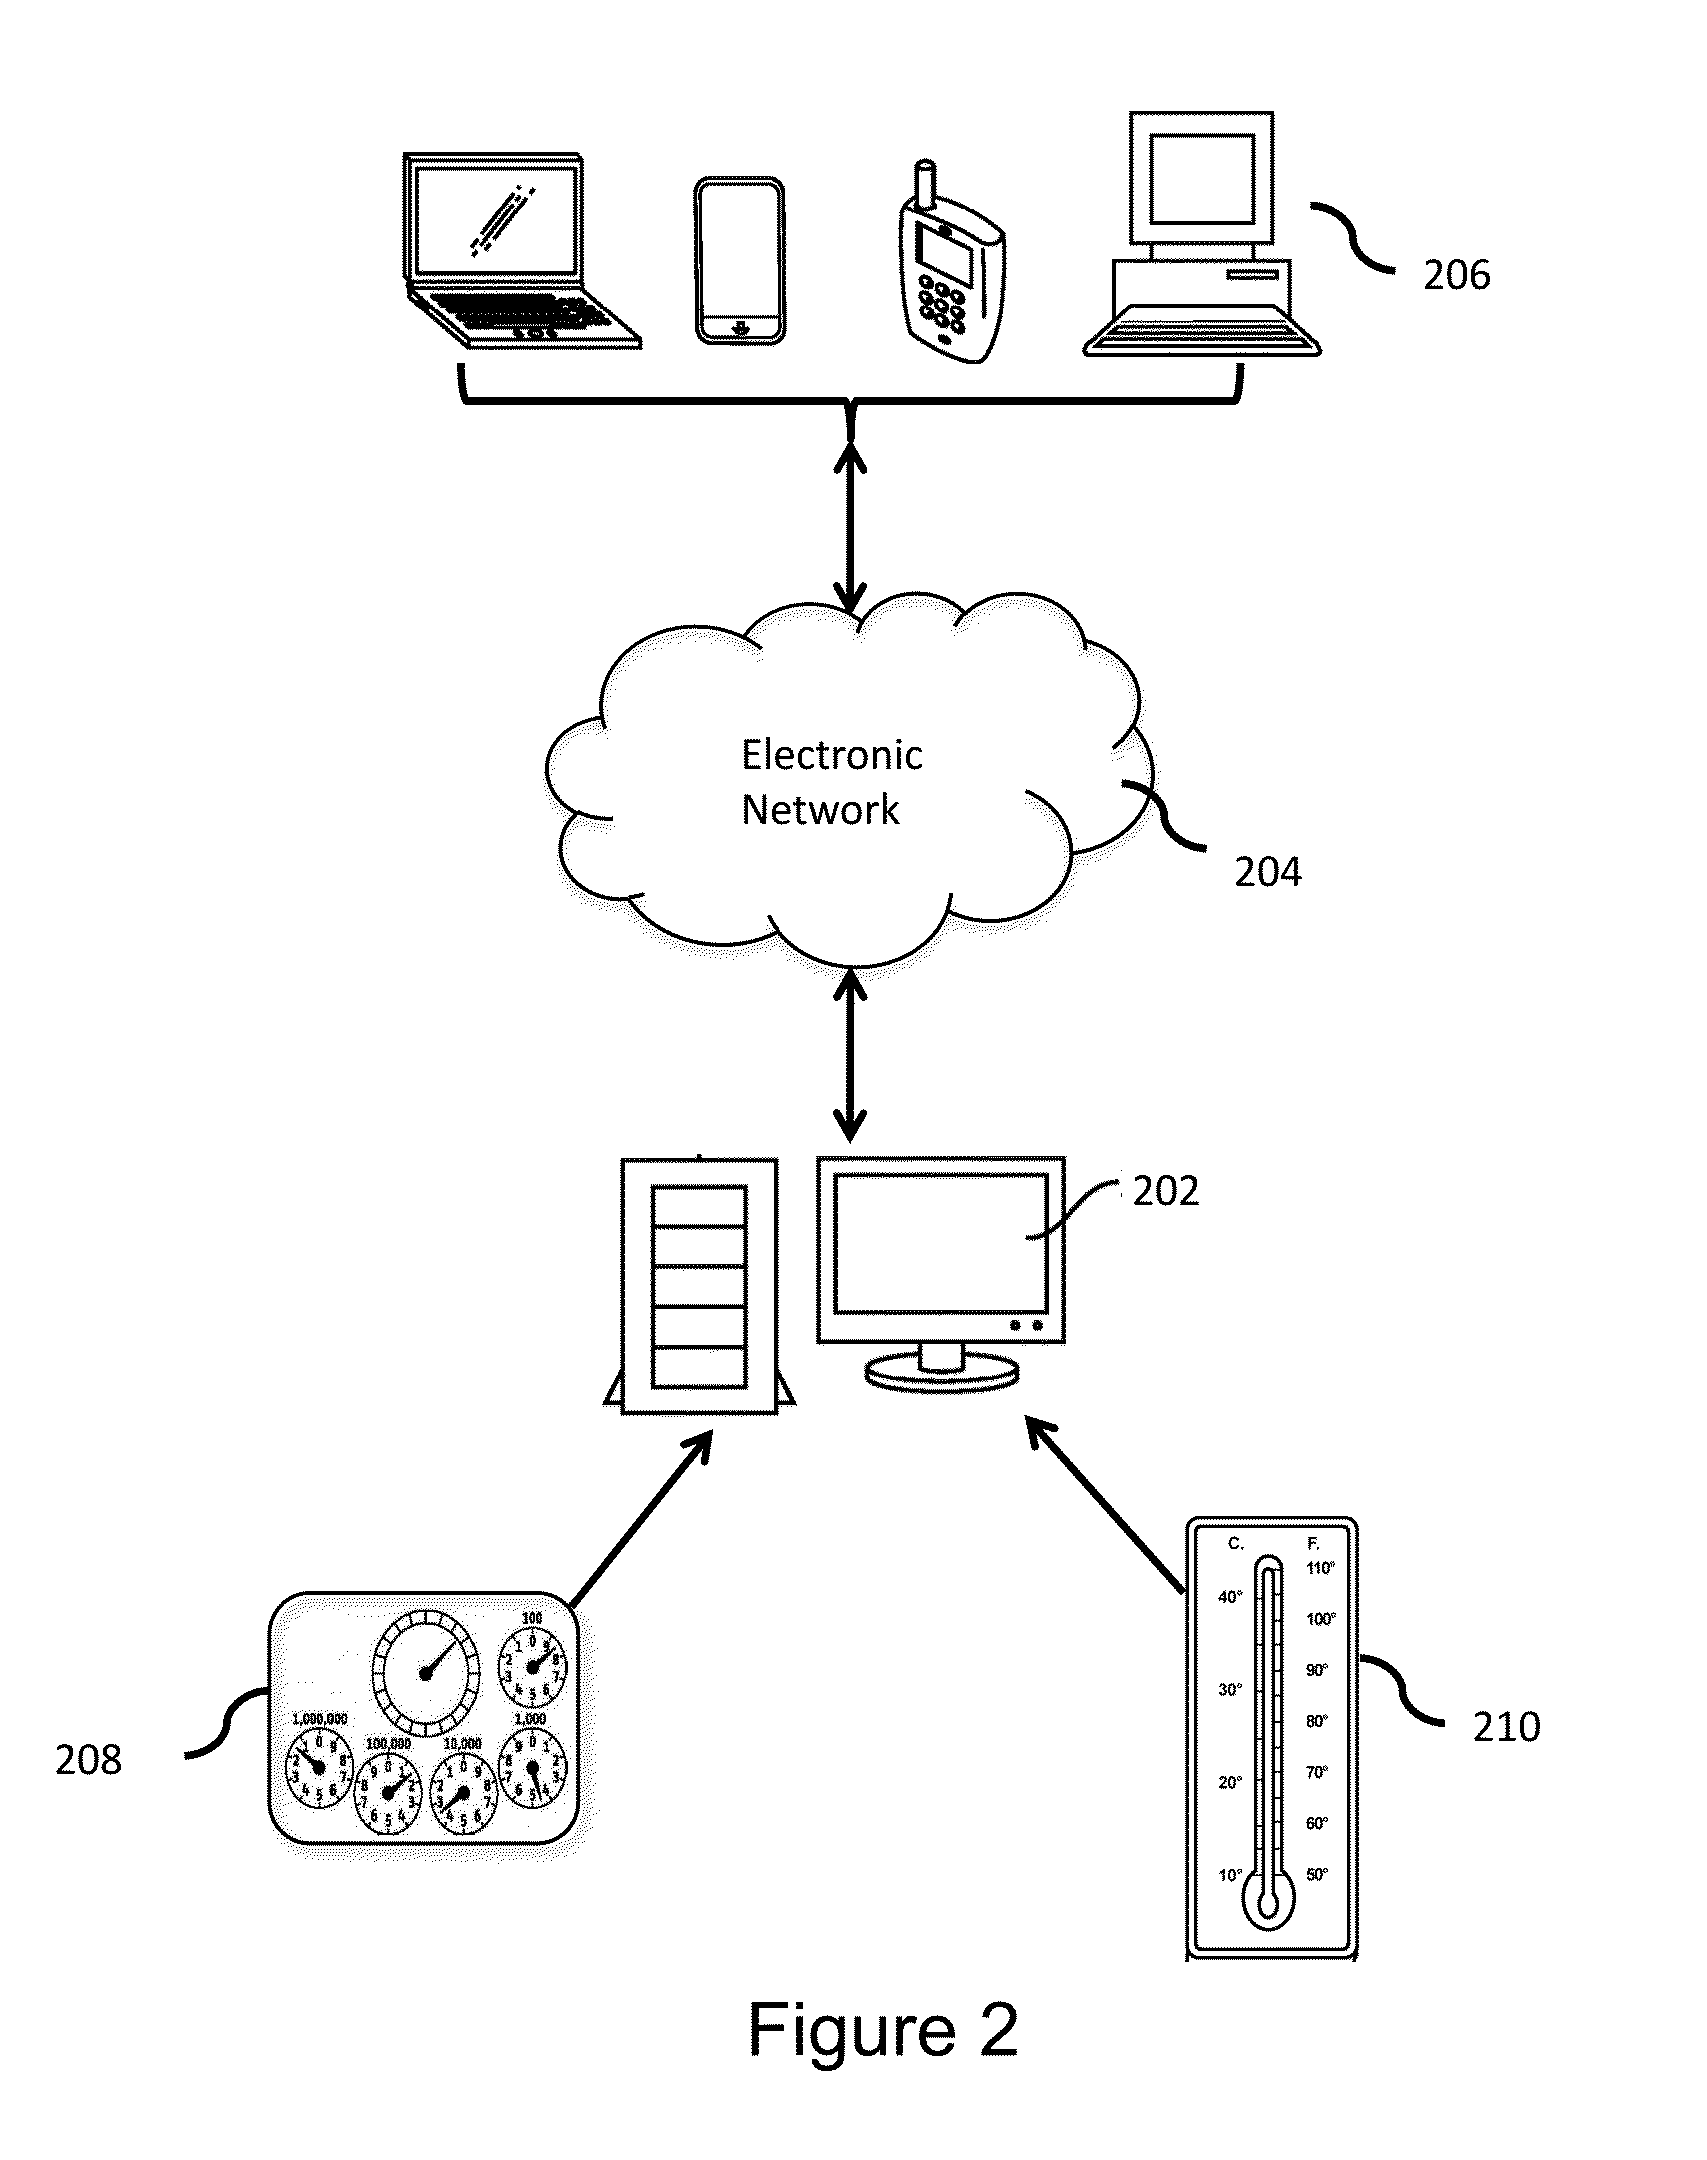
The patent provides a system and method for monitoring and improving energy efficiency in a home. This is done by obtaining energy and weather data from meters and using it to calculate energy metrics for the home. The home is then ranked in a peer group and identified as having energy inefficiency.Recommendations can be made to improve energy efficiency, such as upgrading insulation, reducing air infiltration, servicing or replacing HVAC systems, servicing or replacing electricity or natural gas consuming appliances, installing more energy-efficient lighting, changing landscaping, or educating occupants on energy-saving behaviors.

Problems solved by technology

For residential energy consumers, determining the most effective strategy to reduce energy consumption can be challenging given the lack of useful data collection, formatting, and analytic techniques Installation of local power sensors on high energy draw residential devices or branch circuits can make it possible to obtain itemized energy usage by appliance thereby indicating the time-based usage and energy cost for various appliances.
However, installing such devices can incur significant expense to the residential customer, sometimes in excess of the power saving that may result from action taken on the basis of the collected data.
Further, such signal processing analysis is generally limited to electrical disaggregation in the residential context due to resolution requirements, and therefore excludes analysis of other forms of energy consumed, such as fuels.

Method used


Image

  • System and method for residential utility monitoring and improvement of energy efficiency
  • System and method for residential utility monitoring and improvement of energy efficiency
  • System and method for residential utility monitoring and improvement of energy efficiency

Examples


example 1

Sample Energy Calculation

[0242]Dwelling unit energy characterization using the proposed system and method involves the interpretation of at least one energy metric and its associated ranking. Characteristics of the residential dwelling which contribute to the energy efficiency or inefficiency of the dwelling include: condition of the heating, ventilation, and air conditioning systems; the thermal insulative quality of the structure; the air infiltration of the structure; the efficiency of energy consuming appliances within the residential dwelling; and the energy consuming behavior of the occupants. A calculation of multiple energy metrics for a dwelling through a whole-building energy use model expressed as electricity consumption vs. heating degree days is shown in FIG. 4. The energy metrics depicted include the following:[0243]Non-temperature dependent energy use in energy units per time interval, both before and after a home energy efficiency improvement.[0244]Temperature depend...

example 2

Inefficient HVAC System

[0248]Shown in FIG. 5 is a set of four energy metric histograms for an individual dwelling. The histograms are each constructed by selecting one of many available energy metrics, computing the values for that energy metric amongst other dwellings in a comparison set, plotting all of the resulting data linearly, indicated the positions demarking the quartiles of distribution values in the comparison set, and indicating where on the distribution the particular dwelling subject to evaluation lies.

[0249]A given home or dwelling may be characterized by:[0250]A low relative rank compared to similar homes in total electric consumption in units of kWh per square foot per year[0251]A low relative rank compared to similar homes in total electric consumption above baseload in units of kWh per square foot per year[0252]A high relative rank compared to similar homes in total natural gas consumption in units of cubic feet (or therms) per square foot per year[0253]A high rel...

example 3

Inefficient Appliances

[0254]Inefficient electricity use may be the result of the conditions of the HVAC systems, the thermal envelope, the electricity consuming appliances, or another cause. The set of two energy metric histograms for a dwelling shown in FIG. 6 shows the following:[0255]A low relative rank compared to similar homes in annual electric baseload in units of kWh per square foot per year[0256]A high relative rank compared to similar homes in annual electric usage above baseload in units of kWh per square foot per year

[0257]The diagnosis for a home having this energy use profile is that there are inefficient electric appliances in the home, such as an old refrigerator or incandescent light bulbs. This is evident by the facts that the home is able to efficiently cool the conditioned space, but that in every month the baseload electric usage is unnecessarily high. Though there are multiple reasons why a home may have regular excessive consumption, a low CV(RMSE) or other re...


PUM


Abstract

A system and method of determining energy inefficiency of a dwelling comprising obtaining energy data, obtaining weather data, calculating at least one energy metric for the dwelling, and ranking multiple dwellings based on the at least one energy metric. The ranking of the dwelling indicates a source of energy inefficiency of the dwelling and can provide a recommendation to improve the energy efficiency of the dwelling.

Description

CROSS-REFERENCE TO RELATED APPLICATION[0001]This application is a Utility patent application based on a previously filed U.S. Provisional patent application, U.S. Ser. No. 62 / 132,470 filed on Mar. 12, 2015, the benefit of the filing date is hereby claimed under 35 U.S.C. §119(e) and incorporated herein by reference.FIELD OF THE INVENTION[0002]The present invention pertains to a system and method for residential utility monitoring and reduction of energy consumption. More particularly, the present invention pertains to a system and method for calculating an energy use profile for a dwelling from data obtained from an energy meter and a weather meter.BACKGROUND[0003]The United States has over 130 million housing units, and almost all of these dwellings have electricity service provided. Electricity service to U.S. housing units is provided by one of nearly 3300 electricity providers, over 2000 of which are publicly owned utilities and a further 800-plus are electric cooperatives. Elec...

Claims


Application Information

Patent Timeline
Patent Type & Authority Applications(United States)
IPC IPC(8): G05F1/66G05B15/02
CPCG05B15/02G05F1/66G06Q50/06
Inventor KAUFFMAN, DANIELMORGAN, SEBASTIAN
Owner KAUFFMAN DANIEL
Learn More