
Spectrum data processing device

a data processing and spectral technology, applied in the field ofspectrum data processing devices, can solve the problems of inconvenient processing, huge difference between mass spectrum, and inability to remove background, so as to reduce work load on the operator, prevent the fluctuation of identification, and ensure the accuracy of compound identification

Pending Publication Date: 2021-05-06
SHIMADZU CORP
View PDF6 Cites 0 Cited by
  • Summary
  • Abstract
  • Description
  • Claims
  • Application Information

AI Technical Summary

Benefits of technology

The spectrum data processing device described in this patent allows for automatic and reliable identification of compounds based on a difference spectrum or an original spectrum without background removal. This means that multiple compounds can be identified efficiently with minimal operator effort and the risk of identification fluctuating based on operator experience can be reduced.

Problems solved by technology

However, this solution is plagued by a background superimposed on a mass spectrum of the target compound.
When the actually measured mass spectrum under an unignorable influence of the background spectrum is used for the library search, the accuracy of the compound identification is compromised.
However, the processing is not suitable for removing a background spectrum derived from another compound with the peak overlapping with the peak of the target compound.
However, such automatic processing often leads to library search resulting in inappropriate compound identification due to a huge discrepancy between the background spectrum actually superimposed on the original mass spectrum and the estimated background spectrum resulting in a huge difference between the mass spectrum as a result of subtraction of the background spectrum and the actual mass spectrum of the target compound.
Such an optimum algorithm and time range are difficult to automatically determine, and thus in actual cases, an operator is required to visually check the waveform of a peak derived from the target compound on the chromatogram and a signal waveform around that time, to designate the appropriate algorithm and time range.
Such work is extremely cumbersome, and takes so much time especially when a sample includes multiple compounds to be identified.

Method used


Image

  • Spectrum data processing device
  • Spectrum data processing device
  • Spectrum data processing device

Examples


Embodiment Construction

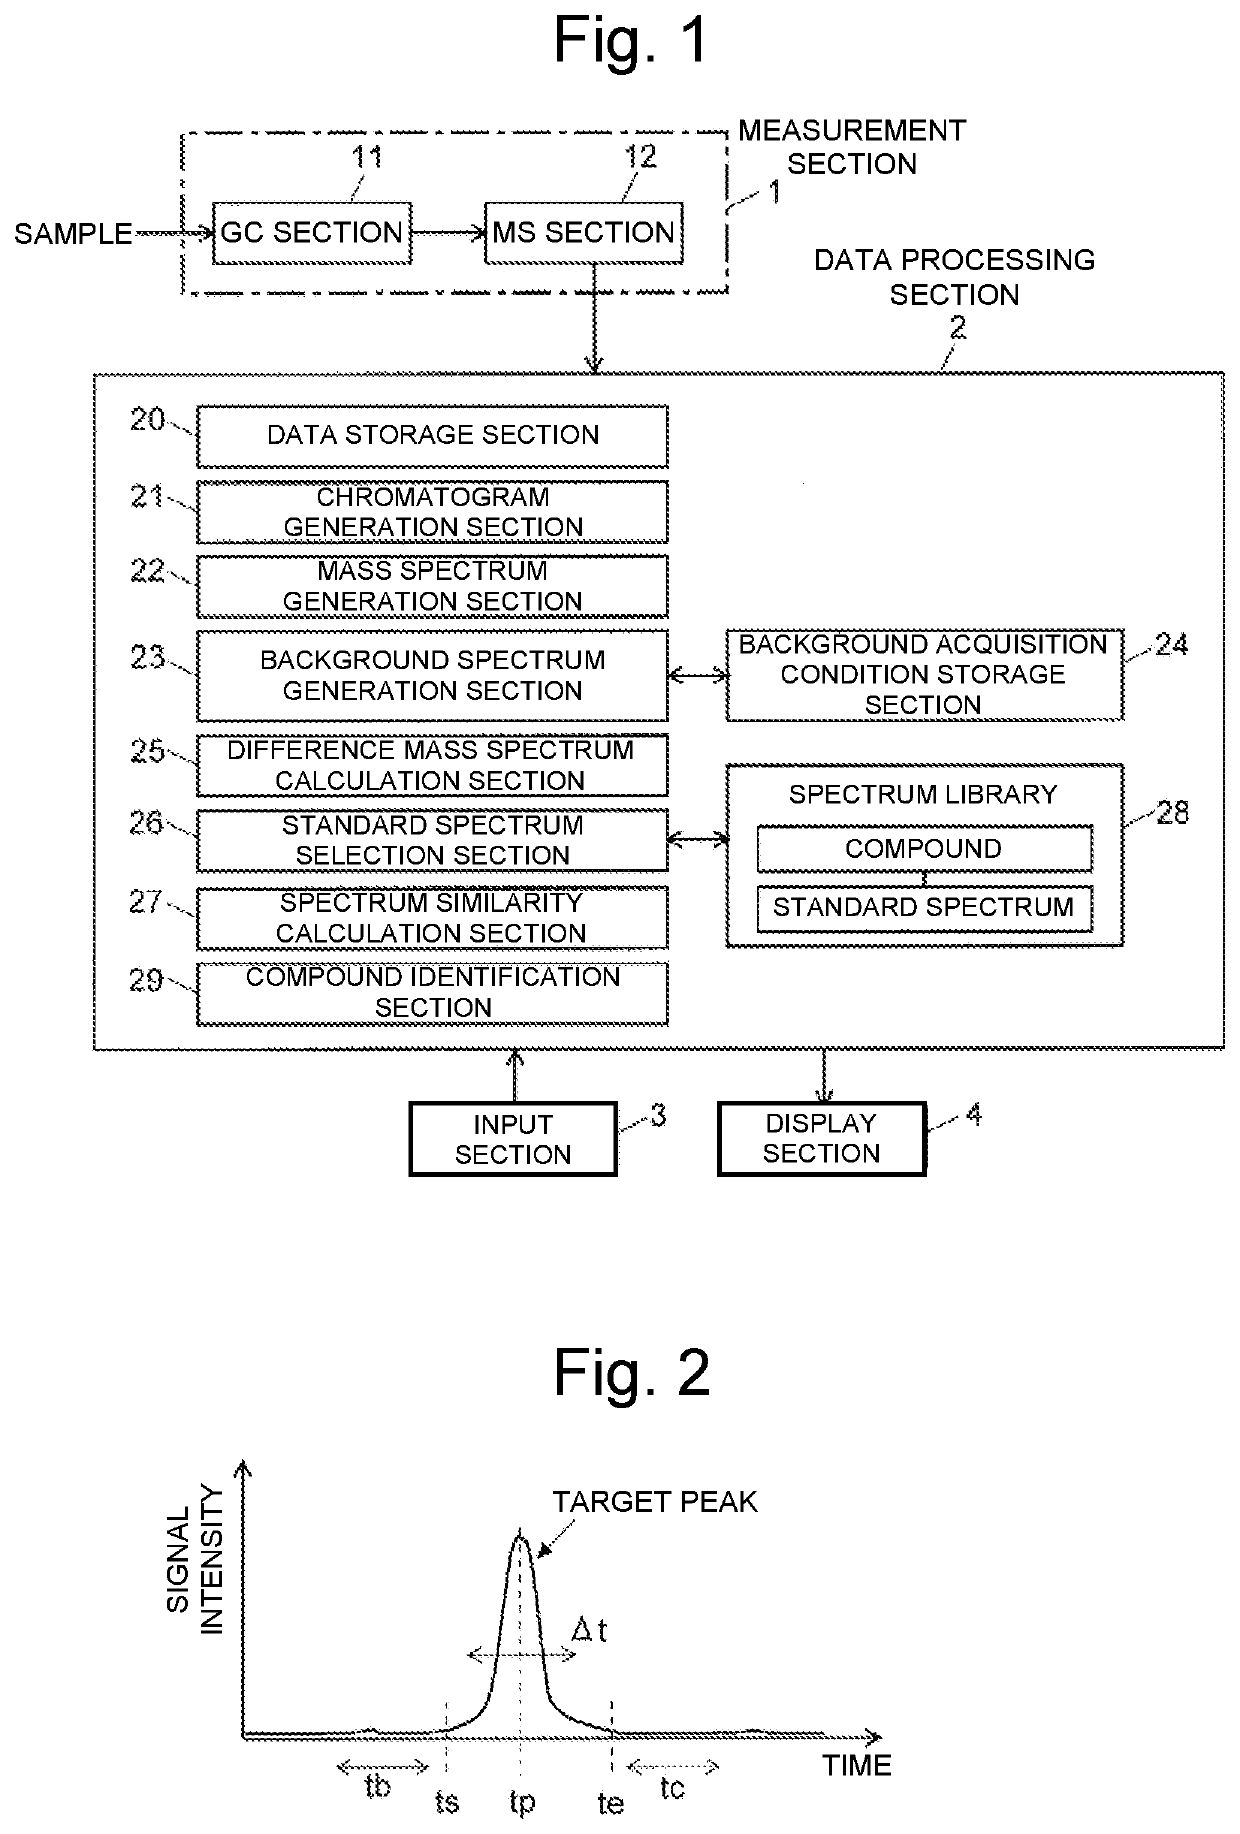
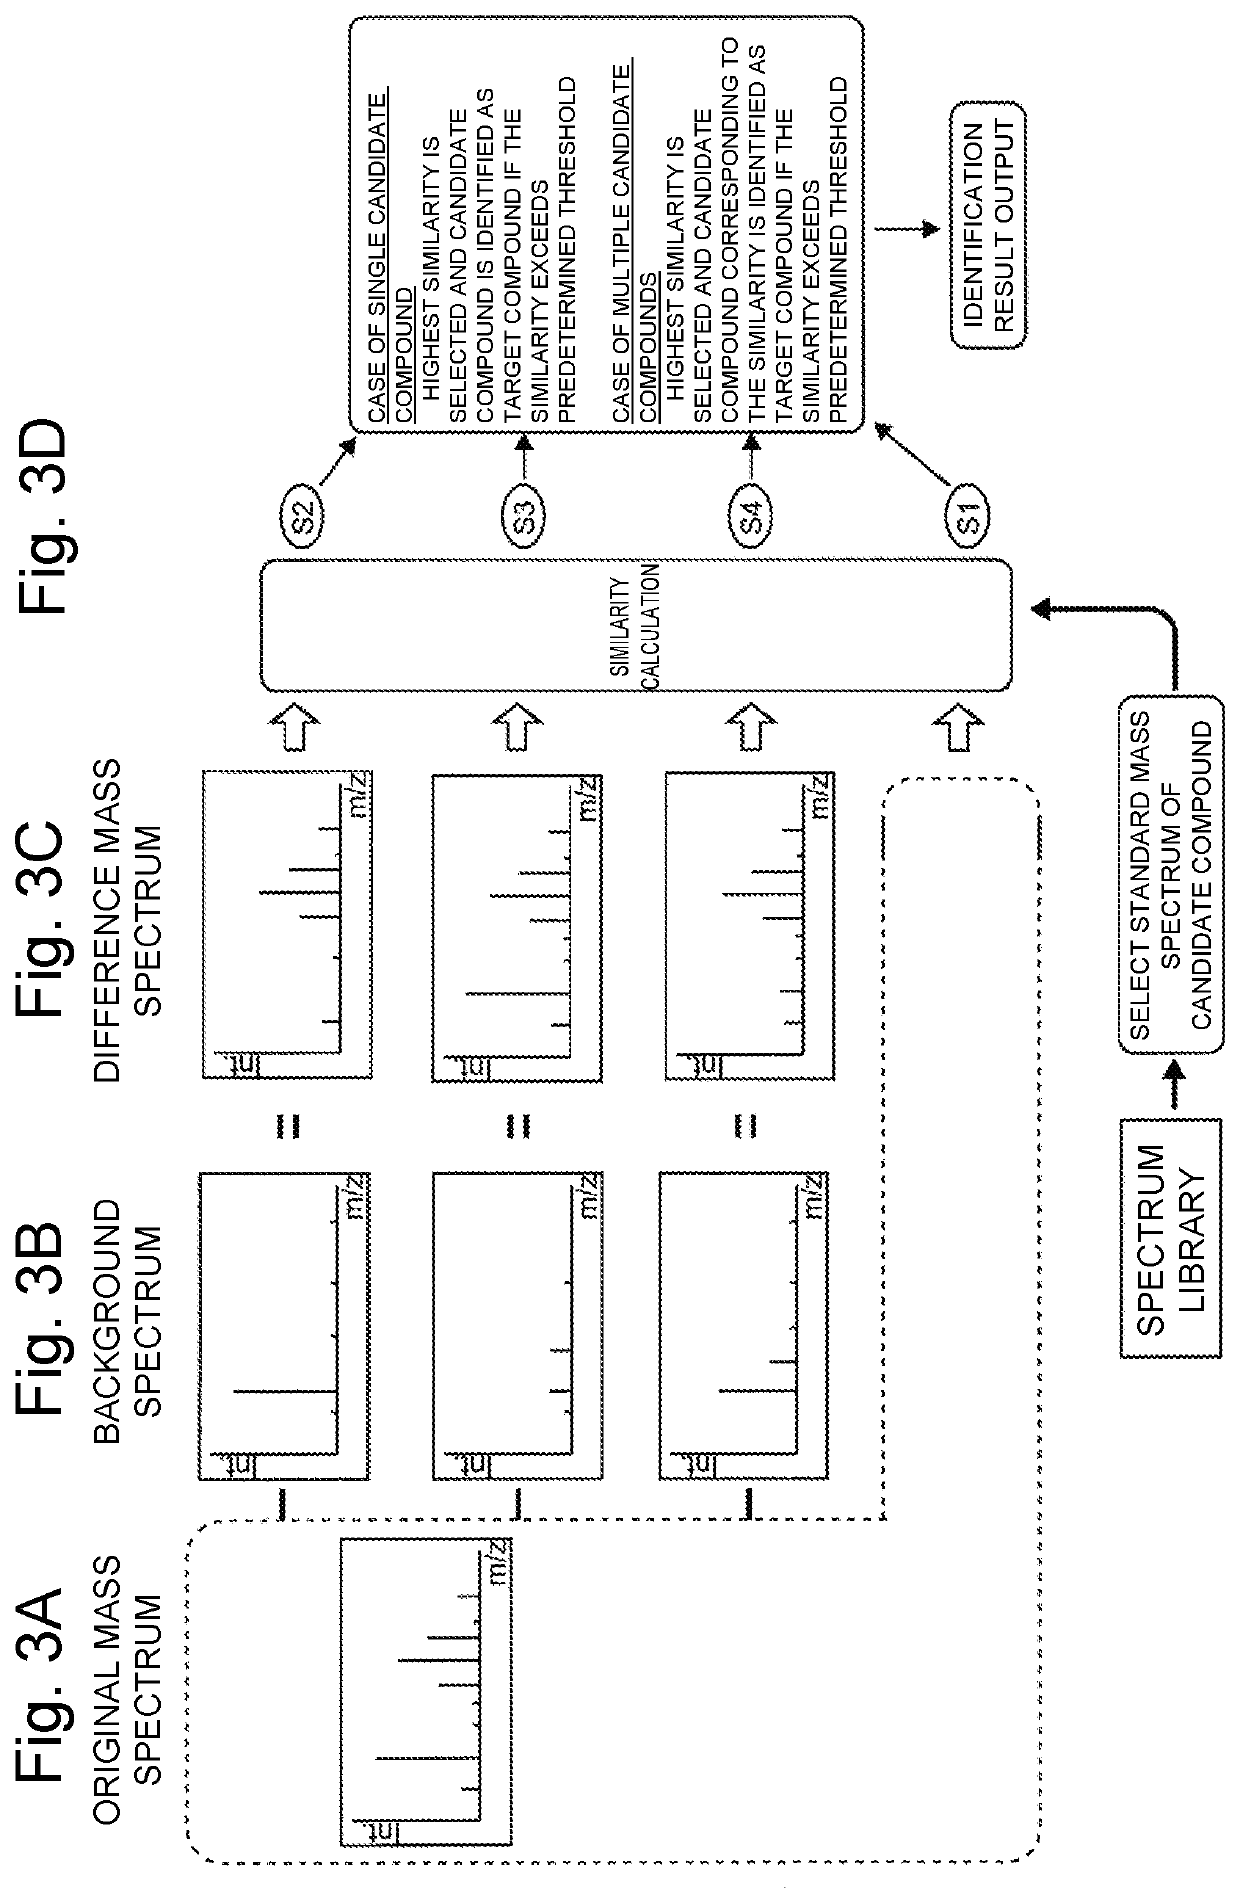
[0044]One embodiment of a gas chromatograph mass spectrometer (GC-MS) including a spectrum data processing device according to the present invention is described below with reference to the attached drawings. FIG. 1 is a diagram illustrating a configuration of a main part of the GC-MS according to the present embodiment. FIG. 2 is a diagram illustrating an example of a chromatogram obtained by the GC-MS according to the present embodiment. FIG. 3 is a diagram illustrating background removal processing and compound identification processing in the GC-MS according to the present embodiment.

[0045]As illustrated in FIG. 1, a measurement section 1 includes a gas chromatograph (GC) section 11 and a mass spectrometry (MS) section 12. The GC section 11 includes unillustrated components such as a column that temporally separates compounds in a sample, a sample vaporizing chamber that is provided at an inlet end of the column and vaporizes a liquid sample so that the sample is sent into the c...


PUM

PropertyMeasurementUnit
spectraaaaaaaaaaa
spectrumaaaaaaaaaa
difference spectrum calculationaaaaaaaaaa

Abstract

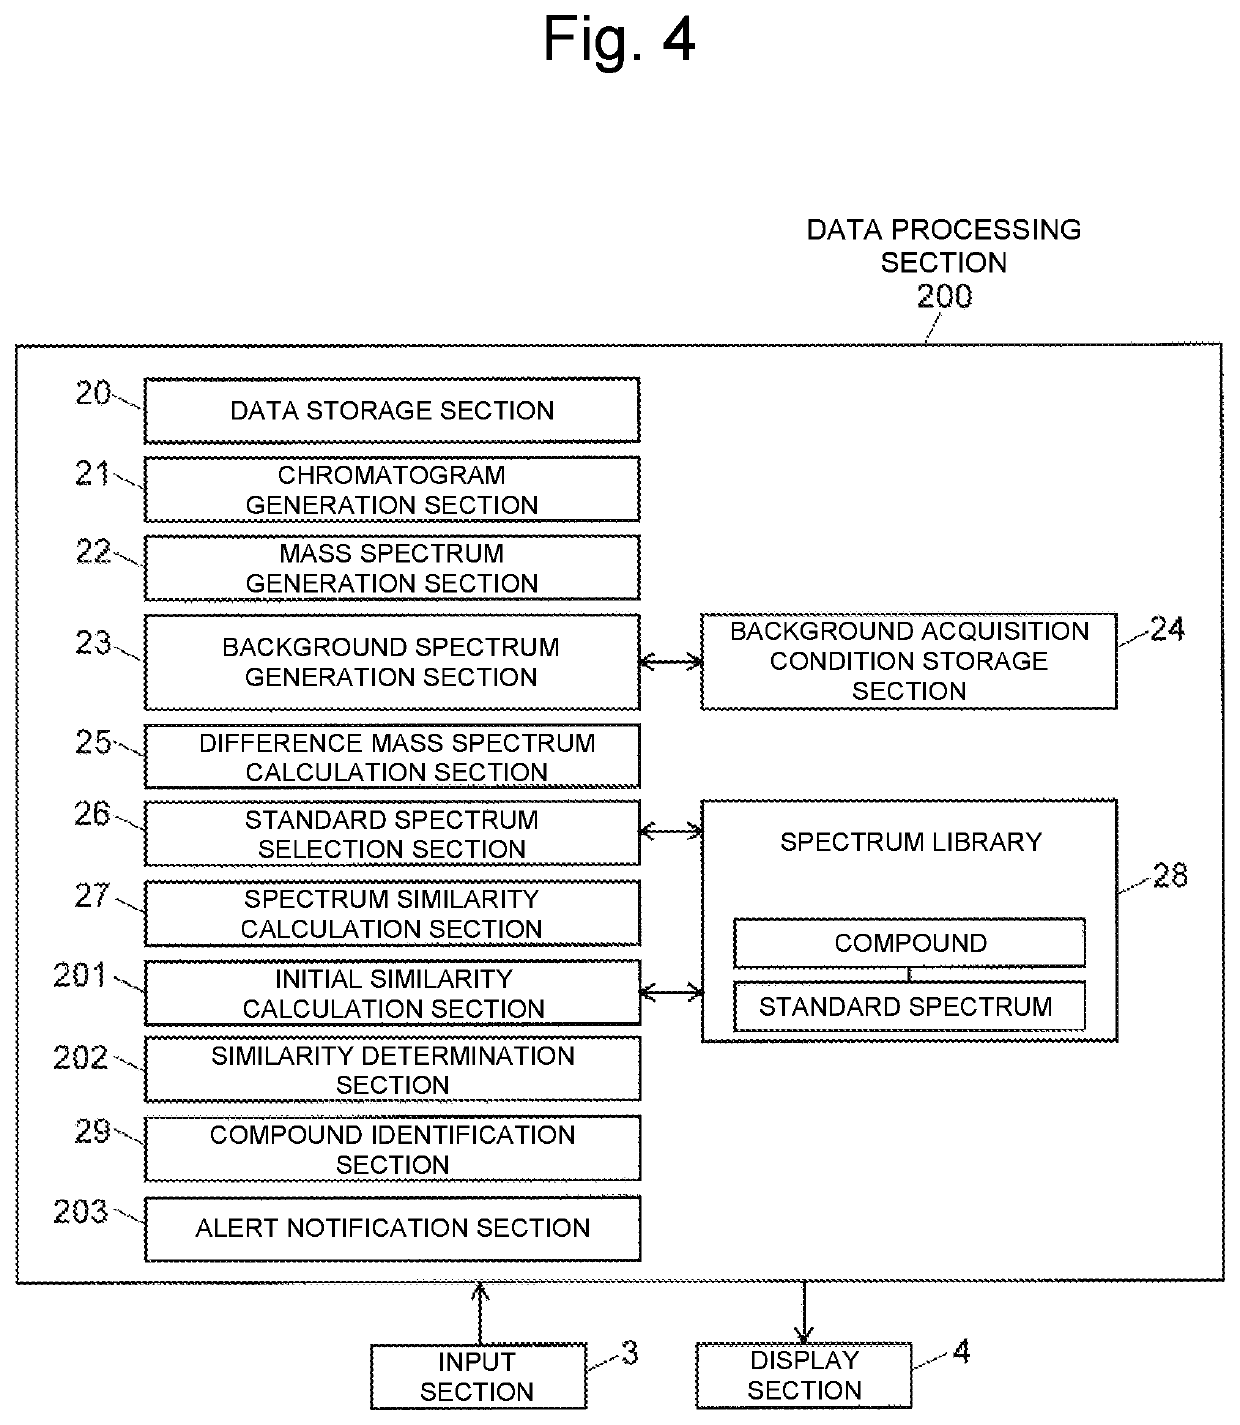
A mass spectrum generation section (22) generates an original mass spectrum at a peak of a target compound based on data acquired through analysis on a sample. A background spectrum generation section (23) generates a background spectrum in accordance with each of a plurality of predetermined background acquisition conditions. A difference mass spectrum calculation section (25) obtains a difference mass spectrum by subtracting the each background spectrum from the original mass spectrum, and a spectrum similarity calculation section (27) calculates a similarity between each difference mass spectrum and a standard mass spectrum of a candidate compound selected from a spectrum library (28). A compound identification section (29) identifies the candidate compound as the target compound if the highest similarity exceeds a predetermined threshold.

Description

TECHNICAL FIELD[0001]The present invention relates to a spectrum data processing device that processes spectra data obtained in a sample measuring device, such as a mass spectrometer, an absorption spectrometer, or a fluorescent X-ray spectrometer, and more particularly relates to a spectrum data processing device that identifies a compound in a sample using a spectrum.BACKGROUND ART[0002]Identification of a compound in a sample using mass spectrometry is generally achieved by library search using a spectrum library storing standard mass spectra of various compounds. Generally, in the library search, a similarity in spectrum pattern between an actually measured mass spectrum and a standard mass spectrum of each of the various compounds stored in the spectrum library is calculated. The actually measured mass spectrum is obtained by performing mass spectrometry on a sample including an unknown compound that is a target of identification. Then, the calculated similarity is compared wit...

Claims


Application Information

Patent Timeline
Patent Type & Authority Applications(United States)
IPC IPC(8): G01N30/86G01N30/72
CPCG01N30/8686G01N30/8679G01N30/7206G01N30/72G01N30/86G01N30/88G01N27/623
Inventor KAWAMURA, KAZUHIROKUDO, YUKIHIKO
Owner SHIMADZU CORP
Learn More