
Method, Software Module, and Integrated Circuit for Color Visualization and Separation

a technology of color visualization and integrated circuits, applied in image enhancement, instruments, recognition of medical/anatomical patterns, etc., can solve the problems of affecting expert interpretation, affecting the evaluation phase, and consuming time and effort, so as to improve the manual assessment and improve the quality of the evaluation phase. , the effect of simple and rapid separation of specific colors

Active Publication Date: 2021-05-27
UNIVERSITY OF HEIDELBERG
View PDF0 Cites 0 Cited by
  • Summary
  • Abstract
  • Description
  • Claims
  • Application Information

AI Technical Summary

Benefits of technology

The present invention provides a way to visualize and separate stained tissue images using a purely mathematical approach. This is efficient and can be translated into better manual assessment of st Torres, M. M. J. S. J. A method for analyzing stained tissue images using quaternionic representations and simple algebraic operations. The technique allows for easy visualization and separation of chromogen information, which can improve the accuracy of diagnosis and reduce the need for extensive training. The invention also provides a faster and more accurate way to analyze stained areas and improve the efficiency of automated algorithmic workflows.

Problems solved by technology

However, visual scoring is time consuming and may be subjective.
The processing of images for the identification of specific colors is, for example, performed using color deconvolution algorithms; these require plenty of resources and can have relatively long computation times. The identification of specific colors in color images represents a bottleneck that slows down the evaluation phase significantly.
The larger the image, typically the more computing resources and time is required for identifying specific colors.
The prior art identified above does not identify color visualization and separation in images as a potential application and fails to describe unsupervised or supervised color visualization (re-colorization and decolorization) or color separation in natural and medical images.

Method used


Image

  • Method, Software Module, and Integrated Circuit for Color Visualization and Separation
  • Method, Software Module, and Integrated Circuit for Color Visualization and Separation
  • Method, Software Module, and Integrated Circuit for Color Visualization and Separation

Examples


examples

[0077]Examples are provided in FIGS. 4 to 6 by applying a method according to the present invention for color visualization and separation of an image.

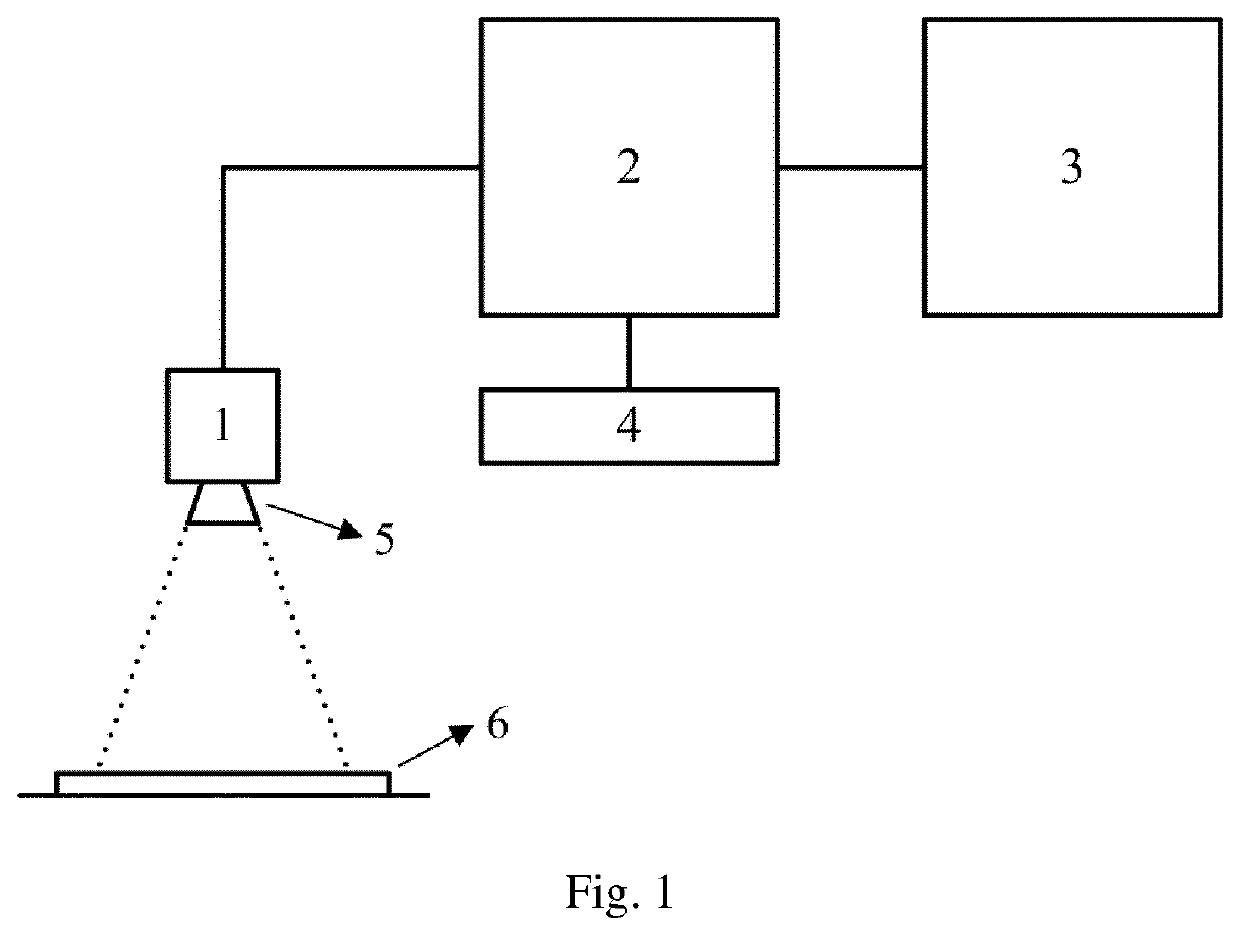
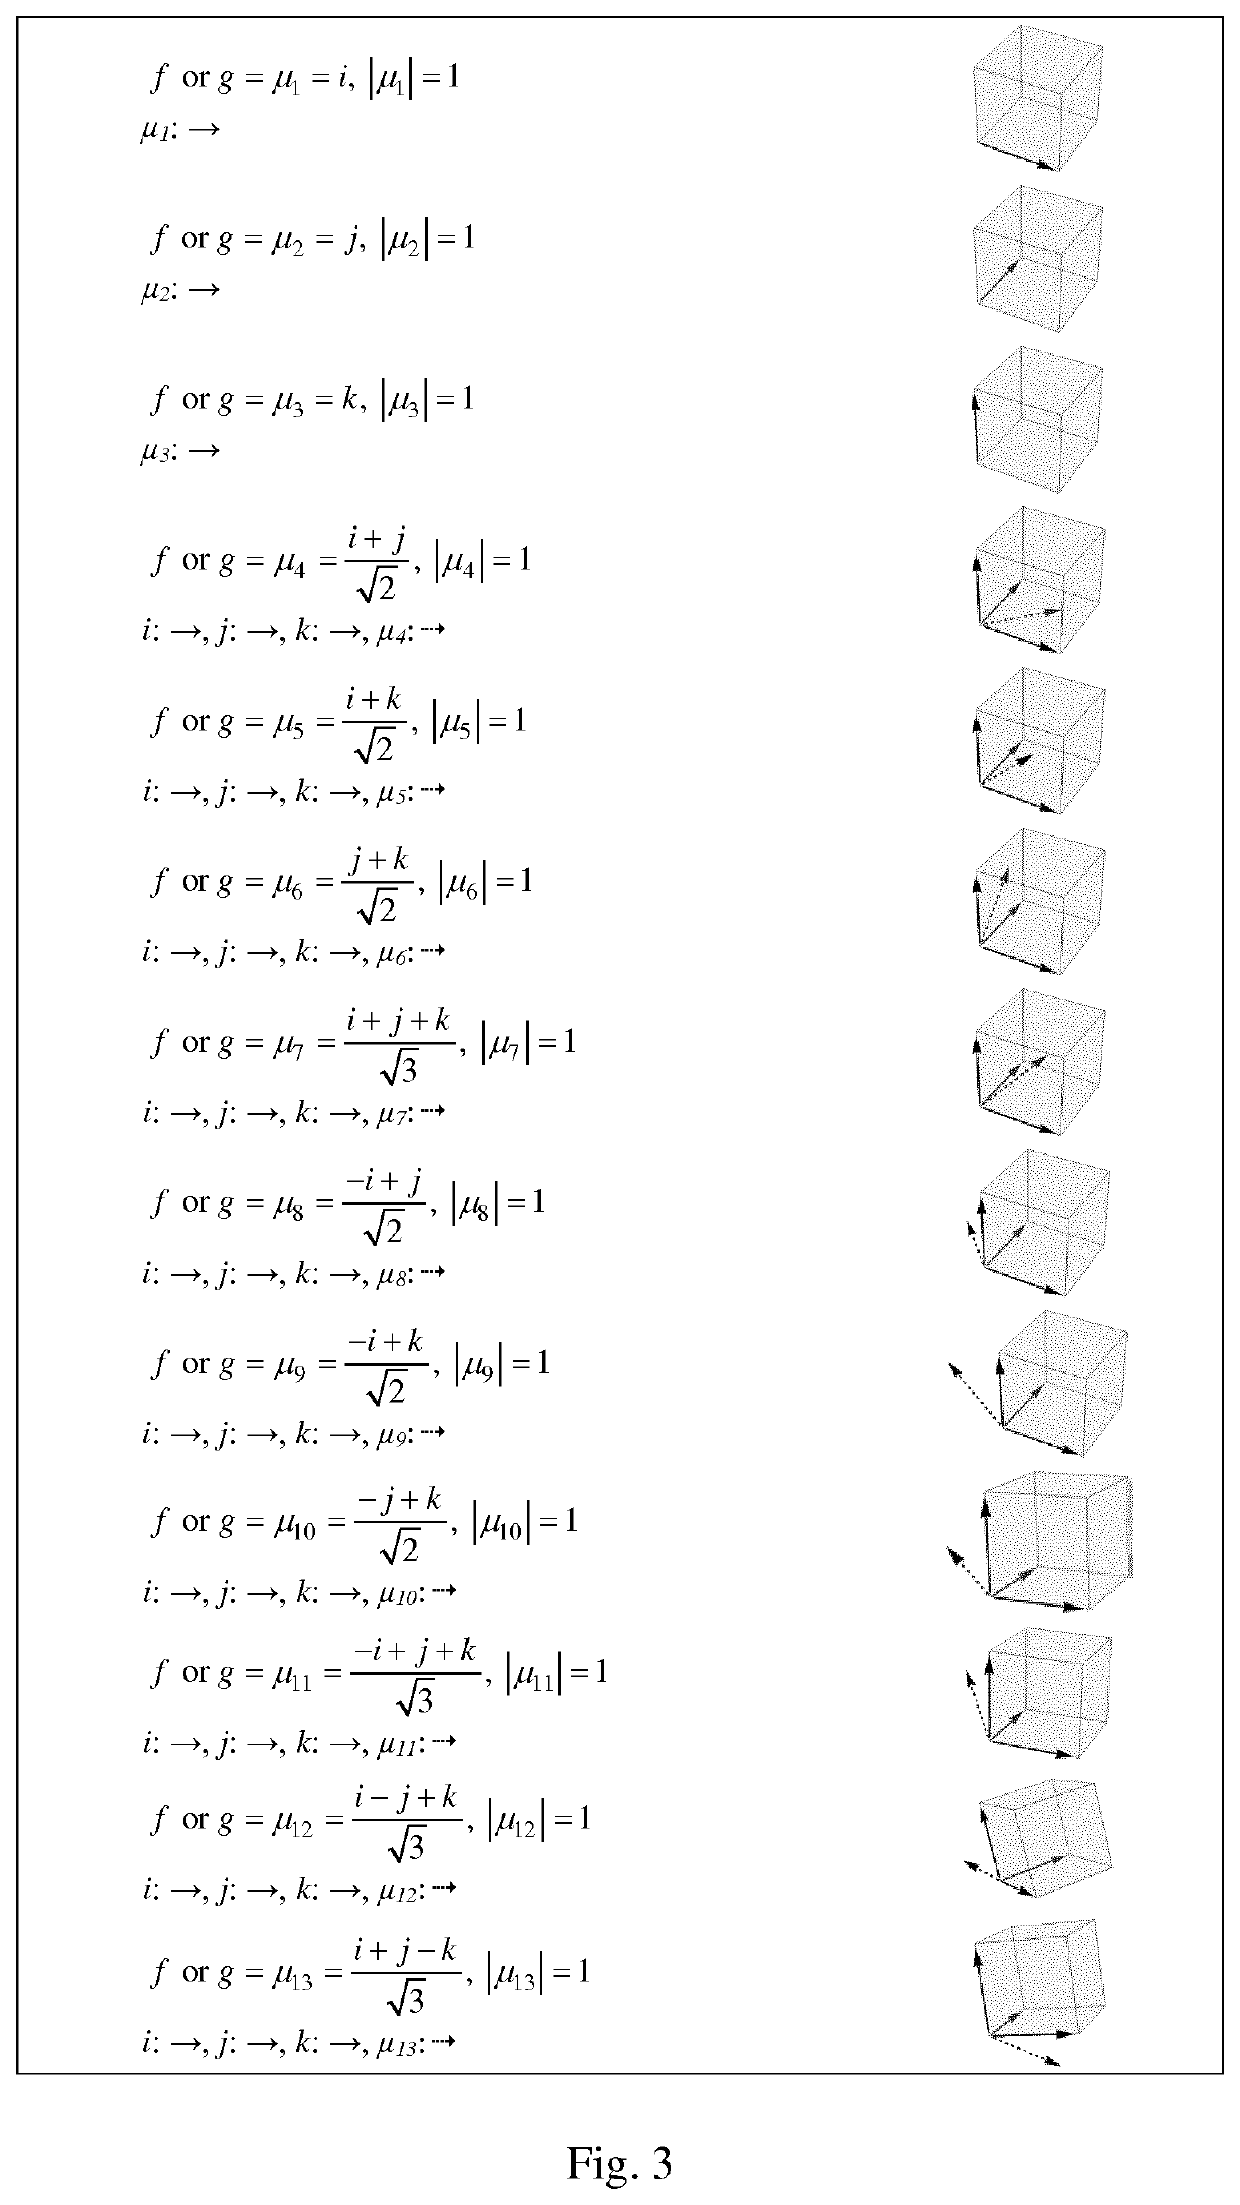
[0078]The first example A1 is a method for the visualization of certain colors in an image. This example comprises the following steps:[0079]Input a color image (elements ∈) and convert to a quaternion matrix (elements ∈).[0080]Perform the orthogonal 2D planes split using any pure unit quaternion combination of interest from μ1 to μ13 (elements ∈).[0081]Convert quaternion matrix to three real matrices corresponding to the three-color channels R, G, and B (elements ∈).[0082]Normalize the values of each matrix or entire array to the range 0 to 1 using corresponding minimum and maximum values (elements ∈).[0083]Concatenate the three matrices into one and output a color image (elements ∈).

[0084]A color image (e.g. RGB) comprises pixels each having three components which represent values for the colors red, green and blue. The pixels form ...


PUM


Abstract

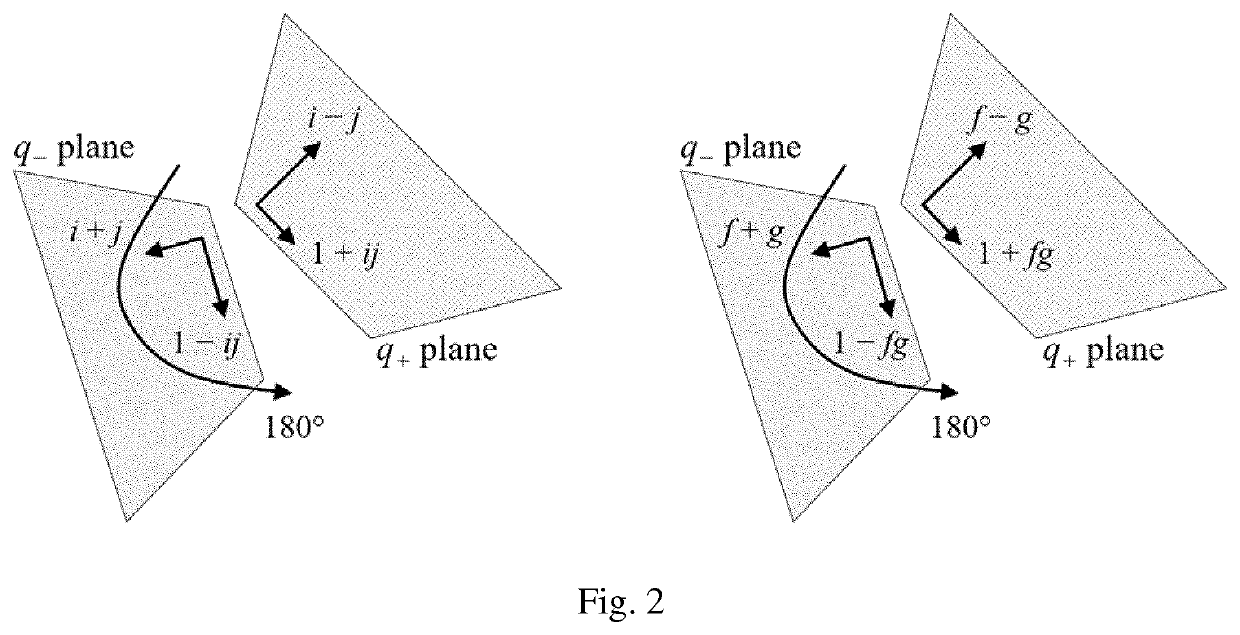
The present invention relates to a method for color visualization and separation of a natural and medical image comprising pixels defined by color pixel vector a=[a1a2, a3] in a Cartesian color space (e.g. RGB), where the color pixel vector is represented by a pure quaternion q=+a1i+a2j+a3k with i,j, k satisfying: i2=i2=k2=ijk=−1, ij=−ji=k,jk=−kj=i, ki=−ik=j and the image is decomposed into q+ and q using the orthogonal 2D planes split concept according to: (formula (I)) wherein / and g are pure unit quaternions or f and g describe interactively determined or computed colors (s1, s2). The method allows not only visualizing and separating certain colors in a digital image in a rapid fashion, but also permits a flexible definition pertinent to the kind of colors that can be visualized or separated by defining the corresponding decompositions by means of pure unit quaternions / and g. Colors s1, s2 can be defined manually or computed automatically from the image.

Description

[0001]The present invention relates to a method, a software module, and an integrated circuit for color visualization and separation. The present invention relates particularly to a method, software module, and an integrated circuit for medical image analysis.BACKGROUND OF THE INVENTION[0002]Color separation and visualization is resource and time consuming, therefore there is a need for rapid (real-time or near real-time) and efficient solution of these issues.[0003]The automatic analysis of images is important in many fields like medicine, scientific research, social media, multimedia and graphics, aeronautics, deep sea and space exploration, computational photography, etc.[0004]In medical diagnostics and in particular in pathomics, specifically marked antibodies are used to stain proteins in situ. Analyzing the intensity and distribution of stained tissue at specific locations of interest can provide clinically important information regarding disease (e.g. cancer) diagnosis or pro...

Claims


Application Information

Patent Timeline
Patent Type & Authority Applications(United States)
IPC IPC(8): G06T7/11G06T11/00G06T7/90G06T7/00G06K9/46G06K9/62G16H30/40G16H70/60
CPCG06T7/11G06T11/001G06T7/90G06T7/0012G06K9/4652G06T2207/30024G16H30/40G16H70/60G06T2210/41G06K2209/05G06K9/6256G06V2201/03G06F18/214
Inventor VALOUS, NEKTARIOSHALAMA, NIELSZOERNIG, INKAJÄGER, DIRK
Owner UNIVERSITY OF HEIDELBERG
Learn More