The increasing utilization of distributed
energy resources (DERs) such as rooftop solar has brought about environmental benefits but has also reduced the accuracy of the load forecasts that
system operators use to optimize the resources of the
power grid.
This profile is believed to
pose a significant technological challenge to
system operators.
Other regions vulnerable to this challenge include, by way of illustration, the New York City
electricity zone, a region in which the load forecast errors can have significant consequences for the cost of balancing
electricity supply with demand because of the congestion in the transmission lines that feed into NYC from upstate New York.
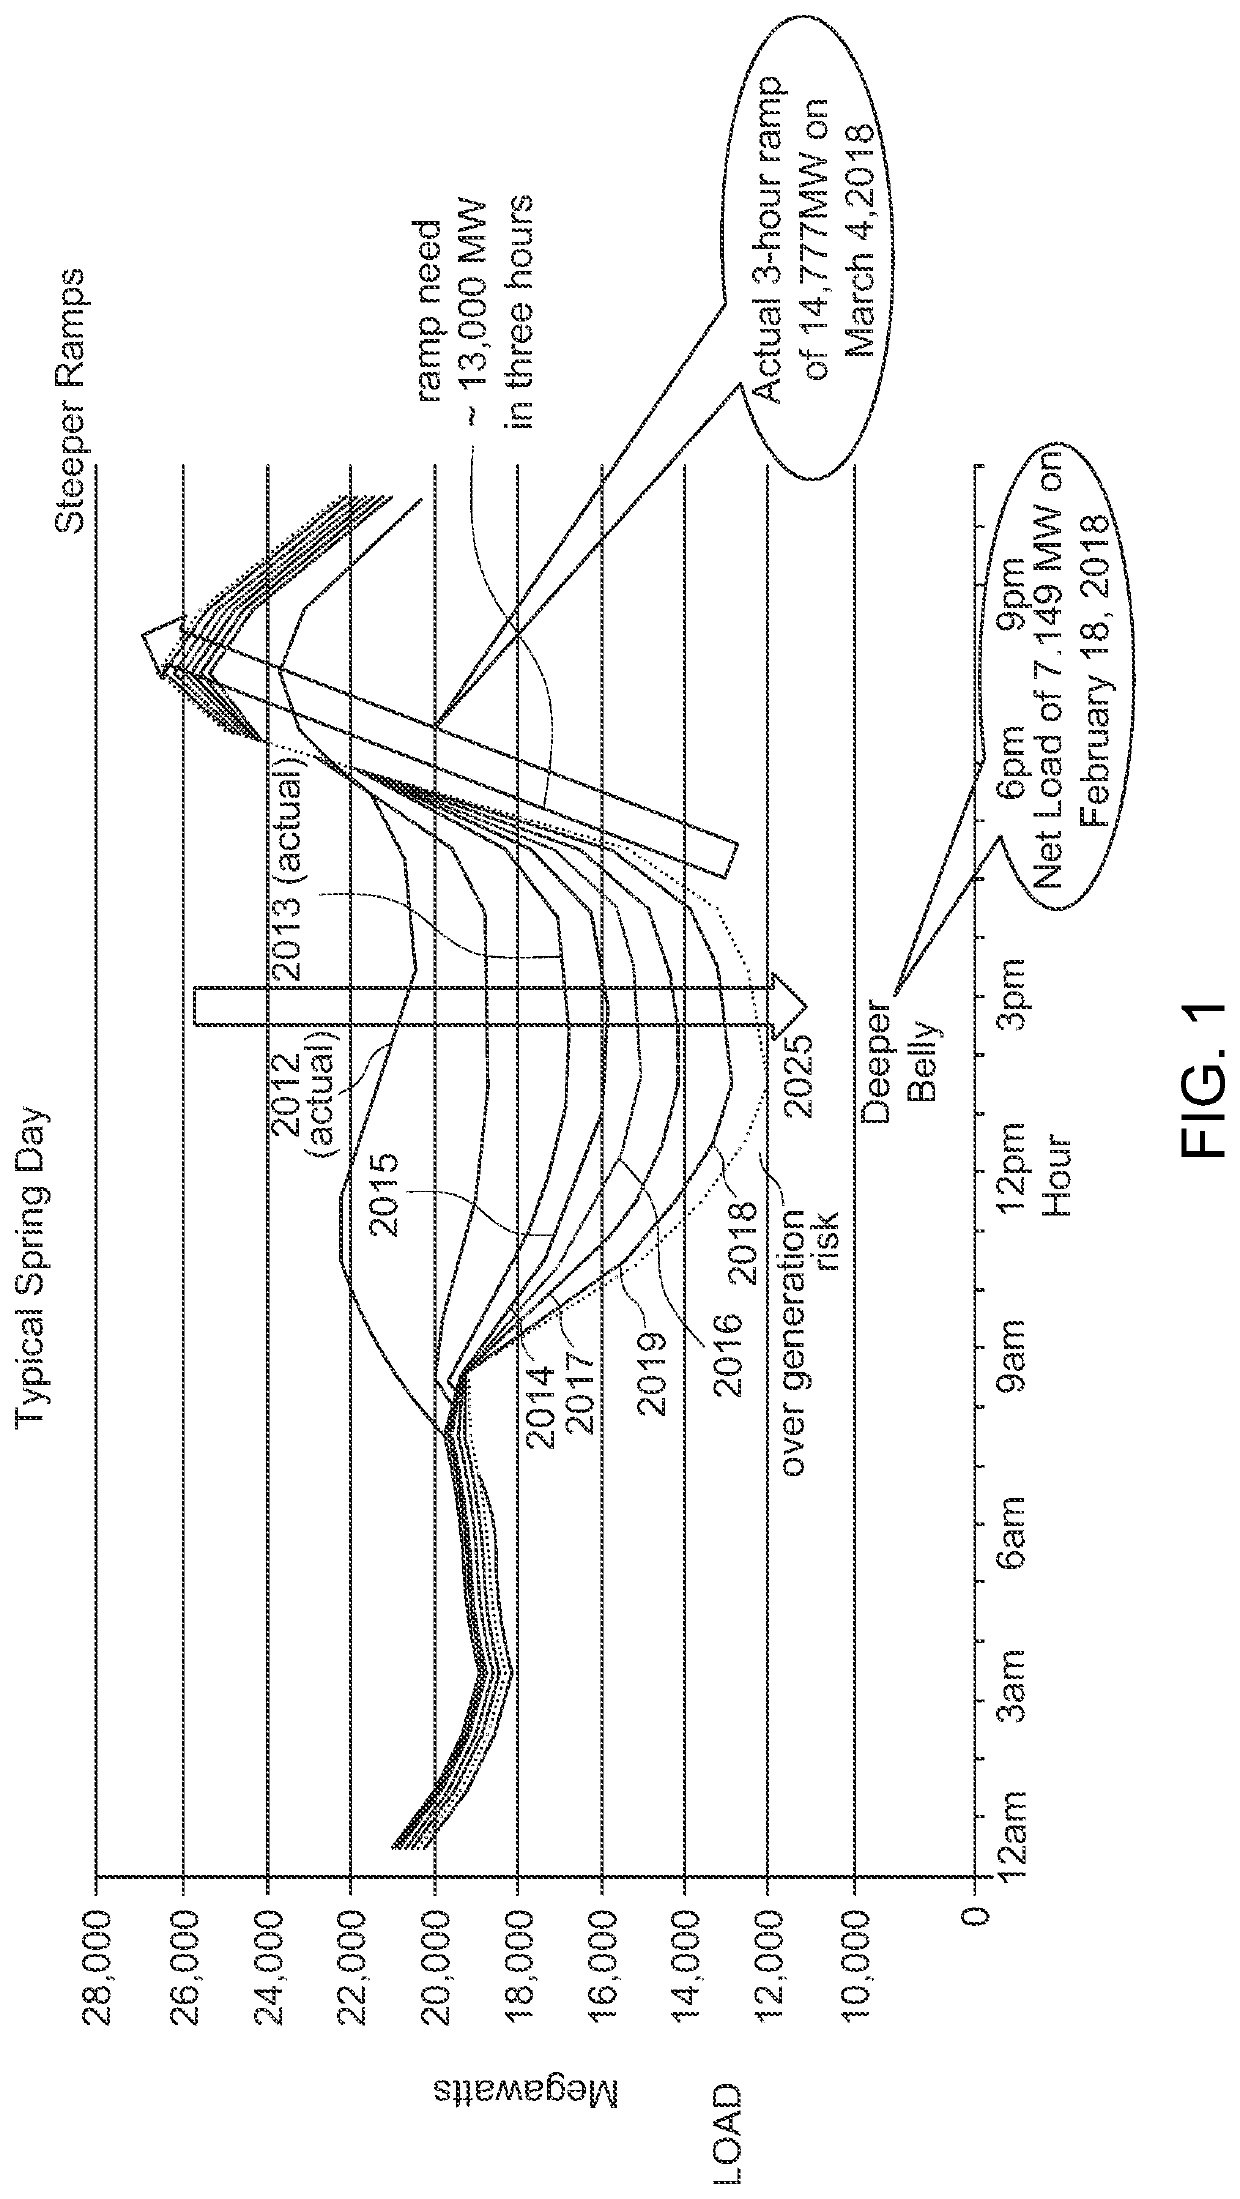
The “Duck Curve” phenomenon is believed to represent a significant operational challenge to system operators because of the associated reduced accuracy of the forecasts that system operator computer systems use to optimize the resources of the
power grid.
3) have suggested that the “belly” portion of the curve could result in overgeneration and a subsequent excessive level of curtailed
renewable energy.
Technological challenges associated with existing computer systems and grid networks have proven formidable.
Other technical challenges raised by the Duck curve relate to the neck of the duck, i.e., the steep ramp-up in utility generation late in the day.
The ramp in net load may be a significant concern because of generation ramping constraints and the uncertainty of the required ramp.
CAISO has further noted that “Ramps are increasing and present a risk going forward if sufficient ramping capability does not exist” (CAISO, 2018, p.
Technological challenges associated with these ramps have also proven formidable for existing computer systems and grid networks.
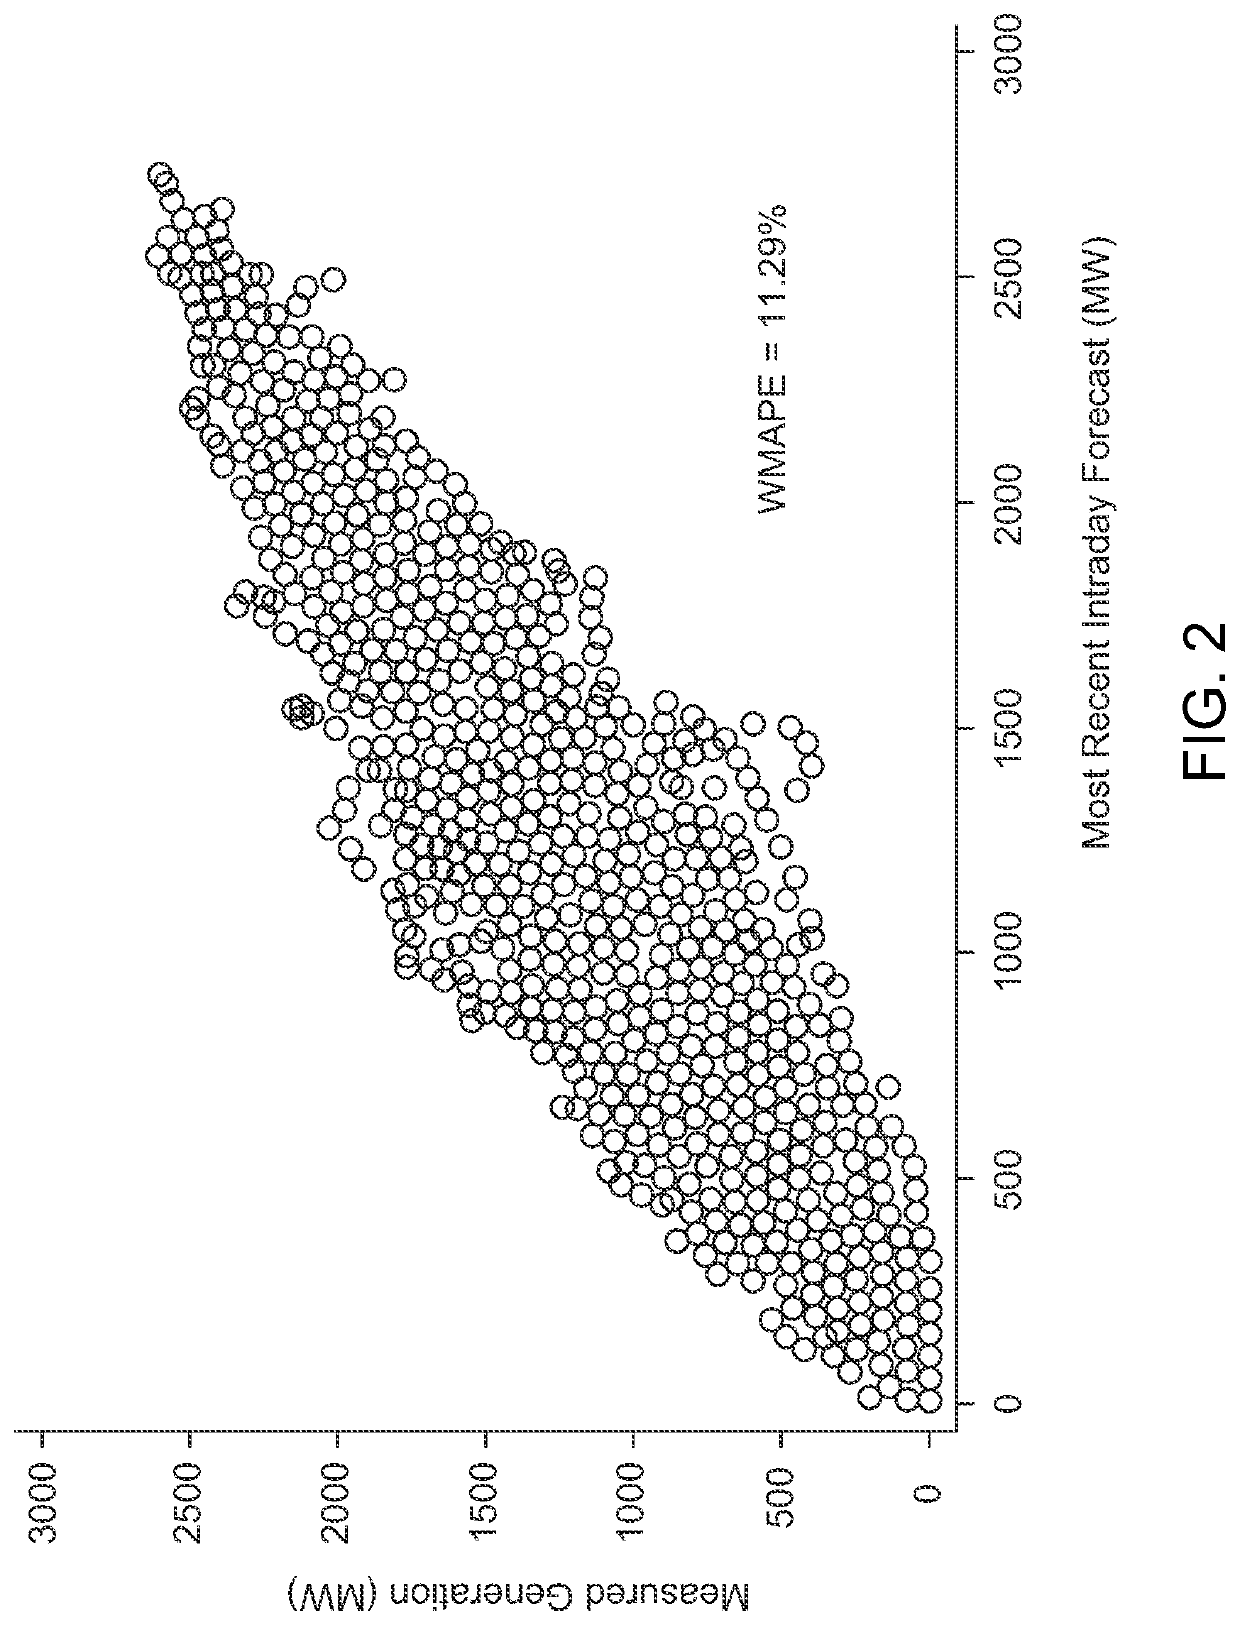
Accordingly, traditional approaches to forecasting
solar energy have large errors.
Yet, at this time, Elia has been unable to find a low cost solution to its forecasting challenges.
These price spikes represent instances in which the reliability of the
electric power system was significantly challenged, given that it would not be prudent for a system operator to pay substantially more than the day-ahead price for
electricity unless reliability was under challenge.
The price spikes occur because system operators are unable to make accurate predictions of future operating conditions, making it a key element in maintaining reliability.
Thus, technical challenges with existing computer systems and networks continue to persist.
DERs displace energy that was traditionally supplied by the bulk power system, contributing to declining load on the grid, but adding complexity to operations, market design efforts, and system planning needs.
This complexity arises because shifting load from the bulk power system to local DERs is not the same as eliminating load.
When those resources are not producing energy, the bulk power system must still provide energy to those homes and businesses.
Thus, existing networks and computer systems continued to suffer technological challenges.
As a result, DERs have the potential to
pose a challenge to reliability because forecasting meteorological conditions is imperfect.
Thus, existing networks and computer systems continue to suffer further technological challenges.
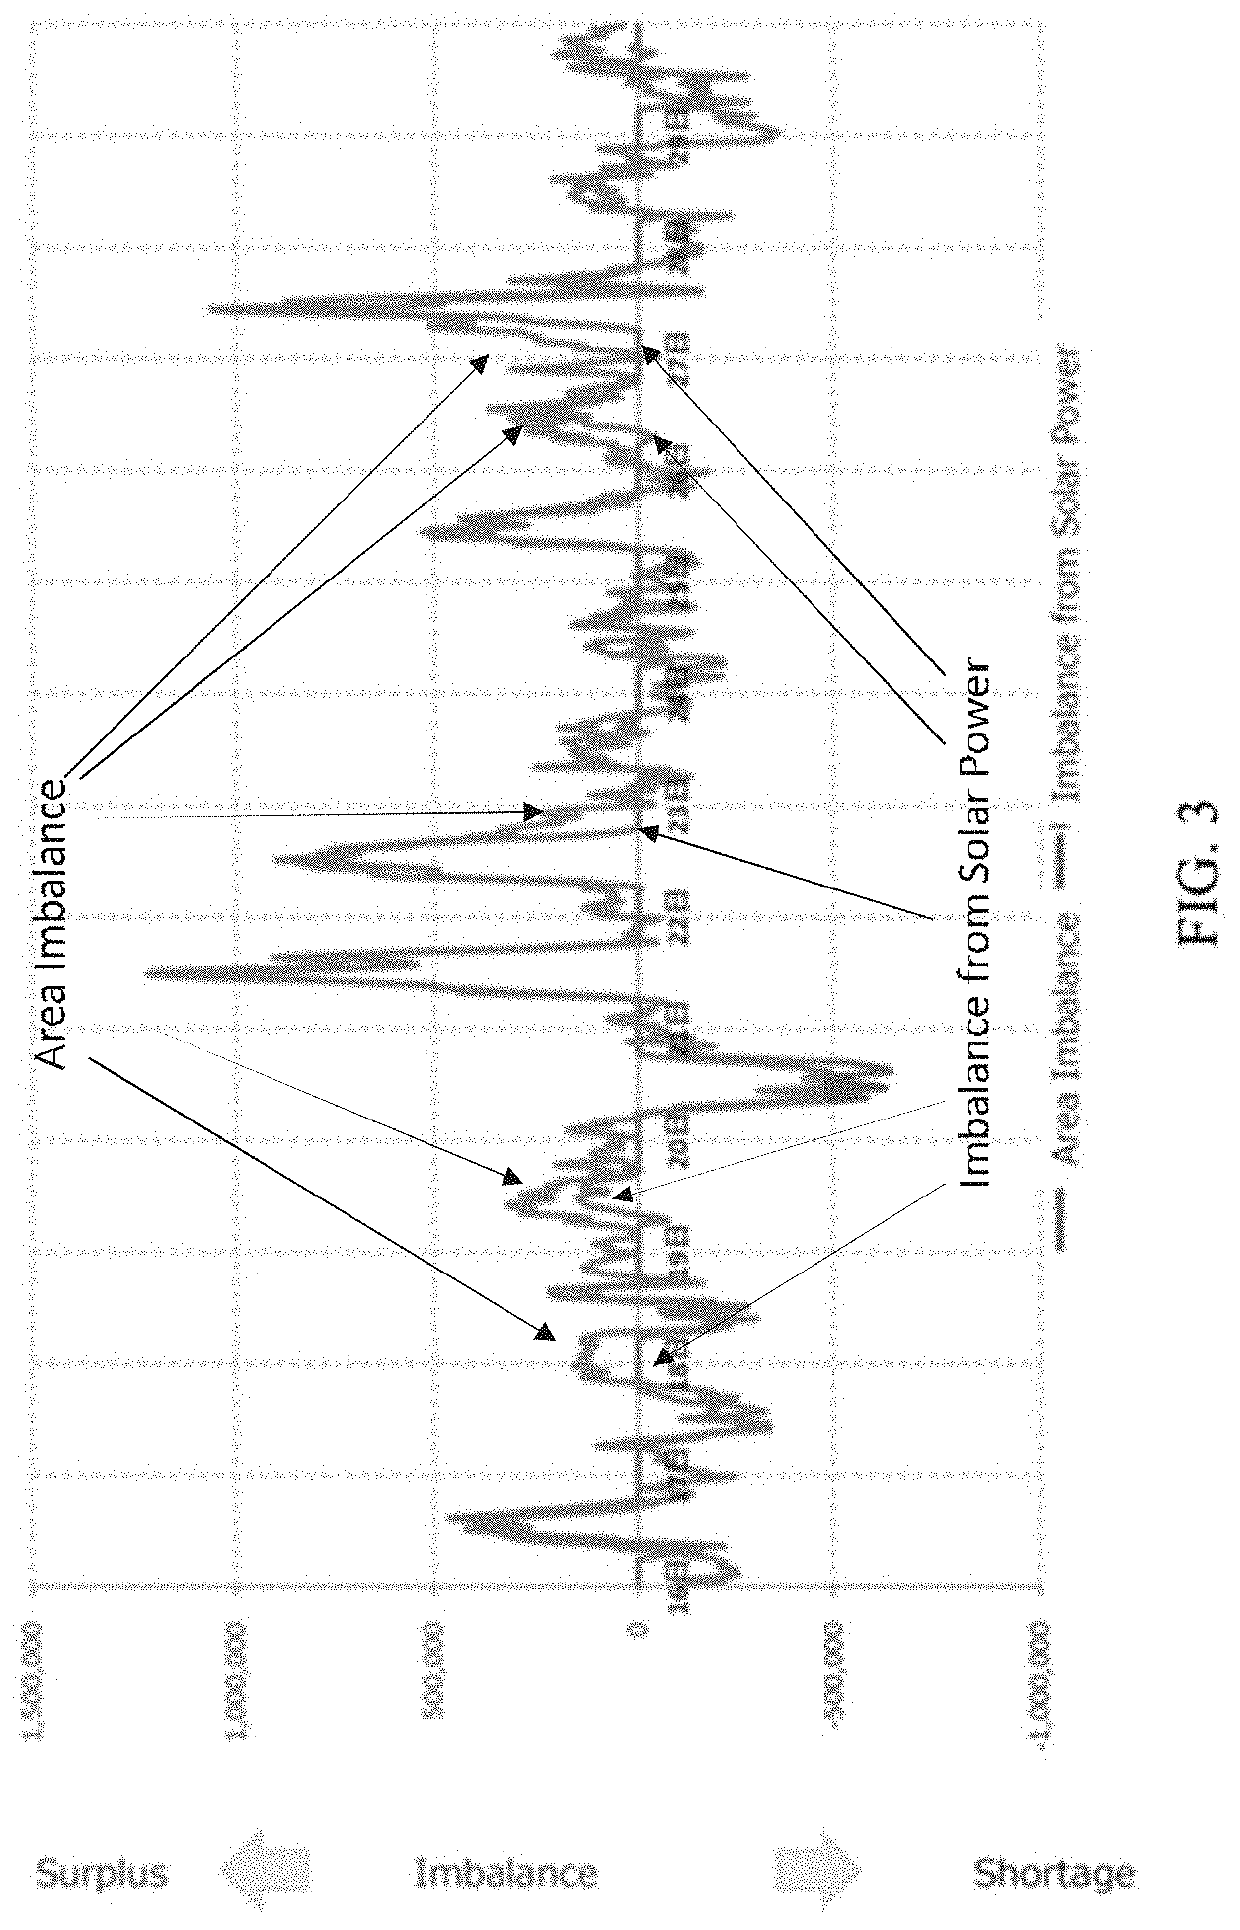
This could result in unanticipated power flows and increased demand forecast errors.
An unexpected loss of aggregated DER could also cause frequency and
voltage instability at sufficient DER penetrations.
In short, DERs, as illustrated by the Duck curve,
pose technological challenges to reliability because of the reduced accuracy of the forecasts for grid-supplied electricity.
However, close inspection of the data indicates that there are instances in which the forecast error exceeds 1,000 MWh.
Specifically, there is little apparent systematic response to negative errors, but positive errors, i.e., actual load exceeding day-ahead forecasted load, are associated with significant differences between the real-time and day-ahead prices.
In short, while the WMAPE in the day-ahead forecasts of load in NYC suggests that the forecasts are accurate, the relationship between the price spikes and load forecast errors in FIG. 6 indicates that forecasts are not sufficiently accurate.
NYISO concedes that these payments are driven by load forecast errors.
The trend in installations of roof-top solar, while conveying environmental benefits, also pose significant technological challenges to existing networks and computer systems.
This can pose technological challenges because the system operator may only have limited information and control over these suppliers.
However, according to Elia, it can only show forecasts and measurements for monitored capacity for which it has detailed
background information.
This is yet another technological challenge of existing networks and systems.
Moreover, the system operator does not have adequate data on the production levels.
These violations pose a risk to equipment and the overall reliability of the
electric power system.
When a large and sustained violation occurs, generators and other equipment connected to the
transmission system may be automatically disconnected to prevent equipment damage, which in turn could result in an electricity blackout.
This adversely affected system frequency in New York State which led to generators going offline which in turn induced further declines in system frequency.
Errors in electricity load forecasts and the failure / inability of suppliers to adhere to their generation and transmission schedules are the root causes of the variability in system frequency.
Current systems are technologically challenged to address and remedy these errors.
Large positive NIV values are especially problematic as most conventional generating technologies require non-negligible response times when additional generation is needed.
While the level of balancing activity in the British power grid has increased, the performance of its balancing system has significantly declined in recent years.
There was also a loss of about 980 MW in generation from an offshore wind farm and a gas-fired generating
station.
These losses triggered the further loss of another 350 MW of embedded generation.
Unfortunately, there was a further trip at the gas-fired generating
station and system frequency decreased to 48.8 Hz (
National Grid ESO, 2019c, p.

