Electrohydrogenation of nitriles

Active Publication Date: 2021-11-11
NEW YORK UNIVERSITY
0 Cites 0 Cited by

AI-Extracted Technical Summary

Problems solved by technology

These normally require high temperature, pressure, may use expensive catalysts (e.g., palladium, ruthenium, rhodium), and entail a series of risks and energy losses associated with transporting, storing, and handling compressed hydrogen.
However, faradaic efficiencies in organic electrohydrogenations tend to ...

Benefits of technology

[0008]The conversion of adiponitrile (ADN) to hexamethylenediamine (HMDA) is an example of a carbon-nitrogen bond hydrogenation that can be done electrochemically using, for example, Raney Nickel or palladium electrodes. This process can impact the annual production of nearly 2M tons of HMDA, a chemical product used as detergent, insecticide, emulsifying agent, and most importantly, as a monomer in the manufacture of nylon 6,6. It may be further coupled with already existing electrosynthetic routes to manufacture ADN, contributing to the electrification and intensification of the large scale production of nylon 6,6. The risk associated with the high pressure and compre...

Abstract

Provided are methods of making aliphatic or aromatic compounds (e.g., small molecules or polymers) having one or more amine groups and/or imine groups. A method of the present disclosure is an electrohydrogenation method, where a potential is applied to an aliphatic or aromatic compound (e.g., small molecule or polymer) having one or more nitrile groups, where after the potential is applied one or more of the nitrile groups are reduced to an amine or imine. The electrohydrogenation may be carried out using non-pulsed or pulsed potential waveforms.

Application Domain

CellsNon-noble metal oxide coatings +2

Technology Topic

ImineNitrile +4

Image

  • Electrohydrogenation of nitriles
  • Electrohydrogenation of nitriles
  • Electrohydrogenation of nitriles

Examples

  • Experimental program(1)

Example

Example
[0056]This example provides a description of methods and compositions of the present disclosure.
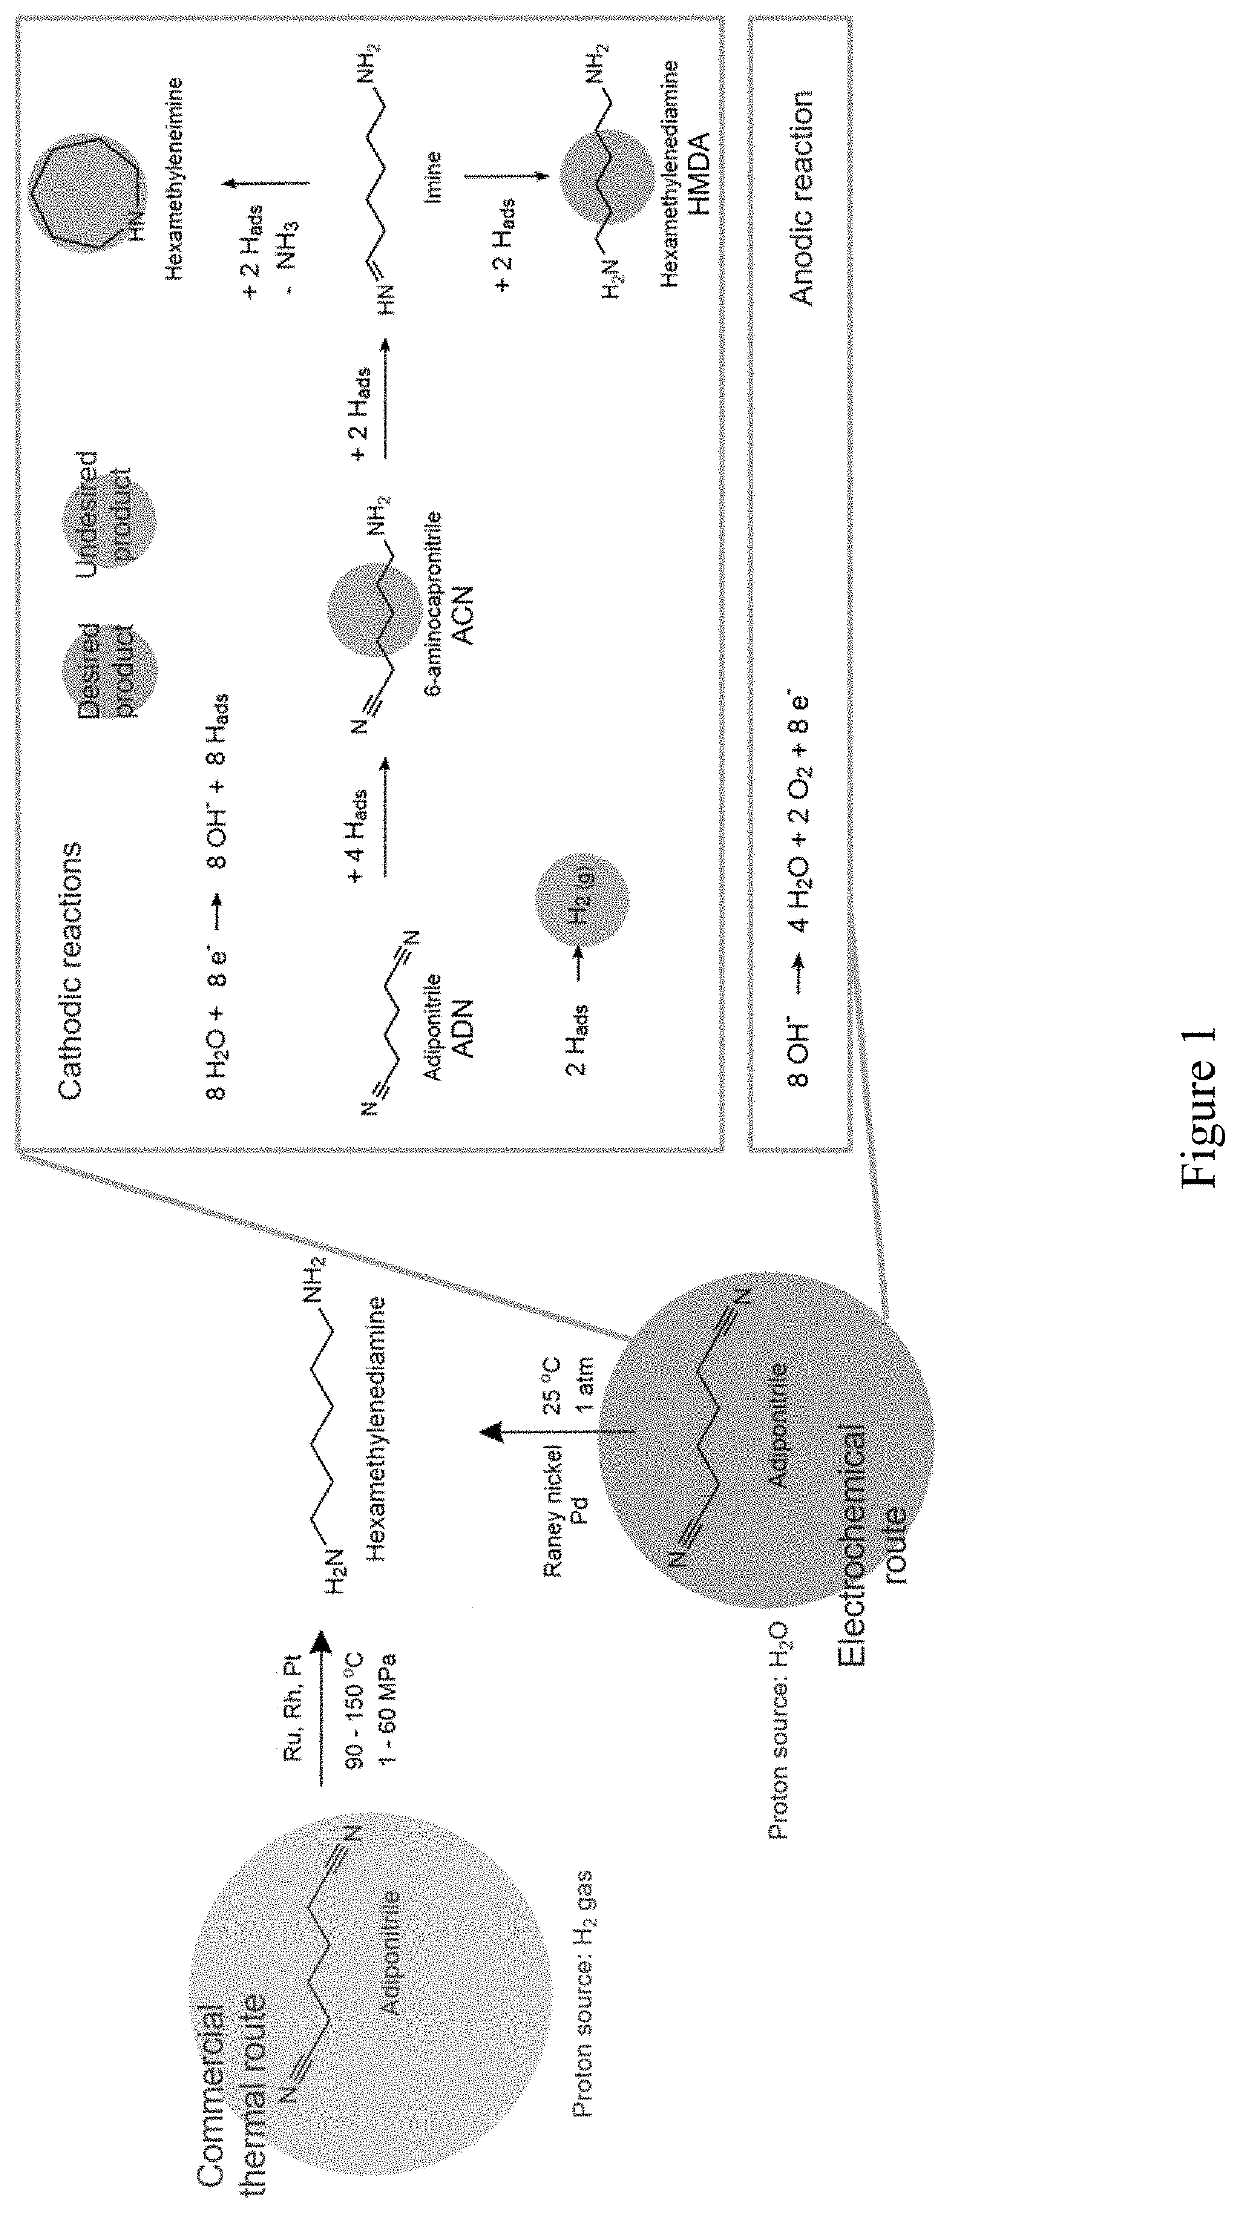
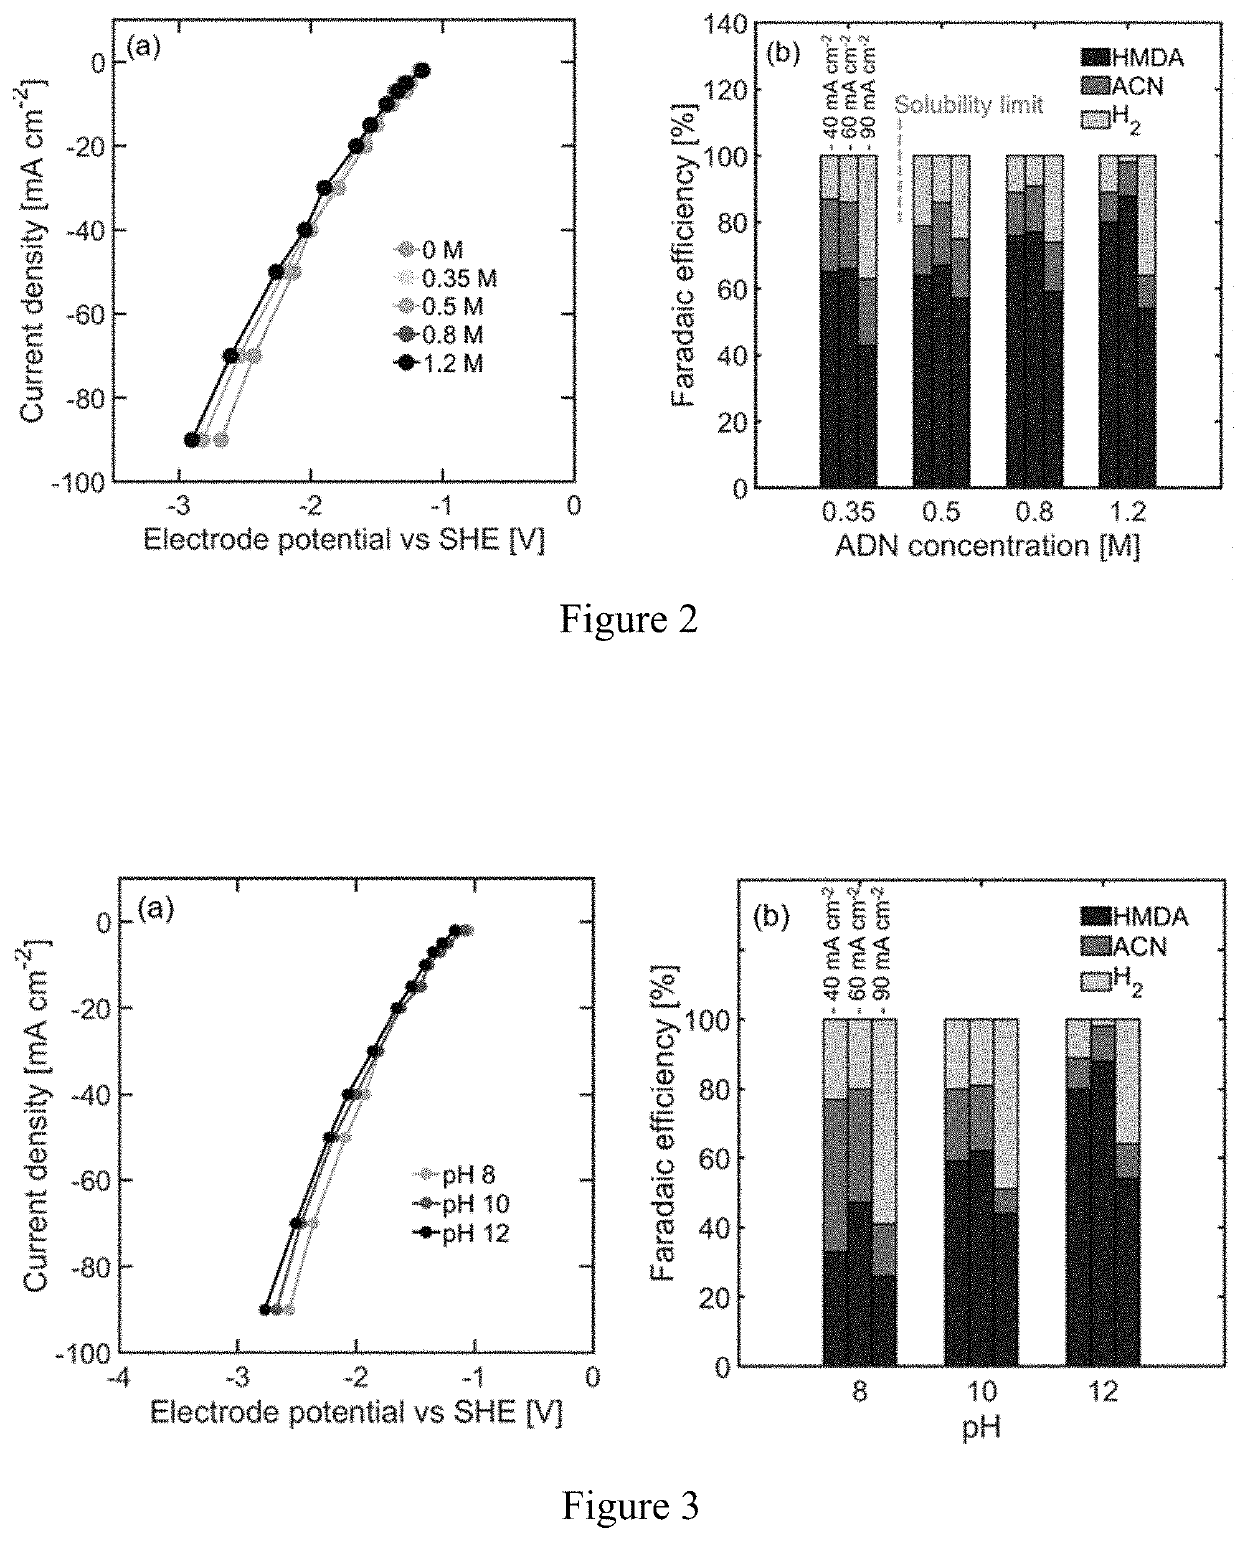
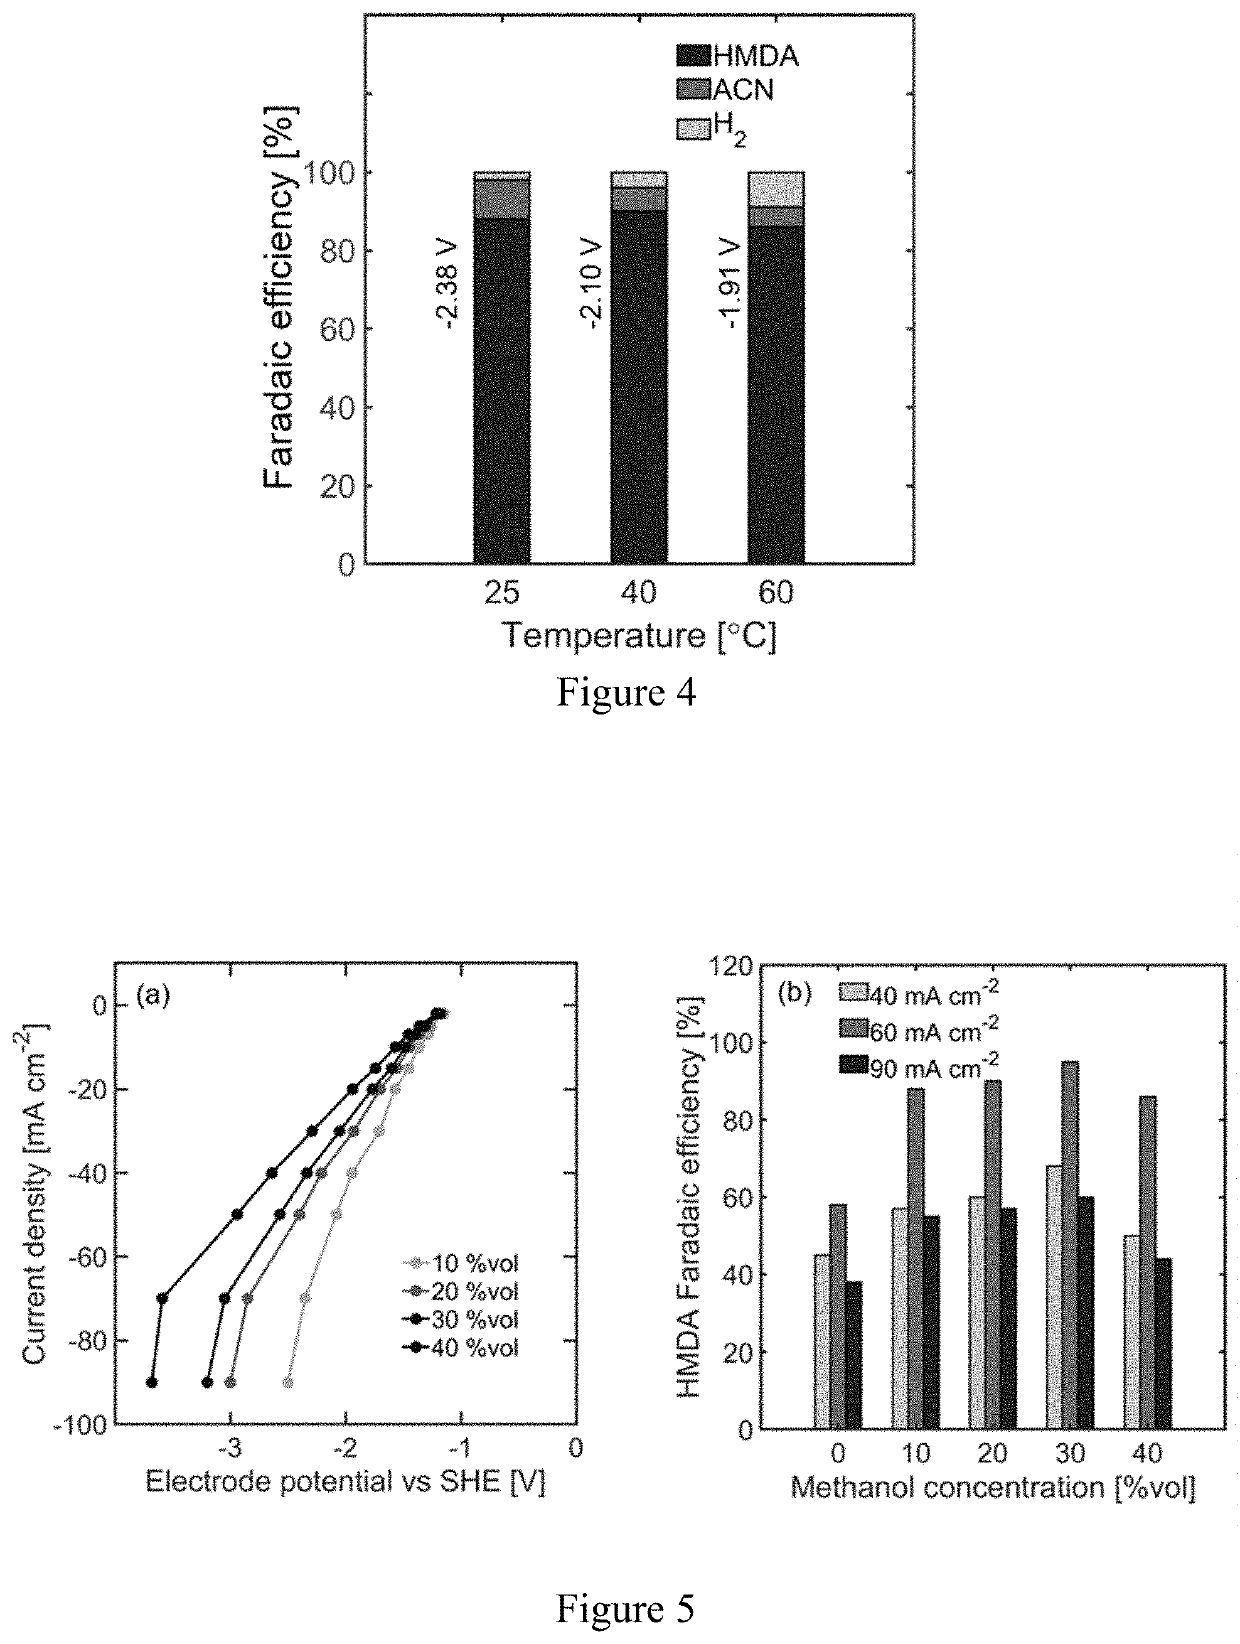
[0057]Using the hydrogenation of adiponitrile to hexamethylenediamine (HMDA), a monomer used in the production of nylon-6,6, the effect of reactant concentration, temperature, pH, and organic cosolvents on the ECH of nitrile groups with Raney nickel electrodes was investigated. Higher reactant concentrations, alkaline electrolytes, and mild temperature (40° C.) are key conditions that enhance the hydrogenation of organic substrates against hydrogen evolution. A maximum faradaic efficiency of 92% toward HMDA was obtained in aqueous electrolytes at −60 mA cm−2. The addition of an organic cosolvent is subsequently studied to evaluate the effect of enhanced reactant solubility, achieving a 95% faradaic efficiency at the same current density with 30% methanol by volume in water. The insights gained from this study are relevant for the design of energy efficient organic ECH and can help accelerate the implementation of sustainable chemical manufacturing.
[0058]Herein, these strategies were deployed to gain insights into the effect of electrolyte composition and electrochemical operation conditions on the faradaic efficiency of HMDA on Rainey nickel electrodes and ultimately identify electrolyte formulations that enhance the performance of this reaction.
[0059]Results and Discussion.
[0060]The kinetic, mass transport, and ohmic limitations in the ECH of ADN can be strongly influenced by the composition of the electrolyte and reaction conditions. In the following sections, the effects of the reactant concentration, temperature, and pH are systematically studied to understand their impact on the reaction selectivity. The effect of organic cosolvents is subsequently investigated to identify potential improvements on reactant solubility and faradaic efficiency toward HMDA.
[0061]Effect of ADN Concentration. The reactant concentration can significantly affect the performance of organic electrochemical transformations in aqueous electrolytes. Larger bulk ADN concentrations can increase the reactant concentration in the electrical double layer (EDL), form a second organic-rich phase, and decrease the electrolyte ionic conductivity. In order to better understand the trade-off between these effects, the ECH of ADN was studied in electrolytes with ADN concentrations ranging between 0.35 and 1.2 M (FIG. 2). The aqueous electrolyte consisted of sodium phosphate as a supporting electrolyte, EDTA as a chelating agent, and tetramethylammonium (TMA) hydroxide to promote higher concentrations of organic reactants at the EDL, as explored in previous studies.
[0062]Although a second organic-rich phase was observed with ADN concentrations above 0.4 M, relatively small effects were observed in the steady state polarization curves (FIG. 2(a)) with and without an organic reactant. This suggests that proton reduction is modulating the electron transfer events at the electrode surface and that a high reactant concentration weakly affects the availability of water molecules in the EDL.
[0063]FIG. 2(b) summarizes the effect of ADN concentration on the faradaic efficiency toward HMDA, ACN, and H2. A mass balance showed that the production of HMDA and ACN accounted for >97% of the ADN converted, suggesting that no other organic byproducts were formed. The remaining charge transferred in each experiment was thus attributed to the H2 evolution reaction (HER), the only other non-organic cathodic byproduct. The results showed an increase in H2 production at higher current densities, suggesting that hydrogen gas generation becomes faster than the rate of the hydrogenation of organic substrates. This is likely the result of faster reaction rates at higher current densities, which leads to faster reactant consumption and can in turn reduce the local reactant concentration and organic surface coverage. Previous studies have observed a similar increase in H2 generation at higher current densities due to changes in the surface coverage. HMDA production is thus enhanced with low-to-intermediate current densities, achieving the highest HMDA faradaic efficiency at −60 mA cm−2 for all ADN concentrations. The faradaic efficiencies reported are also a consequence of the reactant conversion, which varies with the current density and reactant bulk concentration (see FIG. 7). Low conversions are desired to minimize variations on the reactant bulk concentration, but the experimental time of 2 h was selected to maintain conversions between 7 and 24%, since the NMR quantification accuracy severely suffered with conversions below 6%. Although the comparison of faradaic efficiencies is done under different reactant conversions, there is a <10% conversion difference on the values taken to compare the effect of the current density and concentration.
[0064]The faradaic efficiency toward HMDA increases with increasing ADN concentrations, suggesting that higher fluxes of the organic substrate to the cathode facilitate the complete reduction of the ADN nitrile groups while limiting the HER. The production rate of the partially hydrogenated product is also controlled at higher ADN concentrations, most likely as the result of a balance on diffusive fluxes of organic molecules between the electrode and bulk electrolyte. ACN production is also generally reduced with high reactant conversions, which favors the complete hydrogenation of the nitrile groups. However, faradaic efficiencies will vary in time under batch operation, and the values reported herein are average efficiencies over the time of each batch experiment. A maximum faradaic efficiency of 88% is found for electrolytes with the highest ADN concentration explored (1.2 M) at a current density of −60 mA cm−2.
[0065]Effect of pH. The electrolyte pH determines the concentration of available protons for electrochemical and bulk reactions. A lower electrolyte pH can improve the kinetics of the proton reduction step, thus increasing the generation of adsorbed hydrogen atoms (Hads). However, the pH effect on the selectivity is complex, as the higher surface concentration of Haas could enhance the HER rate instead of the hydrogenation of organic species.
[0066]FIG. 3(a) shows the effect of electrolyte pH on the steady state polarization curves. There is a slight decrease in the overpotential at a lower pH, which could suggest that proton reduction, the main driver of the electron transfer rate, is facilitated by a higher proton concentration. On the other hand, FIG. 3(b) shows the significant effect that pH has on the faradaic efficiency. Despite the lower proton concentration at a higher pH, the partial hydrogenation of ADN to ACN is limited, while the complete hydrogenation to HMDA is favored. The increase in the faradaic efficiency toward HMDA with a higher pH at all current densities is also expected to be maintained with electrode potential, as shown in FIG. 8. This effect on the hydrogenation of organic molecules could be due to variations on the surface coverage of reduced protons at different pH conditions. A lower surface coverage of adsorbed hydrogen is expected under alkaline conditions, owing to slower water dissociation kinetics, further increasing the adsorption of water or organic molecules on the electrode surface and favoring the hydrogenation of organic substrates, while limiting the HER. No significant variations were observed in the solubilized ADN concentration (see FIG. 9), suggesting that the effect of pH on the product distribution is not a consequence of variations in the organic solubility. Finally, the lower bulk proton availability at higher electrolyte pH values also helps limit the HER, demonstrating that basic electrolytes are required to maintain high faradaic efficiency toward HMDA.
[0067]Effect of Temperature. The reaction temperature can strongly influence reaction kinetics and mass transport in electrochemical hydrogenations. Higher temperatures increase the electrolyte conductivity, reactant solubility, diffusion coefficient of species, and electrode reaction rates. These effects can reduce energy losses, yielding lower electrode potentials at higher temperature, as is observed in FIG. 4.
[0068]Although reaction overpotentials can be reduced with higher temperatures, FIG. 4 shows no significant effect on the faradaic efficiency. A slight increase of the faradaic efficiency toward HMDA is observed at 40° C., likely due to the improved reactant solubility and the enhanced reactant flux toward the reaction surface. Stronger hydrogen evolution is observed at higher temperatures, suggesting a larger increase on water splitting kinetics and H2 evolution. A maximum of 92% faradaic efficiency toward HMDA is found at 40° C.
[0069]Effect of Organic Cosolvent. Although aqueous electrolytes are benign and offer inherent cost advantages, organic cosolvents can improve the reactant solubility and enhance mass transfer rates of organic molecules to the electrode, at the expense of reduced electrolyte conductivity. In the case of organic ECH, water is a source of protons in the reaction, and thus the incorporation of alcohols in the electrolyte can lower the proton concentration and affect reaction overpotentials. In order to understand the effect of organic cosolvents in the ECH of ADN to HMDA, varying concentrations (0-40% volume) of methanol cosolvent were studied.
[0070]Increasing the methanol concentration improved the solubility of ADN in the electrolyte, reaching complete miscibility for methanol concentrations >40% by volume (see FIG. 11). FIG. 5(a) shows the effect of an organic cosolvent on the steady state polarization curves. A significant increase in the overpotential is observed for higher methanol concentrations. This could be due to the lower proton concentration (observed pH increase from 7.4 to 8.3 with increasing methanol content) and the reduced concentration of water molecules, which act as the main proton source (FIG. 5(a)). Although the electrolyte conductivity decreased from 45 to 31 mS cm−1 (see FIG. 12) for the same range of methanol concentrations, this is not reflected on the polarization curves, as they have been compensated for ohmic losses (see below for calculation details).
[0071]FIG. 5(b) summarizes the variations on the faradaic efficiency toward HMDA with methanol concentration. Faradaic efficiencies toward ACN are not reported in this case, as their quantification was not accurate. The collected GCMS and NMR spectra (see below) strongly suggest that methoxyamines are formed with a high methanol content from the homogeneous reaction of imines and alcohols. The NMR spectra of these methoxyamines (see FIG. 13) overlapped with that of ACN.
[0072]It is important to note that sodium phosphate was not soluble at 0.5 M in the presence of methanol. Sodium acetate was thus used as the supporting electrolyte, maintaining the cation molarity in the system. FIG. 5(b) shows a faradaic efficiency of 58% for 0% methanol by volume at −60 mA cm2, which is notably lower than the 85% obtained with 1.2 M ADN in phosphate-based aqueous electrolytes. This is likely due to the lower electrolyte pH (i.e., pH 8 with acetate versus pH 12 with phosphate). There is, however, an important increase of the faradaic efficiency with the addition of the organic cosolvent at a fixed current density, reaching an unprecedented maximum faradaic efficiency of 95% with 30% methanol by volume (Table 1). Once methanol is added in the electrolyte, no significant variations were observed in the faradaic efficiency with the electrolyte pH (see FIG. 15). Although the addition of methanol can improve the reactant solubility and favor HMDA formation, the results suggest that there is a drop in the faradaic efficiency for higher methanol concentrations, most likely owing to the loss of HMDA and intermediates to methoxyamines in homogeneous reactions.
TABLE 1 Summary of the System Performance and Experimental Conditions for Previous Systems on the ECH of ADN to HMDA, where the italicized entry is the present disclosure. Year Electrode Electrolyte Performance 1961 Spongy Ni Aqueous, HCl-based 20° C. 60% yield 1965 Raney Ni Aqueous, NaOH- <40% faradaic efficiency based 5-8° C. 1972 Raney Ni Ethanol-based 25° C. 45% faradaic efficiency 1982 Raney Ni Methanol-based 25° C. 56% faradaic efficiency 1990 Raney Ni Aqueous, alcohol- 30% faradaic efficiency based −25 ° C. 2020 Raney Ni Aqueous 25° C., 88% faradaic efficiency, methanol-based 25° C. 95% faradaic efficiency
[0073]Conclusions. Introduced herein is a systematic approach for the development of an efficient ECH route to HMDA in aqueous electrolytes. The characteristics of steady state polarization curves are dictated by proton reduction kinetics, which can be affected at high organic concentrations due to the lower proton availability. Hydrogen evolution and the formation of the partially hydrogenated amine (ACN) are the main competing reactions. Two-phase electrolytes with high reactant concentrations led to higher faradaic efficiencies to HMDA, suggesting that the high reactant concentration near the electrode surface is critical to promote the addition of hydrogen to the organic substrate. Low-to-intermediate current densities favored HMDA formation, and higher current densities strongly favored H2 evolution. The HER and ACN formation were also significantly favored at intermediate pH values (i.e., pH of 8-10), highlighting the need for an alkaline electrolyte pH, and lower proton concentrations, to limit the main side reactions and to increase HMDA production. As shown in Table 1, a maximum of 88% faradaic efficiency was found at room temperature, a pH of 12, 1.2 M ADN, and −60 mA cm−2. A 92% faradaic efficiency was further achieved by increasing the reaction temperature to 40° C., while higher temperatures began to limit HMDA formation, owing to a stronger enhancement in the kinetics of hydrogen evolution.
[0074]Given that HMDA production is favored at reactant concentrations above the solubility limit, the addition of methanol as an organic cosolvent (10-40% volume) was studied. The addition of the methanol cosolvent led to an increase in the reaction overpotential, likely due to a lower availability of water molecules. Although there was a drop in the electrolyte conductivity (45 to 31 mS cm−1) from 10 to 40% methanol by volume, the enhanced solubility of ADN appears to have improved the reactant flux to the electrode, achieving a 95% faradaic efficiency with 30% methanol by volume. A decrease in the faradaic efficiency is observed for higher methanol concentrations, likely due to the loss of organic intermediates to methoxyamines formed in bulk reactions with methanol. The insights provided by this work can help mitigate the main obstacles in the implementation of the large-scale organic ECH of nitriles in benign aqueous electrolytes, further contributing to the deployment of safer and more sustainable processes for chemical manufacturing.
Experimental
[0075]Materials. All chemicals used were acquired from Sigma-Aldrich, including nickel(II) sulfate hexahydrate, ammonium chloride, boric acid, aluminum nickel catalyst (30-70 μm particle diameter), sodium hydroxide, hydrochloric acid, sodium phosphate, ethylenediaminetetraacetic (EDTA) acid disodium salt, tetramethylammonium (TMA) hydroxide, sodium acetate, deuterium oxide, ethylene glycol, HMDA, and ADN.
[0076]A fresh aqueous solution with 0.5 M sodium phosphate, 0.03 M EDTA, and 0.02 M TMA hydroxide was prepared with 0.2-1.2 M ADN for each experiment, unless specified differently. This aqueous solution was used as a catholyte and 1 M sulfuric acid as an anolyte. A Nafion 117 membrane from the Nafion Store was used to separate the anodic and cathodic compartments. No significant pH changes were measured throughout the course of the experiment, suggesting negligible acid crossover through the membrane.
[0077]A 1 cm2 nickel foil (American Elements) was used as the substrate for the electrodeposition of the Raney nickel catalyst. A platinum mesh (Alfa Aesar) was used as a counter electrode and a Ag/AgCl reference electrode (Pine Instruments) in 4 M KCl as the reference electrode.
[0078]Electrode Preparation. Raney nickel electrodes were electrodeposited from an electrolyte containing 4 g of aluminum nickel (AlNi) catalyst dispersed in a 50 mL aqueous solution of 0.8 M nickel(II) sulfate, 0.3 M ammonium chloride, and 0.2 M boric acid, as reported in the literature. A nickel foil was pretreated for 5 min in 8 M sodium hydroxide and for 5 min in 1 M hydrochloric acid in order to remove the impurities from the electrode surface. The electrolyte solution was vigorously stirred (at 1200 rpm with a 1 cm long stirring bar) to maintain the AlNi particles suspended in the solution. The temperature was maintained at 40° C. during the electrodeposition process. A current density of −40 mA cm2 was applied for 80 min, and the electrode was subsequently leached in a 5 M sodium hydroxide solution for 2 h. The Raney nickel electrodes were prepared and stored in deionized water for 24 h before use. Each electrode was operated for 12 h, and no significant variations of the faradaic efficiency were observed throughout this time under pH 12 electrolytes. The electrode geometrical area (1 cm2) was used for the calculation of the apparent current densities that are reported throughout the manuscript.
[0079]Electrochemical Characterization. The effects of electrolyte composition, temperature, and current density on the ECH of ADN to HMDA were studied using a three-electrode setup. Electrochemical impedance spectroscopy (EIS) and chronopotentiometry (CP) were performed using a BioLogic VSP-300 potentiostat. EIS experiments were performed with frequencies varying from 7 MHz to 1 Hz and an amplitude of 10 mV to determine the ohmic drop between the working and reference electrodes. CP was carried out for 2 h, leading to ADN conversions between 7 and 24%, depending on the current density.
[0080]All experiments were carried out in a machined Teflon H-cell with a Nafion 117 membrane separating the two chambers to avoid the deposition of metal ions from the anodic chamber onto the cathode surface and to facilitate the study of phenomena taking place at the cathode (see FIG. 6 for a cell sketch). Viton O-rings were used to seal the membrane between the two chambers.
[0081]A constant electrolyte volume of 8 mL was used for each experiment, and the temperature was controlled using a hot plate and a sand bath. The catholyte was continuously stirred (at 700 rpm with 0.7 cm long stirring bar) in all experiments.
[0082]Chemical Analysis. NMR samples consisting of 200 μL of catholyte solution, 750 μL of deuterium oxide, and 50 μL of ethylene glycol were prepared. The analysis was performed using a Bruker Avance III 400 NMR. Standard samples were used to identify peaks and chemical shifts in the spectra (see below for details). Product quantification was performed by calculating the hydrogen equivalents from ethylene glycol (details below). The characterization of methoxyamines was also performed using a Shimadzu gas chromatographer equipped with a mass spectrometer GCMSQP2010. A B30PCI CVR SympHony meter was used to measure the electrolyte conductivity and pH. Faraday's law was used to correlate the applied current in each experiment to the consumption/generation of each species. Further details on the calculations for HMDA faradaic efficiency are shown below.
[0083]Faradaic efficiency calculations. Faradaic efficiency towards HMDA and by-products was calculated using the following equation:
F ⁢ ⁢ E k = Q k Q total ( 1 )
where FEk corresponds to the faradaic efficiency towards species k. The total charge (Qtotal) is calculated as the current density multiplied by the total experimental time in seconds. The charge used for the production/consumption of species k (Qk) is obtained through Faraday's law:
n k = i k ⁢ t n ⁢ ⁢ F = Q k n ⁢ ⁢ F ( 9 )
where nk corresponds to the moles of species k consumed or produced, n to number of electrons involved in the reaction, i to the current in A, t to the time in s, and F to Faraday's constant.
[0084]IR compensation calculations. All reported working electrode potentials on the manuscript accounted for the IR compensation (IRcomp), and reported values were calculated according to the following equation:
EWE=Eapp+ERE−IRcomp
where EWE and ERE correspond to the potential at the working and reference electrode, respectively, and Eapp corresponds to the applied voltage. All IR drop compensations were performed after experiments were carried out.
[0085]Standard reaction potential calculations. Standard reaction potentials were calculated from Gibbs free energy values obtained from the literature.
[0086]Cathodic Half-Cell Reaction
ADN+8e−+8H2O→HMDA+8OH−
ΔG° HMDA=132.54 KJ/mol
ΔG° ADN=253.31 KJ/mol
ΔG° H2O=−237.14 KJ/mol
ΔG° OH=−157.2 KJ/mol
[0087] E ° = Δ ⁢ ⁢ G rxn o - n ⁢ F = 5 ⁢ 1 ⁢ 8750 ⁢ ⁢ J / mol - 8 · 96485 ⁢ ⁢ C / mol = - 0 . 6 ⁢ 7 ⁢ ⁢ V ⁢ ⁢ vs ⁢ ⁢ SHE
[0088]Anodic Half-Cell Reaction
8 ⁢ ⁢ OH - → 4 ⁢ H 2 ⁢ O + 2 ⁢ O 2 + 8 ⁢ e - E ° = Δ ⁢ ⁢ G rxn ° - nF = 309040 ⁢ ⁢ J / mol - 8 · 96485 ⁢ ⁢ C / mol = - 0.4 ⁢ ⁢ V ⁢ ⁢ vs ⁢ ⁢ SHE
[0089]EIS measurements. The solution resistance was obtained from the low x-intercept from a semi-circle fit on the EIS data. The equivalent circuit proposed is characteristic of two-phase systems and has already been studied for oil emulsions in water. For this system, the proposed equivalent circuit consists of a resistor in parallel with a constant phase element for each time constant.

PUM

no PUM

Description & Claims & Application Information

We can also present the details of the Description, Claims and Application information to help users get a comprehensive understanding of the technical details of the patent, such as background art, summary of invention, brief description of drawings, description of embodiments, and other original content. On the other hand, users can also determine the specific scope of protection of the technology through the list of claims; as well as understand the changes in the life cycle of the technology with the presentation of the patent timeline. Login to view more.

Similar technology patents

Optical PUF as well as preparation method and application thereof

PendingCN114107903APromote productionDensity controllableMaterial nanotechnologyVacuum evaporation coatingPhysicsElectronic chip
Owner:INST OF ELECTRONICS ENG CHINA ACAD OF ENG PHYSICS

Processes for increasing an octane value of a gasoline component

ActiveUS20200407649A1Promote productionReduce amountNaphtha treatmentGasoline stabilisationCyclohexanesProcess engineering
Owner:UOP LLC

Blind rivet nut

ActiveUS20180112702A1Reduce material and thus massPromote productionNutsBoltsEngineeringRivet
Owner:GESIPA BLINDNIETTECHNIK GMBH

Classification and recommendation of technical efficacy words

  • Promote production

Display device

ActiveUS20080203898A1Promote productionChromatic purity is improvedIncadescent screens/filtersDischarge tube luminescnet screensOptoelectronicsRed light
Owner:SEIKO EPSON CORP

Injection of bone marrow-derived conditioned medium for angiogenesis

InactiveUS20060051334A1Enhances blood vessel formationPromote productionBiocidePeptide/protein ingredientsHypoxia-inducible factorsGreek letter alpha
Owner:MEDIVAS LLC
Why Eureka
Try Eureka