Method and apparatus for measuring light intensity for imaging

a technology of light intensity and imaging, applied in the field of light intensity measurement, can solve the problems of restricted use of near-infrared spectroscopy, and achieve the effects of improving the overall resolution of the system, improving resolution, and accurately detecting

Pending Publication Date: 2022-02-03
CORTIRIO LTD
View PDF0 Cites 0 Cited by
  • Summary
  • Abstract
  • Description
  • Claims
  • Application Information

AI Technical Summary

Benefits of technology

[0047]Generating light intensity measurements for imaging by comparing “relative” output of adjacent light detectors allows improved resolution imaging to be performed, particularly for near-infrared spectroscopy medical imaging applications where the difference in incident light tends to be small from pixel to pixel. Generating imaging data based on the difference in light intensity between light detectors rather than the “absolute” light intensity detected by each light detector allows these small differences to be more accurately detected thus improving the overall resolution of the system.
[0048]Furthermore, a higher density photodiode array can be more usefully used because differences in detected light intensity that would otherwise be lost as noise if the output of each light detector was processed individually (due to the closer proximity of light detectors) can be more readily detected.
[0049]The technique further includes use of a second measurement mode in which the output signal from each light detector are individually measured. In this measurement mode large differences between pixels can be more accurately detected. By providing this second measurement mode, composite imaging data can be generated which includes imaging data generated using the first measurement mode (to identify fine detail where light intensity varies a smaller amount from pixel to pixel) and imaging data generated using the second measurement mode (to more accurately represent regions where larger differences exist, for examples edges and so on).

Problems solved by technology

As a result, use of near-infrared spectroscopy tends to be restricted to places where the necessary equipment (suitable power supplies etc) are found.

Method used


Image

  • Method and apparatus for measuring light intensity for imaging
  • Method and apparatus for measuring light intensity for imaging
  • Method and apparatus for measuring light intensity for imaging

Examples


Embodiment Construction

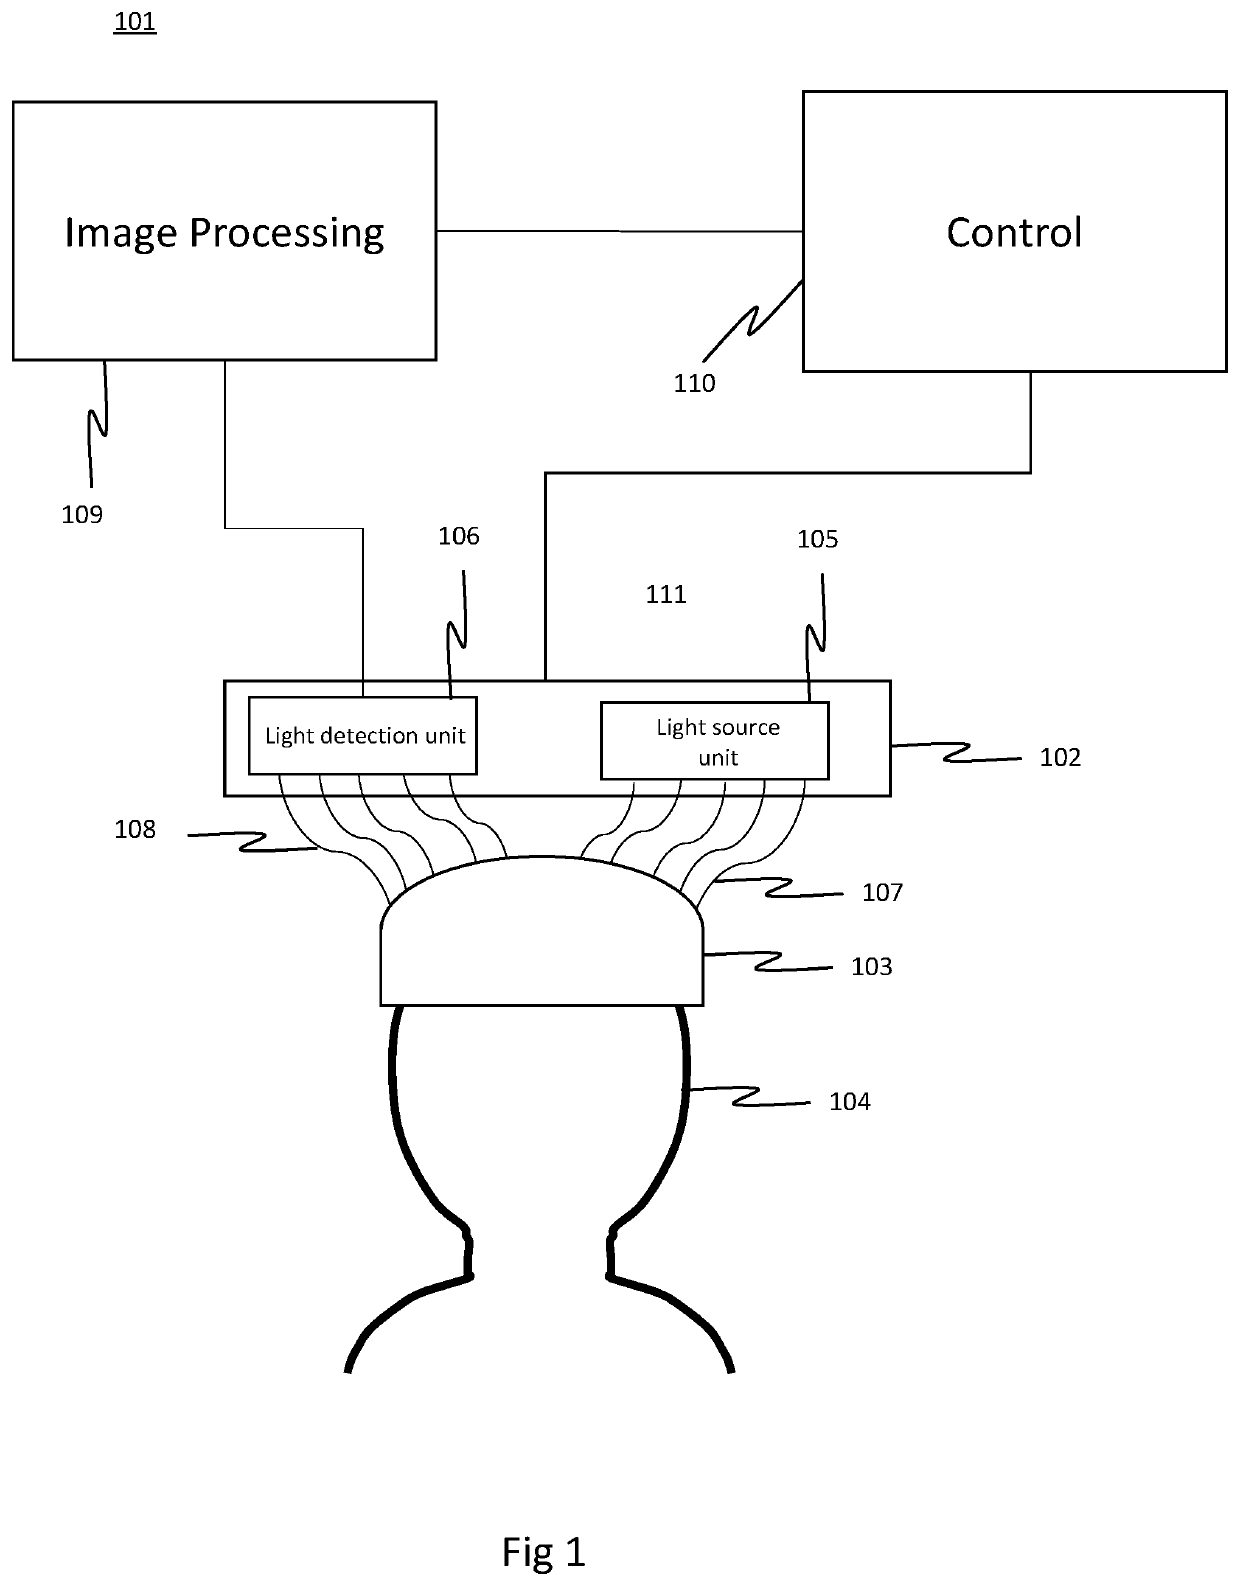
[0073]FIG. 1 provides a simplified schematic diagram of a near-infrared spectroscopy apparatus 101 for performing imaging operations on a subject.

[0074]The apparatus 101 comprises a headset connected to a measurement module 102. The measurement module 102 comprises a light source unit 105, a light detection unit 106. In use, the head set 103 is fitted over the head 104 of a subject.

[0075]The light source unit 105 comprises an array of light emitters, typically an array of light emitting photodiodes (LEDs). The LEDs may be of the same type or may be of different type, for example, two or three different types, producing different wavelengths of light.

[0076]It will be understood that “light” in the context of embodiments of the invention, refers generally to electromagnetic radiation within the frequency range typically used in near-infrared spectroscopy applications.

[0077]The measurement module 102 further comprises a first set of light conduits 107 referred to as “optodes”. At a fir...


PUM


Abstract

A method of measuring light intensity for imaging using a light detector array comprising a plurality of light detectors arranged to generate an output corresponding to an intensity of incident light. In a first measurement mode the light detector array generates a first plurality of output signals, each generated by one group of proximate light detectors, each group comprising a light detector pair, the first plurality of output signals each corresponding to a difference between the light intensity detected by the light detectors of the group, and generating a light intensity measurement for each group from each received output signal of the first plurality of output signals. In a second measurement mode the light detector array generates a second plurality of output signals, and a light intensity measurement is generated for each light detector from the second plurality of output signals.

Description

TECHNICAL FIELD[0001]The present invention relates to techniques for measuring light intensity in imaging applications.BACKGROUND[0002]Near-infrared spectroscopy techniques for medical imaging, in particular for cranial imaging are known. Such techniques can be used to measure oxygenation and microvascular function and can therefore be used to detect and assess issues such as intra-cranial hematomas.[0003]Typically, near-infrared spectroscopy scanners use an array of high-powered light emitters to direct light into the cranium of a subject and then measure corresponding light detected at an array of light detectors. Imaging information can be generated from the detected light which enables information about the condition of the cranial space (such as the presence and extent of a hematoma) to be determined.[0004]Near-infrared spectroscopy scanners are typically smaller and more portable than other medical scanning technology such as computed tomography (CT) scanners and magnetic reso...

Claims


Application Information

Patent Timeline
Patent Type & Authority Applications(United States)
IPC IPC(8): A61B5/00G01J1/16G01J3/28G01J1/42
CPCA61B5/0075G01J1/16G01J2001/446G01J1/4228G01J3/2823G01J1/44G01J2001/444G01J3/2803
Inventor BELDON, PATRICK JOHNMACEY, PAUL DAVID
Owner CORTIRIO LTD
Why Eureka
Try Eureka